Out beyond the orbit of Neptune lurk millions of icy bodies called Trans-Neptunian Objects. We haven’t found and seen them them all yet, but astronomers have theorized the numbers. However, since 1992, nearly a thousand TNOs have been observed. Most of them are very small and receive little sunlight, which makes them faint and difficult to spot. But a group of astronomers have devised a clever new technique to find TNOs and discovered 14 just by using archived data from the Hubble Space Telescope, and they hope to be able to uncover hundreds more.
“Trans-Neptunian objects interest us because they are building blocks left over from the formation of the solar system,” said lead author Cesar Fuentes.
As TNOs slowly orbit the sun, they move against the starry background, appearing as streaks of light in time exposure photographs. The team developed software to analyze hundreds of Hubble images hunting for such streaks. After promising candidates were flagged, the images were visually examined to confirm or refute each discovery.
Most TNOs are located near the ecliptic — a line in the sky marking the plane of the solar system (since the solar system formed from a disk of material). Therefore, the team searched within 5 degrees of the ecliptic to increase their chance of success.
The 14 objects include one binary system, kind of like a mini Pluto-Charon system. All were very faint, with most measuring magnitude 25-27 (more than 100 million times fainter than objects visible to the unaided eye).
Additionally, by measuring their motion across the sky, astronomers were able to calculate the orbit and distance for each object. Combining the distance and brightness (plus an assumed albedo or reflectivity), they then estimated the size. The newfound TNOs range from 25 to 60 miles (40-100 km) across.
Unlike planets, which tend to have very flat orbits (known as low inclination), some TNOs have orbits significantly tilted from the ecliptic (high inclination). The team examined the size distribution of TNOs with low- versus high-inclination orbits to gain clues about how the population has evolved over the past 4.5 billion years.
Generally, smaller trans-Neptunian objects are the shattered remains of bigger TNOs. Over billions of years, these objects smack together, grinding each other down. The team found that the size distribution of TNOs with low- versus high-inclination orbits is about the same as objects get fainter and smaller. Therefore, both populations (low and high inclination) have similar collisional histories.
This initial study examined only one-third of a square degree of the sky, meaning that there is much more area to survey. Hundreds of additional TNOs may be hiding in the Hubble archives at higher ecliptic latitudes. Fuentes and his colleagues intend to continue their search.
“We have proven our ability to detect and characterize TNOs even with data intended for completely different purposes,” Fuentes said.
This research has been accepted for publication in The Astrophysical Journal.
While rollover actually happened on September 9th, I thought it may be fitting to post our rollover/tribute video to Discovery. Unlike the first last mission for Atlantis (as opposed to the last, last mission), there is no hope for an additional flight of Discovery. This is really, really the last time Discovery will roll from the orbital processing facility to the VAB. You’re watching the beginning of the end here.
Apologies for not posting the answers to the Where In the Universe Challenges numbers 116 and 117! Does forgetting things like this mean I’m overly busy or just getting older? Anyway, you can find the answers back on the original posts: #116 was this image of a ghostly, mysterious galaxy with anomalous arms, and #117 was a beautiful image of a crescent planetary body— but the challenge was naming WHICH body!
In this special live Dragon*Con 2010 episode of Astronomy Cast we welcomed special guest Les Johnson, Deputy Manager for NASA’s Advanced Concepts Office to talk about the state of human space exploration. And then we opened up the show to some amazing questions from the audience. Listen to the first live show ever done with both Fraser and Pamela in the same room.
And if you’re interested in looking back, here’s an archive to all the past Carnivals of Space. If you’ve got a space-related blog, you should really join the carnival. Just email an entry to [email protected], and the next host will link to it. It will help get awareness out there about your writing, help you meet others in the space community – and community is what blogging is all about. And if you really want to help out, let Fraser know if you can be a host, and he’ll schedule you into the calendar.
The answer to ‘what is atomic mass’ is this: the total mass of the protons, neutrons, and electrons in a single atom when it is at rest. This is not to be associated or mistaken for atomic weight. Atomic mass is measured by mass spectrometry. You can figure the molecular mass of an compound by adding the atomic mass of its atoms.
Until the 1960’s chemists and physicists used different atomic mass scales. Chemists used a scale that showed that the natural mixture of oxygen isotopes had an atomic mass 16. Physicists assigned 16 to the atomic mass of the most common oxygen isotope. Problems and inconsistencies arose because oxygen 17 and oxygen 18 are also present in natural oxygen. This created two different tables of atomic mass. A unified scale based on carbon-12 is used to meet the physicists’ need to base the scale on a pure isotope and is numerically close to the chemists’ scale.
Standard atomic weight is the average relative atomic mass of an element in the crust of Earth and its atmosphere. This is what is included in standard periodic tables. Atomic weight is being phased out slowly and being replaced by relative atomic mass. This shift in wording dates back to the 1960’s. It has been the source of much debate largely surrounding the adoption of the unified atomic mass unit and the realization that ‘weight’ can be an inappropriate term. Atomic weight is different from atomic mass in that it refers to the most abundant isotope in an element and atomic mass directly addresses a single atom or isotope.
Atomic mass and standard atomic weight can be so close, in elements with a single dominant isotope, that there is little difference when considering bulk calculations. Large variations can occur in elements with many common isotopes. Both have their place in science today. With advances in our knowledge, even these terms may become obsolete in the future.
We have written many articles about atomic mass for Universe Today. Here’s an article about the atomic nucleus, and here’s an article about the atomic models.
Just answering the question ‘what is atmospheric pressure?’ is not enough to give a full understanding of its importance. By definition atmospheric pressure is ‘force per unit area exerted against a surface by the weight of air above that surface’. Atmospheric pressure is closely related to the hydrostatic pressure caused by the weight of air above the measurement point. The term standard atmosphere is used to express the pressure in a system(hydraulics and pneumatics) and is equal to 101.325 kPa. Other equivalent units are 760 mmHg and 1013.25 millibars.
Mean sea level pressure (MSLP) is the pressure at sea level. This is the pressure normally given in weather reports. When home barometers are set to match local weather reports, they will measure pressure reduced to sea level, not your local atmospheric pressure. The reduction to sea level means that the normal range of fluctuations in pressure are the same for everyone.
Atmospheric pressure is important in altimeter settings for flight. A altimeter can be set for QNH or QFE. Both are a method of reducing atmospheric pressure to sea level, but they differ slightly. QNH will get the altimeter to show elevation at the airfield and altitude above the air field. QFE will set the altimeter to read zero for reference when at a particular airfield. QNH is transmitted around the world in millibars, except in the United States and Canada . These two countries use inches (or hundredths of an inch) of mercury.
Atmospheric pressure is often measured with a mercury barometer; however, since mercury is not a substance that humans commonly come in contact with, water often provides a more intuitive way to visualize the pressure of one atmosphere. One atmosphere is the amount of pressure that can lift water approximately 10.3m. A diver who is 10.3m underwater experiences a pressure of about 2 atmospheres (1of air plus 1of water). Low pressures like natural gas lines can be expressed in inches of water(w.c). A typical home gas appliance is rated for a maximum of 14 w.c.(about 0.034 atmosphere).
You can see that understanding ‘what is atmospheric pressure’ is just the tip of the iceberg. Once you have the definition in mind, it really comes together when you see the wide variety of applications.
We have written many articles about atmospheric pressure for Universe Today. Here’s an article about atmospheric pressure, and here’s an article about air pressure.
On Friday, I wrote about the population of the thick disk and how surveys are revealing that this portion of our galaxy is largely made of stars stolen from cannibalized dwarf galaxies. This fits in well with many other pieces of evidence to build up the general picture of galactic formation that suggests galaxies form through the combination of many small additions as opposed to a single, gigantic collapse. While many streams of what is, presumably, tidally shredded galaxies span the outskirts of the Milky Way, and other objects exist that are still fully formed galaxies, few objects have yet been identified as a satellite that is undergoing the process of tidal disruption.
A new study, to be published in the October issue of the Astrophysical Journal suggests that the Hercules satellite galaxy may be one of the first of this intermediary forms discovered.
In the past decade, numerous minor stellar systems have been discovered in the halo of our Milky Way galaxy. The properties of these systems have suggested to astronomers that they are faint galaxies in their own right. Although many have elongated and elliptical shapes (averaging an ellipticity of 0.47; 0.15 higher than that of brighter dwarf galaxies that orbit further out), simulations have suggested that even these stretched dwarfs are still able to remain largely cohesive. In general, the galaxy will remain intact until it is stretched to an ellipticity of 0.7. At this point, a minor galaxy will lose ~90% of its member stars and dissolve into a stellar stream.
In 2008, Munoz et al. reported the first Milky Way satellite that was clearly over this limit. The Ursa Major I satellite was shown to have an ellipticity of 0.8. Munoz suggested that this, as well as the Hercules and Ursa Major II dwarfs were undergoing tidal break up.
The new paper, by Nicolas Martin and Shoko Jin, further analyzes this proposition for the Hercules satellite by going further and examining the orbital characteristics to ensure that their passage would continue to distort the galaxy sufficiently. The system already contains an ellipticity of 0.68, which puts it just under the theoretical limit.
The team looked to see just how closely the satellite would pass to our own galactic center. The closer it passed, the more disruption it would feel. By projecting the orbit, they estimated the galaxy would come within ~6 kiloparsecs of the galactic center which is about 40% of the radius of the galaxy overall. While this may not seem especially close Martin and Jin report that they cannot conclude that it will be insufficient. They state that disruption would be dependent on “the properties of the stellar system at that time of its journey in the Milky Way potential and, as such, out of reach to the current observer.”
However, there were some telling signs that the dwarf may already be shedding stars. Along the major axis of the galaxy, deep imaging has revealed a smaller number of stars that does not appear to be bound to the galaxy itself. Photometry of these stars has shown that their distribution on a color-magnitude diagram is strikingly similar to that of the Hercules galaxy itself.
At this point, we cannot fully determine if the Hercules galaxy is doomed to become another stellar stream around the Milky Way, but if it is not truly in the process of breaking up, it seems to be on the very edge.
Remember how you could once pick up a book about the first three minutes after the Big Bang and be amazed by the level of detail that observation and theory could provide regarding those early moments of the universe. These days the focus is more on what happened between 1×10-36 and 1×10-32 of the first second as we try to marry theory with more detailed observations of the cosmic microwave background.
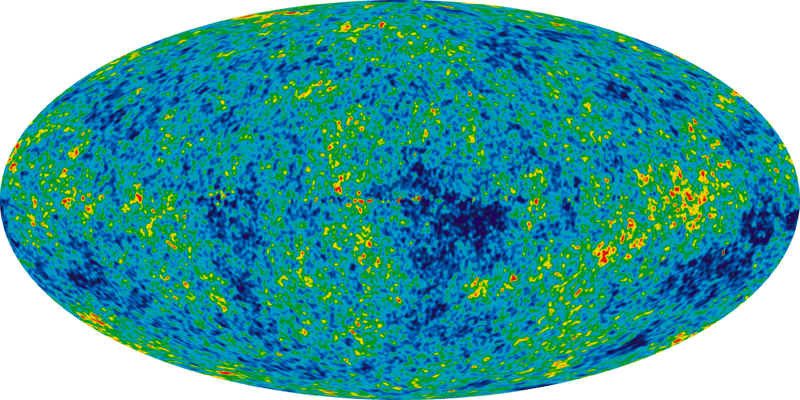
About 380,000 years after the Big Bang, the early universe became cool and diffuse enough for light to move unimpeded, which it proceeded to do – carrying with it information about the ‘surface of last scattering’. Before this time photons were being continually absorbed and re-emitted (i.e. scattered) by the hot dense plasma of the earlier universe – and never really got going anywhere as light rays.
But quite suddenly, the universe got a lot less crowded when it cooled enough for electrons to combine with nuclei to form the first atoms. So this first burst of light, as the universe became suddenly transparent to radiation, contained photons emitted in that fairly singular moment – since the circumstances to enable such a universal burst of energy only happened once.
With the expansion of the universe over a further 13.6 and a bit billion years, lots of these photons probably crashed into something long ago, but enough are still left over to fill the sky with a signature energy burst that might have once been powerful gamma rays but has now been stretched right out into microwave. Nonetheless, it still contains that same ‘surface of last scattering’ information.
Observations tell us that, at a certain level, the cosmic microwave background is remarkably isotropic. This led to the cosmic inflation theory, where we think there was a very early exponential expansion of the microscopic universe at around 1×10-36 of the first second – which explains why everything appears so evenly spread out.
Really, the most remarkable thing about the CMB is its large scale isotropy and finding some fine grain anisotropies is perhaps not that surprising. However, it is data and it gives theorists something from which to build mathematical models about the contents of the early universe.
Some theorists speak of CMB quadrupole moment anomalies. The quadrupole idea is essentially an expression of energy density distribution within a spherical volume – which might scatter light up-down or back-forward (or variations from those four ‘polar’ directions). A degree of variable deflection from the surface of last scattering then hints at anisotropies in the spherical volume that represents the early universe.
For example, say it was filled with mini black holes (MBHs)? Scardigli et al (see below) mathematically investigated three scenarios, where just prior to cosmic inflation at 1×10-36 seconds: 1) the tiny primeval universe was filled with a collection of MBHs; 2) the same MBHs immediately evaporated, creating multiple point sources of Hawking radiation; or 3) there were no MBHs, in accordance with conventional theory.
When they ran the math, scenario 1 best fits with WMAP observations of anomalous quadrupole anisotropies. So, hey – why not? A tiny proto-universe filled with mini black holes. It’s another option to test when some higher resolution CMB data comes in from Planck or other future missions to come. And in the meantime, it’s material for an astronomy writer desperate for a story.
The Royal Observatory Greenwich in the UK was the perfect setting to announce the winners of this year’s Astronomy Photographer of the Year competition, and I was privileged to be in attendance at the ceremony on Thursday evening. “We were really blown away by the quality of all of the almost 500 entries this year,” said Marek Kukula, the public astronomer at the Royal Observatory Greenwich. “So, congratulations to all who entered but in particular, congrats to the 22 winners tonight.”
The overall winner this year was Tom Lowe from the US, with this awe-striking image of our Milky Way. “I have to say, this pictures perfectly captures the spirit of the Astronomy Photographer of the Year competition,” said Kukula at the awards ceremony, “with not only the beautiful composition where the tree follows the arch of the Milky Way, but also the connection between things in space and things on Earth. The Bristlecone pines that you see in the foreground are some of the oldest living things on Earth, but yet they are dwarfed by the light shining behind them that has been traveling for almost 30,000 years. It is just a beautiful concept.”
See more of the winners below.
“After the success of last year’s competition, we challenged everybody again to take the best photographs of the solar system and beyond,” said Dallas Campbell, from “Bang Goes the Theory” on BBC,” who emceed the event along with Kukula. “We asked people to submit photographs in four categories: Earth and Space, Our Solar System, Deep Space, and Young Astronomy Photographer. We also added two new categories: People and Space and Best Newcomer.” Besides being the overall winner, Lowe’s image (top) was the winner of the Earth and Space category.
This stunning image of a total solar eclipse by Anthony Ayiomamitis from Greece won the “Our Solar System” category. “On eclipse day, the clouds were present everywhere and only one hour before first contact (partial phase) did the skies clear,” said Ayiomamitis “…and they cleared beautifully and with pristine transparency. There was a slight wind, especially at the top of the roof of the Institute of Nuclear Physics, but it was a very small price to pay.”
During an eclipse, the Sun’s corona is visible but this image captures even how the Sun’s magnetic fields warp and shape the super-heated gas of the corona into loops and streamers.
UK amateur astronomer Nick Smith was in attendance at the ceremony, and he was the runner-up in this category with this crisp image of Jupiter. He also received a “highly commended” prize for his image of the Sinus Iridium on the Moon.
I had the chance to talk with Smith, and he said he used a Celestron C14 14-inch Schmidt-Cassegrain telescope with a Tele Vue 1.8x Barlow lens and a Lumenera Infinity 2-1M CCD camera. “I’ve been doing astrophotography for about 5 years,” he said. “Last year I had same results, one runner up and one highly commended, so I’m still waiting for that elusive win!”
This absolutely stunning image taken by Rogelio Bernal Andreo of the USA shows wide angle view of the constellation Orion, with the three bright stars of Orion’s Belt on the left of this image. Here, however, a long exposure reveals an epic vista of dust and gas clouds which are too faint to be seen by the naked eye. This is an immense region of space hundreds of light years across. It contains several well-known astronomical sights, including the Horsehead Nebula (bottom center) and the Orion Nebula (top right).
The fourth category was for young astrophotographers, and this stunning image of an annular solar eclipse as taken by 14 year old Dhruv Arvind Paranjpye from India. This type of perfect circle occurs when the Moon is too far from the Earth to completely cover the Sun’s disc, and Paranjpye caught the moment perfectly as a bright ring appeared as the uncovered part of the Sun shone around the edges of the Moon, and through a thin veil of clouds.
This runner-up winner in the young astronomer category was taken by Laurent V. Joli-Coeur from Canada, who is 13 years old. He was in attendance at the ROG for the awards ceremony, and commented that he was in the family car with his mother when he saw a beautiful solar halo through the roof. “I used my mother’s camera, a simple DLSR camera,” Joli-Coeur told Universe Today. “I asked my mother to stop the car and I took the picture in manual mode, and was very pleased how it turned out.” The camera was a Canon Digital Rebel DSLR camera with a Canon EF-S 18-55 mm lens. I asked if this picture was the first attempt at any astrophotography for him, but he said, “Actually I do a lot of lunar photography, and wide field imaging of the Milky Way and solar halos.” So, look for more images from him in the future.
I had to include this “Highly Commended” image in the young astronomers group by Elias Jordan, aged 15, who I follow on Twitter. “Thanks everyone!” he said on Twitter, “It was hard to keep the news from you for three weeks!”
This is the winning image in a new category this year, “People and Space.” For a few days each year, the setting Sun shines directly through the archway of a large rock formation at Pfeiffer Beach in Big Sur, California, and Steven Christenson caught the event, plus the people watching. One of the judges, Sir Patrick Moore, said “It’s a rare event – it happens only once a year and the photographer has taken full advantage – the composition is fabulous.”
Another new category this year was “Best Newcomer,” won by Ken Mackintosh from the UK, with this image of the Whirlpool Galaxy.
“I’m lucky,” Mackintosh told Universe Today. “I just started doing astronomical photography a little over a year ago and I say I’m lucky because took this image about a year ago, and just barely scraped into the time constraint. Seeing the images in the other categories, I think next year I’ll really struggle to win anything because the winners this year are just jaw dropping.”
Mackintosh used Canon 450 DSLR, along with a Max Vision 127 telescope. He said he has been interested in astronomy since he was young, but wasn’t active in astronomy for many years. “I went into business and totally lost touch with astronomy until about a year ago when I was cruising around Flickr, and saw this contest, and my interest was totally reignited. Taking images like this, there’s a lot of work and frustration but when you get a good one, it’s totally worth it, and it keeps you going. I’m so glad they’ve started this competition,as it really provided a lot of motivation for me.”
Amazingly, he took this image from his back yard garden in Sussex, so he wants others interested in astrophotography to know that even in urban areas, astronomy and astrophography can be done. “Just in the past few years the equipment has become available at reasonable prices that is powerful enough to take images like this,” he said. “I can’t stress enough this is actually not too difficult to do, so anyone who has had interest in astronomy and photography, it is not that difficult. The difficulty comes in the kind of finesse and artistry to finish the images. It’s almost like the artistic side is as difficult as the technical. But as the technology improves, that side of it will become much easier.”
The Astronomy Photographer of the Year competition started in 2009 for the International Year of Astronomy. It was so popular that the organizers and sponsors decided to do it again this year. You can find info on the websites below on how to enter in 2011.
To see all the winning astronomy pictures in the six categories, see the Royal Observatory Greenwich website, or you can see all the images submitted on the Flickr Astronomy Photographer of the Year page. And if you live in the UK or visit there soon, you can see an exhibit of the Astronomy Photographer of the Year winners at the ROG from now until February 27, 2011.
The ROG is a must-see destination for any astronomy enthusiast, and is a wonderful location that is full of history, beauty and hands-on learning. There you can straddle the Prime Meridian, see early telescopes and time pieces and look across the same beautiful vistas that early British astronomers saw from the hilltop home of the observatory.