[/caption]
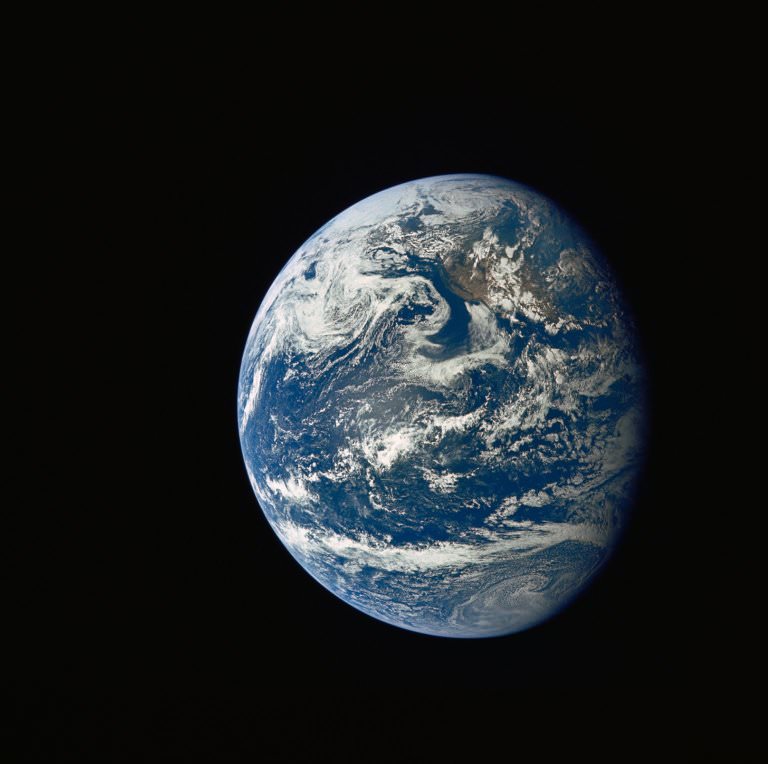
Oftentimes when we think of the Earth, we tend to think of stable landmasses that are surrounded by vast oceans. It’s easy for us to forget that the Earth is still very much a work in a progress, that its foundations are mobile slabs of rock, known as plates, which are constantly on the move and shuffling back and forth. In our next of the woods, aka. North American, we inhabit what is appropriately named the North American Plate, the tectonic boundary that covers most of North America, Greenland, Cuba, Bahamas, and parts of Siberia and Iceland. It extends eastward to the Mid-Atlantic Ridge and westward to the Chersky Range in eastern Siberia. It is composed of two types of lithosphere: the upper crust (where the continental land masses reside) and the thinner oceanic crust.
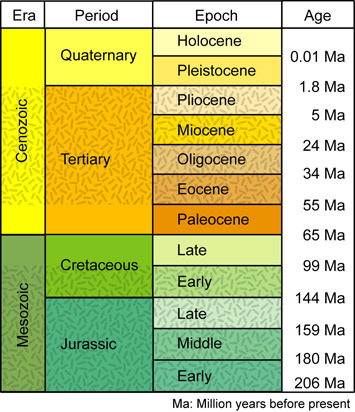
As one of the Earth’s original continents, the North American Plate started forming some three billion years ago when the planet was much hotter and mantle convection much more vigorous. Roughly two billions years ago, the Earth cooled and these old floating pieces of the lithosphere, called cratons, stopped growing. Since that time, the plates have been moving back and forth across the globe, their cratons colliding to form the continents that we know and recognize today. Beginning in the Cambrian period, over five hundred million years ago, the cratons of Laurentia and Siberia broke off from the main landmass of Pangaea, which thereafter would be known as Gondwana. By the late Mezosoic era (circa two hundred million years ago) the Laurentian and Eurasian cratons combined to form the supercontinent of Laurasia. Since that time, the separation of the North American and Eurasian plates has led to the separation of the North America from Asia. As the North American plate drifted west, the landmasses of Iceland and Greenland broke off in the east while in the west, it collided with the Eurasian plate again, adding the landmass of Siberia to East Asia.
In terms of what makes the plates move across the Earth, a number of theories coexist. One theory is what is known as the “conveyor belt” principle, where the Earth’s lithosphere has a higher strength and lower density than the underlying asthenosphere and lateral density variations in the mantle result in the slow drifting motion of the plates, resulting in collisions and subduction zones. One of the main points of the theory is that the amount of surface of the plates that disappear through subduction along the boundaries where they collide is more or less equal to the new crust that is formed along the margins where they are drifting apart. In this way, the total surface of the Globe remains the same. A different explanation lies in different forces generated by the rotation of the Globe and tidal forces of the Sun and the Moon. A final theory which predates the Plate Tectonics “paradigm”, has it that a gradual shrinking (contraction) or gradual expansion of the Globe is responsible.
We have written many articles about the North American Plate for Universe Today. Here’s an article about the continental plate, and here’s an article about the plate tectonics theory.
If you’d like more info on Earth, check out NASA’s Solar System Exploration Guide on Earth. And here’s a link to NASA’s Earth Observatory.
We’ve also recorded related episodes of Astronomy Cast about Plate Tectonics. Listen here, Episode 142: Plate Tectonics.
Sources:
http://en.wikipedia.org/wiki/North_American_Plate
http://en.wikipedia.org/wiki/Plate_tectonics
http://www.platetectonics.com/book/page_5.asp
http://www.uwgb.edu/dutchs/GeolColBk/NAmerPlate.HTM
http://en.wikipedia.org/wiki/Mantle_convection
http://en.wikipedia.org/wiki/Craton
http://en.wikipedia.org/wiki/Laurasia


. Credit: NASA, ESA, R.M. Crockett (University of Oxford, U.K.), S. Kaviraj (Imperial College London and University of Oxford, U.K.), J. Silk (University of Oxford), M. Mutchler (Space Telescope Science Institute, Baltimore), R. O'Connell (University of Virginia, Charlottesville), and the WFC3 Scientific Oversight Committee")