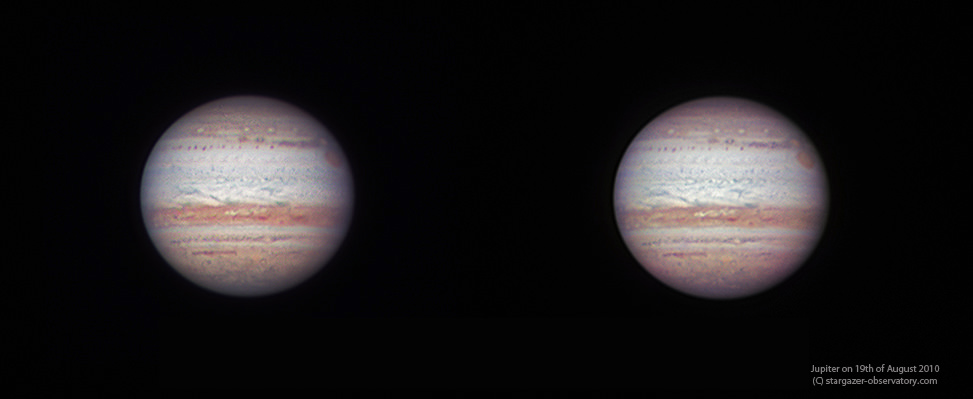
Water Was Widespread Across Early Mars, But No Oceans

Locations of nine exposures of hydrated silicate in northern plain craters, shown on a Mars Orbiter Laser Altimeter shaded relief map. Black squares indicate sites investigated with CRISM that did not yield detections. Image courtesy of Science/AAAS.

By looking at the mineralogy deep inside craters on Mars’ northern plains and comparing it to the makeup of regions in the southern hemisphere, scientists have found that widespread liquid water likely altered the majority of Red Planet’s crust about 4 billion years ago. However, the new findings do not support other recent studies that suggest a giant ocean covered Mars’ northern highlands.

Using the Mars Express OMEGA instrument and the Mars Reconnaissance Orbiter’s CRISM instrument, John Carter from Bibring at Université Paris in Orsay, France along with a group of scientists from France and the US, investigated large craters and found minerals which could have only formed in the presence of water. “We’ve detected hydrated minerals in about 10 of these craters,” Carter told Universe Today, “and we conclude that the ancient crust was altered in a similar way both in the south and in the north, in a very early environment which was much warmer and wetter than today’s.”

Carter added that in terms of Mars’ water history, this means liquid water existed near and on the surface of early Mars on a planetary scale, and is not restricted to select areas of the southern highlands.

Mars has dichotomy between north and south, (read our earlier article “The Two Faces of Mars Explained) so while the south is ancient, heavily cratered and high up, the north is smooth, with low-lying plains. It also is much younger and less cratered than the south. This is due to a volcanic mantling processes which filled up part of the lowlands and thus erased any former structures.

HRSC observation of Kunowsky crater, centered at 350.3°E, 56.8°N. (B) CTX close-up (image B01_009932_2370). CRISM mineral maps from observations FRT0000BAD4 and FRT0000C63C are overlaid in red (smectites or chlorite-prehnite) and green (olivine). The white dashed lines indicate the boundaries of the two adjacent observations. (C) HiRISE close-up (image PSP006860_2370) overlain by CRISM mineral maps. No HiRISE data are available over the chlorite-prehnite unit. Image courtesy of Science/AAAS

Carter and his team began their work based on studies of hundreds of sites in the southern hemisphere of Mars which were found to have hydrated minerals which formed on or near the surface some 4 billion ago in a wet and warm environment. While today Mars does not and cannot sustain liquid water on its surface, the scientists knew that a rather weak hydrological system had existed in the southern hemisphere, based on previous geological and morphological evidence.

If minerals in Mars’ northern hemisphere had formed in the presence of water, those minerals would have been buried by the widespread and intense lava flow which happened about 3 billion years ago, resurfacing that region of the planet. But looking into impact craters provides a window into Mars’ past by penetrating down through the lava flow, as well as showering chunks of the underlying crust across the nearby surface.

Carter said the data from OMEGA and CRISM show the mineral assemblages within and around these craters in the north as are very similar to what is seen in the southern ancient highlands, which includes phyllosilicates or other hydrated silicates.

“Our work broadens our view of liquid water on ancient Mars,” Carter said in an email, “spreading it to most of the planet, and may also provide a constraint on the timing of the northern hemisphere alteration with respect to its formation.”

Another conclusion, Carter said, is that these detections may be a constraint on when Mars could have possibly been conducive to the formation of life. “The main scenario which explains the dichotomy is that of an oblique impact between Mars and a fair sized celestial body, thus obliterating and re-melting a great deal of the northern hemisphere of Mars. Such an impact would surely have destroyed any pre-existing hydrated minerals at the depths at which we’re seeing them or we think they come from. Thus the water stability era likely took place after this giant impact, and did not last long (several hundred million years at most). Thus our work may provide a lower limit on this era.”

CTX–HRSC mosaic of Stokes crater, centered at 171.35°E, 55.56°N. (B) CTX closeup (image P20_008686_2356). CRISM mineral maps from observation FRT0000ADA4 are overlain in color. The white dashed lines indicate the boundaries of the CRISM observation. (C) HiRISE close-up (image PSP_009332_2360) of the Al-phyllosilicate “montmorillonite”-bearing unit. The sources of the material are the bright outcrops near the scarp summit (right), whereas the light-toned unit (left) is material transported downslope. (D) HiRISE close-up (image PSP_009332_2360) showing outcrops of olivine, Fe/Mg-, and Al-phyllosilicates in close spatial association. Image courtesy of Science/AAAS

Concerning the giant ocean scenario for the northern highlands, on which a paper was published just last week, Carter said his team’s findings show evidence against those circumstances. “Previous work by a number of teams have actually shown the unlikelihood of a giant northern ocean on Mars younger than 3 billion years as hypothesized by several researchers,” he said. “There is no morphological nor mineralogical evidence for such an ocean. In our 10 or so craters of the northern plains of Mars where we found hydrated minerals, we also found mafic minerals such as olivine. This olivine is almost ubiquitous in northern plain craters, and the vast majority of it is unaltered. Olivine is very readily altered by liquid water hence a giant ocean which would have submerged all these craters should have altered all the olivine, and this is seldom the case.”

Carter said that studying craters from orbit provides a bit of a challenge. “It is hard, for example, to distinguish rocks from orbit which may have been excavated by the impact or actually formed after the impact when the heat released and the existing water and/or ice interacted with the rock to form new minerals, creating hydrothermal environments. In our paper we put forward several reasons why an excavation scenario is favored to a post-impact hydrothermal scenario.”

But craters on Mars provide a better study of the past than craters on Earth, since craters may exist on Mars for billions of year without much degradation, while on Earth water, tectonics and plant growth all conspire to conceal and change craters. Carter said the excavated material on Mars will not be altered by the current ultra-dry, cool environment on the Red Planet.

This research new appears in the June 25, 2010 issue of Science.

Sources: AAAS/Science, email exchange with John Carter

Radio Observations Provide New Explanation for Hanny’s Voorwerp

The green "blob" is Hanny's Voorwerp. Credit: Dan Herbert, Peter Smith, Matt Jarvis, Galaxy Zoo Team, Isaac Newton Telescope

[/caption]

Is Hanny’s Voorwerp the result of a “light echo” of a violent event that happened long ago or perhaps is this mystifying blob of glowing gas being fueled by an ongoing, and current phenomenon? A just-released paper about the Voorwerp offers a new explanation for this perplexing, seemingly one-of-a-kind object in the constellation of Leo Minor. If you haven’t heard the remarkable story, the object was discovered in 2007 by Dutch school teacher Hanny Van Arkel while she was classifying galaxies for the Galaxy Zoo online citizen science project. Until now, the working hypothesis for the explanation of this unusual object was that we might be seeing the “light echo” of a quasar outburst event that occurred millions of years ago. But new radio observations reveal that instead, a black hole in that same nearby galaxy might be producing a radio jet, shooting a thin beam directly at this cloud of gas, causing it to light up.

Hanny’s Voorwerp (Dutch for object) consists of dust and gas – but no stars – so astronomers know it is not a galaxy, even though it is galaxy-sized. Previously, astronomers studying the object thought the gas and dust were illuminated by a quasar outburst within the nearby galaxy IC 2497. While the outburst would have faded within the last 100,000 years, the light only reached the dust and gas in time for our telescopes to see the effect. But this explanation was slightly unsatisfactory in that such an event, where an entire galaxy would flare up suddenly and briefly, is unexplained.

The naturally weighted 18 cm MERLIN radio map of IC 2497 (black contours), showing both C1 & C2, embedded within a region of smooth extended emission, overlaid over the same map with the point sources subtracted. Credit: Rampadarath, et al.

But radio observations with the European Very Long Baseline Interferometry (VLBI) Network at 18 cm, and the Multi-Element Radio Linked Interferometer Network (MERLIN) at 18 cm and 6 cm show evidence of black hole, or active galactic nuclei (AGN) activity and a nuclear starburst in the central regions of IC 2497.

This event is hard to see from our vantage point on Earth because another cloud of dust and gas sits between us on Earth and IC 2497, preventing us from directly seeing the black hole.

“The new data shows that the nucleus continues to produce a radio jet, in about the direction of Hanny’s Voorwerp,” said Bill Keel from the University of Alabama, one of the astronomers who has been studying the object intently ever since its discovery, and was part of the new observations. “The core is still too weak in the radio to be able to conclude that it puts off enough UV and X-rays to light up the gas, however. There may well be interaction between outflowing material connected with the jet and the gas outside the galaxy, helping to shape the Voorwerp, but the spectra in the discovery paper already made it clear that the gas is ionized not by shocks from such an interaction, but by radiation. ”

Keel said, though, there is still remaining uncertainty — and different astronomers have varying estimates of this likelihood – of whether the radiation from the quasar core remains strong or whether it shoots in fits and starts.

“Some active galaxies put out a lot of energy in jets and outflows compared to radiation, and we are considering the possibility that this one has switched to such a “radio mode” in the recent past,” he said. “If so, the Voorwerp would be an ionization echo, or light echo, since the re-radiation from ionized gas is not instantaneous, as scattering is.”

The Voorwerp has captured enough attention and curiosity that astronomers have trained numerous telescopes on the object in an effort to sort out the mystery. But Keel said this approach is essential in eventually figuring this out.

“Each wavelength range gives us a different, and usually complementary, piece of the story,” he said. “The earlier radio data tell us something about where all that gas came from, and we got another connection from recent data putting an apparent companion spiral galaxy at the same distance as IC 2497. Even the early X-ray data showed us that there was an interesting puzzle as to why we didn’t see the core AGN. The GALEX UV spectrum is informing our interpretation of the Hubble UV image.”

Yes, Hubble recently looked at the Voorwerp in a couple of different wavelengths, (read our article about the Hubble observations here) and while Keel couldn’t comment directly about data from the iconic telescope, (everything is still being analyzed) he did say it holds some interesting surprises.

“One of the first things we started checking with Hubble data was whether we have a clear view in at least the infrared to the nucleus, starting from the location of the radio source,” he said. “Also, these results give us particular reason to look at the structural details of the gas in Hanny’s Voorwerp, for signs that it may be affected by an outflow from the nucleus. I can mention that there are some interesting surprises from the HST data, which is what we always hope for!”

Keel said he also has been observing at Kitt Peak, looking at other candidate “voorwerpjes” – similar “ionized clouds on a somewhat smaller scale around AGN, where the same lifetime-versus-obscuration issues apply but we can usually see the AGN responsible,” he said.

And look for some upcoming public outreach projects on the Voorwerp based on the Hubble data, as well, including one in Bloomington, Minnesota on July 1-4 at the CONvergence, where writers and scienctists will be writing a graphic novel based on the discovery of Hanny’s Voorwerp. Check out this website for more information.

Read the team’s paper: Hanny’s Voorwerp: Evidence Of AGN Activity And A Nuclear Starburst In The Central Regions Of IC 2497.

Who Will Win the Google Lunar X PRIZE?

Twenty-one teams are hard at work trying to win the Google Lunar X PRIZE, a $30 million international competition to safely land a robot on the surface of the Moon. The GLXP folks released a video this week as an update on how the teams are progressing. The challenge is not only to land a robot on the Moon, but it also must complete a few tasks – and none of this is easy: travel at least 500 meters over the lunar surface, and send images and data back to Earth.
Continue reading “Who Will Win the Google Lunar X PRIZE?”

Circumference and Diameter of the Earth

This view of Earth comes from NASA's Moderate Resolution Imaging Spectroradiometer aboard the Terra satellite.

[/caption]
The Earth is the largest of the terrestrial planets in the Solar System, and the 3rd planet from the Sun. Are you looking for the circumference and diameter of the Earth?

The equatorial circumference of the Earth is 40,075 km. This is the distance around the equator of the Earth. If you measure the circumference of the Earth, while passing through the poles, the distance is only 40,007 km. This is because the Earth isn’t a perfect sphere. It’s rotating rapidly, which causes the equator to bulge out.

The equatorial diameter of the Earth is 12,756 km. This is the diameter of the Earth measured from one side of the Earth, passing through the center. If you go from pole to pole through the center, the distance is only 12,713 km.

We have written several articles about Earth for Universe Today. Here’s an article about the Earth’s magnetic field, and here’s an article about the surface area of Earth.

If you’d like more info on Earth, check out NASA’s Solar System Exploration Guide on Earth. And here’s a link to NASA’s Earth Observatory.

We’ve also recorded an episode of Astronomy Cast all about planet Earth. Listen here, Episode 51: Earth.

Earth Moved Substantially in April 2010 Earthquake

Overview of the UAVSAR interferogram of the magnitude 7.2 Baja California earthquake of April 4, 2010, overlaid atop a Google Earth image of the region. Major fault systems are shown by red lines, while recent aftershocks are denoted by yellow, orange and red dots. Image credit: NASA/JPL/USGS/Google ›

[/caption]


From a JPL press release.

NASA has released the first-ever airborne radar images of the deformation in Earth’s surface caused by a major earth quake — the magnitude 7.2 temblor that rocked Mexico’s state of Baja California and parts of the American Southwest on April 4, 2010. The data reveal that in the area studied, the quake moved the Calexico, Calif., region in a downward and southerly direction up to 80 centimeters (31 inches).

A science team at NASA’s Jet Propulsion Laboratory, Pasadena, Calif., used the JPL-developed Uninhabited Aerial Vehicle Synthetic Aperture Radar (UAVSAR) to measure surface deformation from the quake. The radar flies at an altitude of 12.5 kilometers (41,000 feet) on a Gulfstream-III aircraft from NASA’s Dryden Flight Research Center, Edwards, Calif.

The team used a technique that detects minute changes in the distance between the aircraft and the ground over repeated, GPS-guided flights. The team combined data from flights on Oct. 21, 2009, and April 13, 2010. The resulting maps are called interferograms.

The April 4, 2010, El Mayor-Cucapah earthquake was centered 52 kilometers (32 miles) south-southeast of Calexico, Calif., in northern Baja California. It occurred along a geologically complex segment of the boundary between the North American and Pacific tectonic plates. The quake, the region’s largest in nearly 120 years, was also felt in southern California and parts of Nevada and Arizona. It killed two, injured hundreds and caused substantial damage. There have been thousands of aftershocks, extending from near the northern tip of the Gulf of California to a few miles northwest of the U.S. border. The area northwest of the main rupture, along the trend of California’s Elsinore fault, has been especially active, and was the site of a large, magnitude 5.7 aftershock on June 14.

UAVSAR has mapped California’s San Andreas and other faults along the plate boundary from north of San Francisco to the Mexican border every six months since spring 2009, looking for ground motion and increased strain along faults. “The goal of the ongoing study is to understand the relative hazard of the San Andreas and faults to its west like the Elsinore and San Jacinto faults, and capture ground displacements from larger quakes,” said JPL geophysicist Andrea Donnellan, principal investigator of the UAVSAR project to map and assess seismic hazard in Southern California.

Each UAVSAR flight serves as a baseline for subsequent quake activity. The team estimates displacement for each region, with the goal of determining how strain is partitioned between faults. When quakes do occur during the project, the team will observe their associated ground motions and assess how they may redistribute strain to other nearby faults, potentially priming them to break. Data from the Baja quake are being integrated into JPL’s QuakeSim advanced computer models to better understand the fault systems that ruptured and potential impacts to nearby faults, such as the San Andreas, Elsinore and San Jacinto faults.

One figure (Figure 1) shows a UAVSAR interferogram swath measuring 110 by 20 kilometers (69 by 12.5 miles) overlaid atop a Google Earth image. Each colored contour, or fringe, of the interferogram represents 11.9 centimeters (4.7 inches) of surface displacement. Major fault lines are marked in red, and recent aftershocks are denoted by yellow, orange and red dots.

The quake’s maximum ground displacements of up to 3 meters (10 feet) actually occurred well south of where the UAVSAR measurements stop at the Mexican border. However, these displacements were measured by JPL geophysicist Eric Fielding using synthetic aperture radar interferometry from European and Japanese satellites and other satellite imagery, and by mapping teams on the ground.

Scientists are still working to determine the exact northwest extent of the main fault rupture, but it is clear it came within 10 kilometers (6 miles) of the UAVSAR swath, close to the point where the interferogram fringes converge. “Continued measurements of the region should tell us whether the main fault rupture has moved north over time,” Donnellan said.

An enlargement of the interferogram is shown in another figure (Figure 2), focusing on the area where the largest deformation was measured. The enlargement, which covers an area measuring about 20 by 20 kilometers (12.5 by 12.5 miles), reveals many small “cuts,” or discontinuities, in the fringes. These are caused by ground motions ranging from a centimeter to tens of centimeters (a few inches) on small faults. “Geologists are finding the exquisite details of the many small fault ruptures extremely interesting and valuable for understanding the faults that ruptured in the April 4th quake,” said Fielding. Another figure, (Figure 3) shows a close-up of the region where the magnitude 5.7 aftershock struck.

“UAVSAR’s unprecedented resolution is allowing scientists to see fine details of the Baja earthquake’s fault system activated by the main quake and its aftershocks,” said UAVSAR Principal Investigator Scott Hensley of JPL. “Such details aren’t visible with other sensors.”

UAVSAR is part of NASA’s ongoing effort to apply space-based technologies, ground-based techniques and complex computer models to advance our understanding of quakes and quake processes. The radar flew over Hispaniola earlier this year to study geologic processes following January’s devastating Haiti quake. The data are giving scientists a baseline set of imagery in the event of future quakes. These images can then be combined with post-quake imagery to measure ground deformation, determine how slip on faults is distributed, and learn more about fault zone properties.

UAVSAR is also serving as a flying test bed to evaluate the tools and technologies for future space-based radars, such as those planned for a NASA mission currently in formulation called the Deformation, Ecosystem Structure and Dynamics of Ice, or DESDynI. That mission will study hazards such as earth quakes, volcanoes and landslides, as well as global environmental change.

See all the maps at this webpage.

Cosmologists Provide Closest Measure of Elusive Neutrino

Slices through the SDSS 3-dimensional map of the distribution of galaxies. Earth is at the center, and each point represents a galaxy, typically containing about 100 billion stars. Galaxies are colored according to the ages of their stars, with the redder, more strongly clustered points showing galaxies that are made of older stars. The outer circle is at a distance of two billion light years. The region between the wedges was not mapped by the SDSS because dust in our own Galaxy obscures the view of the distant universe in these directions. Both slices contain all galaxies within -1.25 and 1.25 degrees declination. Credit: M. Blanton and the Sloan Digital Sky Survey.

[/caption]

Cosmologists – and not particle physicists — could be the ones who finally measure the mass of the elusive neutrino particle. A group of cosmologists have made their most accurate measurement yet of the mass of these mysterious so-called “ghost particles.” They didn’t use a giant particle detector but used data from the largest survey ever of galaxies, the Sloan Digital Sky Survey. While previous experiments had shown that neutrinos have a mass, it is thought to be so small that it was very hard to measure. But looking at the Sloan data on galaxies, PhD student Shawn Thomas and his advisers at University College London put the mass of a neutrino at no greater than 0.28 electron volts, which is less than a billionth of the mass of a single hydrogen atom. This is one of the most accurate measurements of the mass of a neutrino to date.

Their work is based on the principle that the huge abundance of neutrinos (there are trillions passing through you right now) has a large cumulative effect on the matter of the cosmos, which naturally forms into “clumps” of groups and clusters of galaxies. As neutrinos are extremely light they move across the universe at great speeds which has the effect of smoothing this natural “clumpiness” of matter. By analysing the distribution of galaxies across the universe (i.e. the extent of this “smoothing-out” of galaxies) scientists are able to work out the upper limits of neutrino mass.

A neutrino is capable of passing through a light year –about six trillion miles — of lead without hitting a single atom.

Central to this new calculation is the existence of the largest ever 3D map of galaxies, called Mega Z, which covers over 700,000 galaxies recorded by the Sloan Digital Sky Survey and allows measurements over vast stretches of the known universe.

“Of all the hypothetical candidates for the mysterious Dark Matter, so far neutrinos provide the only example of dark matter that actually exists in nature,” said Ofer Lahav, Head of UCL’s Astrophysics Group. “It is remarkable that the distribution of galaxies on huge scales can tell us about the mass of the tiny neutrinos.”

The Cosmologists at UCL were able to estimate distances to galaxies using a new method that measures the colour of each of the galaxies. By combining this enormous galaxy map with information from the temperature fluctuations in the after-glow of the Big Bang, called the Cosmic Microwave Background radiation, they were able to put one of the smallest upper limits on the size of the neutrino particle to date.

“Although neutrinos make up less than 1% of all matter they form an important part of the cosmological model,” said Dr. Shaun Thomas. “It’s fascinating that the most elusive and tiny particles can have such an effect on the Universe.”

“This is one of the most effective techniques available for measuring the neutrino masses,” said Dr. Filipe Abadlla. “This puts great hopes to finally obtain a measurement of the mass of the neutrino in years to come.”

The authors are confident that a larger survey of the Universe, such as the one they are working on called the international Dark Energy Survey, will yield an even more accurate weight for the neutrino, potentially at an upper limit of just 0.1 electron volts.
The results are published in the journal Physical Review Letters.

Source: University College London

First Planet From the Sun

Planet Mercury
Planet Mercury

[/caption]
The first planet from the Sun is Mercury, orbiting the Sun at an average distance of 57.91 million km. It’s also the smallest planet in the Solar System, measuring just 4,879 kilometers across. Mercury is named after the Roman god of commerce; he was the same entity as the Greek god Hermes – the messenger of the gods.

Mercury is a desolate, sun-baked world pockmarked by impact craters. It lacks any atmosphere, so the intense heat from the Sun escapes back into space on the planet’s night side. At noon on Mercury’s equator, temperatures can rise to 700 kelvin (426 °C), but on the night side of Mercury, it dips down to 100 kelvin (-173 °C). But Mercury isn’t the hottest planet in the Solar System; that’s actually Venus – its heat-trapping atmosphere boosts its temperature to 735 kelvin (461 °C).

Early astronomers didn’t even realize that Mercury was a single planet. They thought that it was actually two separate planets; one for when Mercury was seen after sunset, and another object for when it was seen in the morning before sunrise. Even the first rudimentary telescope couldn’t resolve the surface of Mercury, and it wasn’t until the first mission to pass Mercury in 1974, that astronomers could really see what Mercury looked like.

Mercury takes 88 days to complete one orbit around the Sun. Compare this to Venus, which takes 224.7 days, and Earth which takes 365.25 days. Since Mercury is the first planet in the Solar System, it has the fastest orbit, and then each planet has a successively longer orbit. Mercury’s day is almost as long as its year; 58.6 days.

It’s the smallest planet in the Solar System, but it’s the second densest. It has a density of 5.427 g/cm3. This is just after Earth, with a density of 5.515 g/cm3. Astronomers think that Mercury has a large metallic core, surrounded by a rocky mantle and a thin crust of rock. It doesn’t seem to have any active volcanism, but there might still be some venting of gasses which cont into a thin atmosphere around Mercury.

Mercury has no rings or moons.

We have written many articles about the first planet from the Sun. Here’s an article all about Mercury, and here’s some additional information about Mercury.

If you’d like more information on Mercury, check out NASA’s Solar System Exploration Guide, and here’s a link to NASA’s MESSENGER Misson Page.

We’ve also recorded an entire episode of Astronomy Cast all about Mercury. Listen here, Episode 49: Mercury.

Astronomers Watch Superstorm Raging on Distant Exoplanet

Artists impression of the 'hot Jupiter' HD209458b, which has incredible storms. Credit: ESO.

[/caption]

Likely, future interstellar flights will not include the exoplanet HD209458b as a featured get-away destination. Not only is this extrasolar planet a scorchingly hot world where the poisonous carbon monoxide atmosphere is being evaporated, but new observations show this gas giant also has superstorms with winds of 5,000 to 10,000 km per hour. “It’s definitely not a place for the faint-hearted,” said Ignas Snellen, from Leiden University in the Netherlands who led a team of astronomers using the Very Large Telescope (VLT) to observe HD209458b, one of the most-studied planets orbiting around other stars. But Snellen told Universe Today that being able to detect this superstorm is extremely exciting and bodes well for finding possible life on other, more Earth-like planets.

“Astronomers have tried to do this for more than a decade,” Snellen said in an email, “basically since the first exoplanets were discovered. We now learn a lot about this gas-giant’s atmosphere, like what kind of gases are there, how hot is it, about its circulation. But we really would like to do this for Earth-like planets. This will be interesting, because using the same techniques we could find out whether there could be life on these planets.”

HD209458b (unofficially called Osiris) is an exoplanet with about 60% the mass of Jupiter orbiting a sun-like star located 150 light-years from Earth towards the constellation of Pegasus.

It orbits at a distance of only one twentieth of the Earth’s orbit around the Sun, and is heated intensely by its parent star, a yellow dwarf with 1.1 solar masses, and a surface temperature of 6000 K. The planet has a surface temperature of about 1000 degrees Celsius on the hot side. But as the planet always has the same side to its star, one side is very hot, while the other is much cooler.

Just as big temperature differences on Earth cause high winds, the same processes cause high winds on HD209458b. But even Earth’s hurricanes are nothing compared to this exoplanet’s superstorms.

Using the powerful CRIRES spectrograph on the VLT the team from Leiden University’s Institute for Space Research (SRON), and MIT in the United States were able to detect and analyze faint fingerprints which showed the high winds. They observed the planet for about five hours, as it passed in front of its star. “CRIRES is the only instrument in the world that can deliver spectra that are sharp enough to determine the position of the carbon monoxide lines at a precision of 1 part in 100,000,” said team member Remco de Kok. “This high precision allows us to measure the velocity of the carbon monoxide gas for the first time using the Doppler effect.”

The astronomers were also able to directly measured the velocity of the exoplanet as it orbits its home star, a first for exoplanet study. “The planet moves with 140 km/sec, and the star moves at 84 meters/second,” said Snellen, “so more than a thousand times slower. Both star and planet orbit the common center of gravity of the system. Having both velocities, using Newton’s laws of gravity we can simply solve for the masses of the two objects.”

The reason this planet is so well studied is that it is the brightest known transiting system in the sky. “The planet moves, as seen from the Earth, in front of its star once per three-and-a-half days,” said Snellen. “This takes about 3 hours. During these three hours, a tiny little bit of starlight filters through the atmosphere of the planet, leaving an imprint of the molecular absorption lines which we have now measured.”

Also for the first time, the astronomers measured how much carbon is present in the atmosphere of this planet. “It seems that H209458b is actually as carbon-rich as Jupiter and Saturn. This could indicate that it was formed in the same way,” said Snellen.

Snellen hopes that by refining these techniques, astronomers may one day be able to study the atmospheres of Earth-like planets, and determine whether life also exists elsewhere in the Universe.

“However, this will be about one hundred times more difficult than what we do now,” he said. “In particular oxygen and ozone are very interesting. On Earth we only have oxygen in the atmosphere because it is constantly produced by living organism, with photosynthesis of plants. If there would be some kind of global disaster and all the life on Earth would go extinct, including plant life and that in the oceans, all the oxygen in the earth atmosphere would quickly disappear. Hence finding oxygen in the atmosphere of an earth-like planet would be extremely exciting! Something to dream about for the future!”

Read the team’s paper.

Sources: ESO, email interview with Ignas Snellen

Sixth Annual Southern California Astronomy Exposition


Don’t miss the Southern California Astronomy Expo (SCAE) on Saturday, July 10th and Saturday, July 17th, 2010 at Oceanside Photo & Telescope! The store will be open from 10:00 AM until 5:00 PM on Saturday, July 10th and from 10:00 AM until 7:00 PM on July 17th. Check out the line-up of events they have planned for SCAE…you gotta come! And if you don’t live in the SoCal area? Don’t be discouraged. This isn’t a shameless attempt at advertising – it’s your chance to win some very expensive astronomy equipment. OPT is offering a free, on-line giveaway to Universe Today readers with total prizes worth more than $8000. All you have to do is register to get your chance to win!

Saturday, July 10th – SCAE Swap Meet & Star Party on Palomar Mountain!

Swap Meet at OPT: Bring your gently used (or maybe not so gently used) astronomy gear and join OPT for a day of fun and selling in the parking lot! OPT will provide the tables and you provide everything else. The day will start at 10 AM and end at 4:30 PM. Don’t forget to bring an umbrella or other portable shade with you if you don’t like the sun!

Star Party on Palomar Mountain: The party is far from over after the swap meet ends at OPT, and this year, we are doing something completely different! Since the 10th of July happens to be very close to New Moon, we decided to have a star party at a dark sky site, and what better location than in the shadow of the 200″ Hale Telescope on Palomar? The only thing stopping us was parking considerations, but we solved that one by chartering several buses for the evening to take attendees up to the mountain and back. The star party will start at dusk and go until 11 PM. Staff members from OPT and volunteers will have a variety of telescopes set up to gaze at old favorites like Saturn, Venus, & Mars as well as a myriad of galaxies, nebulae, star clusters, and more! Representatives from companies like Apogee, Meade, Celestron, Chronos, and Planewave will also be on hand to demonstrate their telescopes, mounts, and imaging cameras… just wait until you see a galaxy through one of the big scopes out there, or the beautiful images that can be produced with an Apogee CCD camera!

Important Note: The site for this star party does not have parking facilities and you will not be allowed to park along the road. If you want to attend, you MUST ride on one of the buses we will provide. Buses will pick up riders at both a coastal and inland location. A limited number of Star Party Bus Tickets are now available. Ticket prices are $20 for adults and $10 for children under 12. Children under 16 must be accompanied by an adult. You will be mailed a boarding pass for each person in your party, and this boarding pass must be shown each time you board the bus as well as when you enter the star party area. You will also be mailed more information about the bus pick up locations. Since an outdoor star party is definitely dependent on weather, you will receive a refund for the ticket price if the event is officially canceled.

Saturday, July 17th – Telescope & Astronomy Demonstration

On Saturday, July 17th, almost forty telescope, CCD, and other astronomy product manufacturers and organizations will be on hand at OPT to show off their latest and greatest gear, and you’re invited! The SCAE 2010 Telescope & Astronomy Demonstration kicks off at 10 AM and runs through 7 PM. This year there will be more going on than ever to keep you busy and entertained. Special speakers will give presentations in the Gallery throughout the day, your favorite manufacturers will introduce new and exciting products on the Soapbox Stage all day long.

The SCAE Online Giveaway, where everyone, even those folks who can’t attend SCAE, can sign up for a chance to win one of four prizes worth a combined total of over $8,000! Sign up begins Monday, June 7th and runs through midnight, July 16th, 2010. Just click HERE to register!!

The Southern California Astronomy Exposition will be located at OPT’s beautiful showroom location. The address is 918 Mission Avenue in Oceanside, California. They are located 250 yards west of Interstate 5 on the corner of Mission Avenue and Horne Street. See you there!

One Year of the Lunar Reconnaissance Orbiter: Top Ten Finds

Orbiter
Lunar Reconnaissance Orbiter. Credit: NASA

[/caption]

One year ago today, the Lunar Reconnaissance Orbiter (LRO) officially reached orbit about the Moon, and in the past 12 months has gathered more digital information than any previous planetary mission in history. NASA says that maps and datasets collected by LRO’s state-of-the-art instruments will form the foundation for all future lunar exploration plans, as well as be critical to scientists working to better understand the moon and its environment. To celebrate one year in orbit, here are ten great observations made by LRO.

LRO's Diviner instrument found the coldest place in the solar system. Credit: NASA/Goddard/University of California, Los Angeles

1. Coldest Place in the Solar System.

If you think Pluto, a KBO, or the farthest reaches of our solar system are cold, a location closer to Earth is actually colder. Diviner, LRO’s temperature instrument, found a place in the floor of the moon’s Hermite Crater that was detected to be -415 degrees Fahrenheit (-248 Celsius) making it the coldest temperature measured anywhere in the solar system. For comparison, scientists believe that Pluto’s surface only gets down to about -300 degrees Fahrenheit (-184 Celsius). Extremely cold regions similar to the one in Hermite Crater were found at the bottoms of several permanently shaded craters at the lunar south pole and were measured in the depths of winter night.

Enlargement of area surrounding Apollo 11 landing site. Credit: NASA/GSFC/Arizona State University

2. Where Humans Have Walked on the Moon

LRO’s views of the Apollo landing sites are nothing short of stunning, not to mention exciting. Above is LRO’s latest looks at the Apollo 11 landing site, which clearly shows where the descent stage (about 12 feet in diameter) was left behind as well as the astronauts’ tracks and the various equipment they deployed. This LRO data has important scientific value, as it provides context for the returned Apollo samples. Beyond their use for science, the images of all six manned landing sites observed by LRO provide a reminder of NASA’s proud legacy of exploration and a note of inspiration about what humans are capable of in the future.

A pit on the Moon. Credit: NASA/Goddard/Arizona State University

3. Caves on the Moon

What could be more exciting than finding a cave on the Moon, a potential future lunar habitat for human explorers? LRO has now collected the most detailed images yet of at least two lunar pits, quite literally giant holes in the moon. Scientists believe these holes are actually skylights that form when the ceiling of a subterranean lava tube collapses, possibly due to a meteorite impact punching its way through. One of these skylights, the Marius Hills pit, was observed multiple times by the Japanese SELENE/Kaguya research team. With a diameter of about 213 feet (65 meters) and an estimated depth of 260 to 290 feet (80 to 88 meters) it’s a pit big enough to fit the White House completely inside. The image featured here is the Mare Ingenii pit. This hole is almost twice the size of the one in the Marius Hills and most surprisingly is found in an area with relatively few volcanic features.

The Russian Lunokhod rover was imaged by LRO. Credit: NASA/Goddard/Arizona State University

4. Finding Missing Spacecraft

Lunokhod 1 was the name of a Russian robotic rover that landed on the moon in 1970 and navigated about 6 miles (10 km) of the lunar surface over 10 months before it lost contact in September 1971. Scientists were unsure of the rover’s whereabouts, though at least one team of researchers were searching for it, hoping to bounce a laser off of its retroreflector mirrors. This past March however, the LROC team announced they had spotted it, miles from the location the laser team had been searching. Using the info provided by LRO, a laser pulse was sent to Lunokhod 1 and contact was made with the rover for the first time in nearly four decades. Not only did Lunokhod 1’s retroreflector return a signal, but it returned one that was about five times better than those that have routinely been returned by Lunokhod 2’s mirrors over the years.

The Apollo 14 crew came close to seeing the rim of Cone Crater, but not quite. Credit: NASA/Goddard/Arizona State University

5. Apollo 14’s Near Miss of Seeing Cone Crater.

When the Apollo 14 crew of Alan Shepard and Edgar Mitchell walked across their landing site at Fra Maura, they hoped to be able to gather samples from the rim of Cone Crater. But they didn’t ever find the rim, and without a roadmap or guideposts along the way to help them find it, (and also they didn’t have the benefit of riding on the lunar rover so had to walk the entire time). They walked nearly a mile (1400 meters) and the steep incline of the crater rim made the climb difficult, raising the astronaut’s heart rates. Plus the tight schedule of the activity resulted in mission control ordering them to gather whatever samples they could and return to the landing module. They never reached the edge of the crater. Though geologists say it did not greatly affect the success of the scientific goal, the astronauts were personally disappointed in failing to make it to the top. Images from LRO now show precisely just how far the astronauts traveled and how close they came to reaching the crater, their tracks ending only about 100 feet (30 meters) from the rim!

The rim of Cabeus Crater. Credit: NASA/Goddard/Arizona State University

6. Mountains on the Moon.

On the Earth, we are taught that mountains form over millions of years, the result of gradual shifting and colliding plates. On the moon however, the situation is quite different. Even the largest lunar mountains were formed in minutes or less as asteroids and comets slammed into the surface at tremendous velocities, displacing and uplifting enough crust to create peaks that easily rival those found on Earth. On a few occasions in the past year, NASA has tilted the angle of LRO to do calibrations and other tests. In such cases the camera has the opportunity to gather oblique images of the lunar surface like the one featured here of Cabeus Crater providing a dramatic view of the moon’s mountainous terrain. Cabeus Crater is located near the lunar south pole and contains the site of the LCROSS mission’s impact. Early measurements by several instruments on LRO were used to guide the decision to send LCROSS to Cabeus. During the LCROSS impact LRO was carefully positioned to observe both the gas cloud generated in the impact, as well as the heating at the impact site.

Lunar rilles. Image Credit: NASA/JHUAPL/LSI

7. Lunar Rilles: Mysterious Channels on the Moon

Rilles are long, narrow depressions on the lunar surface that look like river channels. Some are straight, some curve, and others, like the ones highlighted here, are called “sinuous” rilles and have strong meanders that twist and turn across the moon. Rilles are especially visible in radar imagery, like that gathered by LRO’s Mini-RF instrument. The formation of lunar rilles is not well understood. It is believed there may be many different formation mechanisms including ancient magma flows and the collapse of subterranean lava tubes. Imagery from LRO will help researchers to better understand these mysterious “river-like” lunar features.

Areas of constant sunlight on the Moon's south pole. Image Credit: NASA/Goddard

8. Areas of Near Constant Sunlight at the South Pole

One of the most vital resources LRO is searching for on the moon is solar illumination. Light from the sun provides both warmth and a source of energy, two critical constraints to exploration efforts. The moon’s axis is only slightly tilted so there are areas in high elevations at its poles that remain almost constantly exposed to the sun. Using LRO’s precise measurements of topography scientists have been able to map illumination in detail, finding some areas with up to 96% solar visibility. Such sites would have continuous sun for approximately 243 days a year and never have a period of total darkness for more than 24 hours.

With Moon Zoo, you can count craters and boulders on the Moon to help lunar scientists. Credit: NASA/Goddard/Arizona State University

9. Moon Zoo lets you Help Lunar Scientists.

The latest Citizen Science project from the Zooniverse, Moon Zoo uses about 70,000 high resolution images gathered by LRO, and in these images are details as small as 50 centimeters (20 inches) across. ‘Zooites’ are asked to categorize craters, boulders and more, including lava channels and later, comparing recent LRO images to ones taken years ago by other orbiting spacecraft.

The first tasks are counting craters and boulders. By comparing and analyzing these feature counts across different regions as well as other places like the Earth and Mars, Zooites can help scientists gain a better understanding of our solar system’s natural history.

The Moon's far side -- the part we never see from Earth. Credit: NASA/Goddard

10. Getting a Good Look at the Far Side.

Tidal forces between the moon and the Earth have slowed the Moon’s rotation so that one side of the moon always faces toward our planet. Though sometimes improperly referred to as the “dark side of the moon,” it should correctly be referred to as the “far side of the moon” since it receives just as much sunlight as the side that faces us. The dark side of the moon should refer to whatever hemisphere isn’t lit at a given time. Though several spacecraft have imaged the far side of the moon since then, LRO is providing new details about the entire half of the moon that is obscured from Earth. The lunar far side is rougher and has many more craters than the near side, so quite a few of the most fascinating lunar features are located there, including one of the largest known impact craters in the solar system, the South Pole-Aitken Basin. The image highlighted here shows the moon’s topography from LRO’s LOLA instruments with the highest elevations up above 20,000 feet in red and the lowest areas down below -20,000 feet in blue.

See the LRO website for more info.

Source: NASA