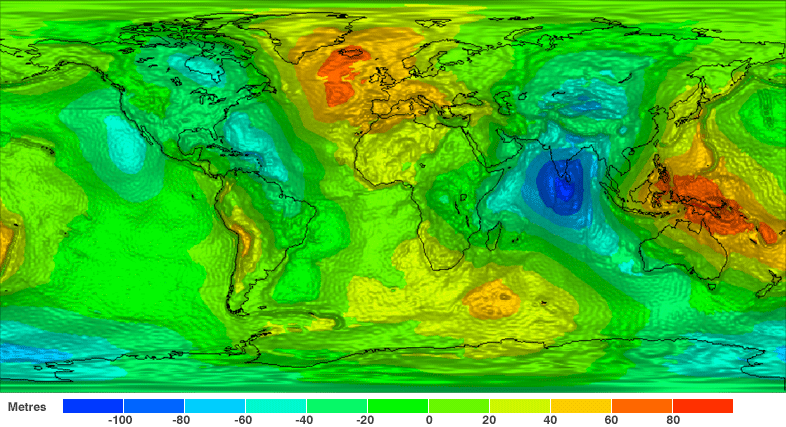
Earth’s Gravity Seen in HD

New map of Earth's gravity field from GOCE. Credit: ESA

[/caption]

The sleek and sexy-looking GOCE satellite has provided a new, finely detailed look at Earth’s gravity – in high definition. This is the first-ever global gravity model and is based on just two months of data from the low-flying GOCE. “GOCE is delivering where it promised: in the fine spatial scales,” GOCE Mission Manager Rune Floberghagen said. “We have already been able to identify significant improvements in the high-resolution ‘geoid’, and the gravity model will improve as more data become available.”

GOCE stands for Gravity field and steady-state Ocean Circulation Explorer.

The geoid is a measure of the lumps and bumps in Earth’s gravity, and shows how the surface would look if an ocean covered the earth, also known as surface of equal gravitational attraction and mean sea level.
Scientists say it is a crucial reference for accurately measuring ocean circulation, sea-level change and ice dynamics – all affected by climate change.
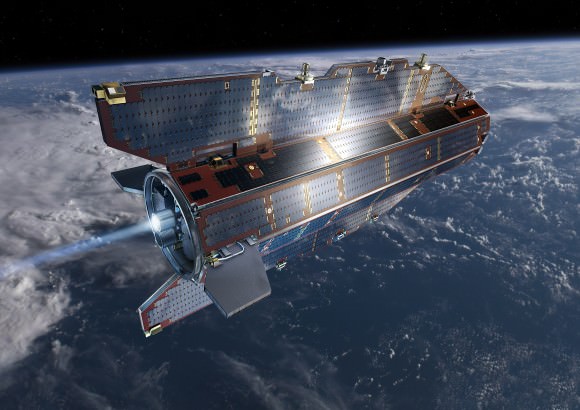
GOCE in orbit. Credit: ESA

The GOCE team presented their initial data at ESA’s Living Planet Symposium. ESA launched GOCE in March 2009, and the data is from November and December 2009.

“Over continents, and in particular in regions poorly mapped with terrestrial or airborne techniques, we can already conclude that GOCE is changing our understanding of the gravity field,” said Floberghagen. Over major parts of the oceans, the situation is even clearer, as the marine gravity field at high spatial resolution is for the first time independently determined by an instrument of such quality.”

This will greatly improve our knowledge and understanding of the Earth’s internal structure, and will be used as a much-improved reference for ocean and climate studies, including sea-level changes, oceanic circulation and ice caps dynamics survey. Numerous applications are expected in climatology, oceanography and geophysics.

“The computed global gravity field looks very promising. We can already see that important new information will be obtained for large areas of South America, Africa, Himalaya, South-East Asia and Antarctica,” said Prof. Reiner Rummel from Technische Universität München, Chairman of the GOCE Mission Advisory Group. “With each two-month cycle of data, the gravity model will become more detailed and accurate. I am convinced that the data will be of great interest to various disciplines of Earth sciences.”

The spacecraft can measure accelerations as small as 1 part in 10,000,000,000,000 of the gravity experienced on Earth.

GOCE flies in orbit at just 254.9 km (158 miles) mean altitude – the lowest orbit sustained over a long period by any Earth observation satellite, but the lower the altitude, the better the data.
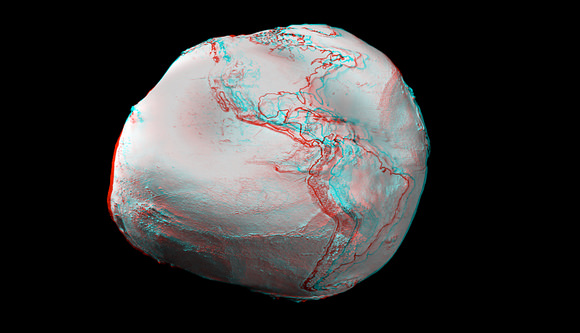
Anaglyph images created from an ESA video animation of global gravity gradients. A more accurate global map will be generated by ESA's GOCE craft. Credit: ESA and Nathaniel Burton Bradford.

The residual air at this low altitude causes the orbit of a standard satellite to decay very rapidly. So, to counteract the drag, the satellite fires an ion thruster using xenon gas, maintaining its orbit. This ensures the gravity sensors are flying as though they are in pure freefall, so they pick up only gravity readings and not the disturbing effects from other forces.

To obtain clean gravity readings, there can be no disturbances from moving parts, so the entire satellite is a single extremely sensitive measuring device.

The new map is just from the first data, and more information will be forthcoming. In May, ESA made available the first set of gravity gradients and ‘high-low satellite-to-satellite tracking’ to scientific and non-commercial users – and much more will come in the following months.

Souces: ESA, BBC

This Week in Space with Miles O’Brien

An exclusive interview with SpaceX’s safety officer delves into the post-flight review of the Falcon 9 test launch. Also this week, the final shuttle missions slip out and John Glenn enters debate about the space program’s future. Subscribe on iTunes to This Week in Space.

Astronomy Without A Telescope – Stellar Archaeology

Artist's impression of Population 3 stars born over 13 billion years ago - the earliest, oldest and presumably now extinct star types. Credit: NASA.

[/caption]

Although, as we look further and deeper into the sky, we are always looking into the past – there are other ways of gaining information about the universe’s ancient history. Low mass, low metal stars may be remnants of the early universe and carry valuable information about the environment of that early universe.

The logic of stellar archaeology involves tracking generations of stars back to the very first stars seen in our universe. Stars born in recent eras, say within the last five or six billion years, we call Population I stars – which includes our Sun. These stars were born from an interstellar medium (i.e. gas clouds etc) that had been seeded by the death throes of a previous generation of stars we call Population II stars.

Population II stars were born from an interstellar medium that existed maybe 12 or 13 billion years ago – and which had been seeded by the death throes of Population III stars, the first stars ever seen in our universe.

And when I say death throes seeding the interstellar medium this includes average sized stars blowing off a planetary nebula at the end of their red giant phase – or bigger stars exploding as supernovae.

So for example, the low metal spectral signature of HE 0107-5240 matches that predicted for a very early low mass Population II star built from the end-products of a Population III supernova.

This is about as close as we can get gathering any information about Population III stars. Telescopes that can look deeper into space (and hence look further back in time) may eventually spot one – but it’s unlikely that any still exist. Theory has it that Population III stars formed from a homogenous interstellar medium of hydrogen and helium. The homogeneity of this medium meant that any stars that formed were all massive – in the order of hundreds of solar masses.

Stars of this scale, not only have short life spans but explode with such a force that the star literally blows itself to bits as a ‘pair-instability’ supernova – leaving no remnant neutron star or black hole behind. Supernova SN2006gy was probably a pair-instability supernova – mimicking the last gasps of Population III stars that lived more than 13 billion years ago.

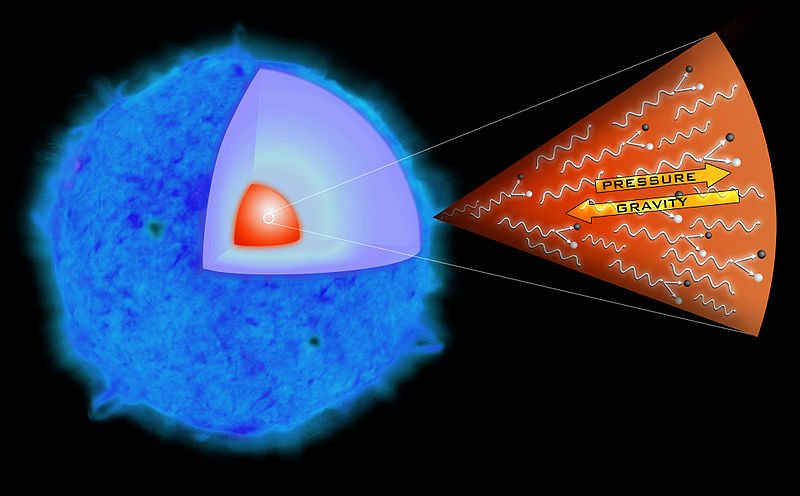
Recipe for a pair instability supernova. In very massive stars, gamma rays radiating from the core become so energetic that they can undergo pair production after interaction with a nucleus. Essentially, the gamma ray creates a paired particle and antiparticle (commonly an electron and a positron). The loss of radiation pressure as gamma rays convert to particles results in gravitational collapse of the star's core - and kaboom! Credit: chandra.harvard.edu

It was only after Population III stars had seeded the interstellar medium with heavier elements that fine structure cooling resulted in disruption of thermal equilibrium and fragmentation of gas clouds – enabling smaller, and hence longer lived, Population II stars to be born.

Around the Milky Way, we can find very old Population II stars in orbiting dwarf galaxies. These stars are also common in the galactic halo and in globular clusters. However, in ‘the guts’ of the galaxy we find lots of young Population I stars.

This all leads to the view that the Milky Way is a gravitational hub nearly as old as the universe itself – which has been steadily growing in size and keeping itself looking young by maintaining a steady diet of ancient dwarf galaxies – which, deprived of such a diet, have remained largely unchanged since their formation in the early universe.

Further reading:

A. Frebel. Stellar Archaeology – Exploring the Universe with Metal-Poor Stars http://arxiv4.library.cornell.edu/abs/1006.2419

Spacecraft to Make Final Flyby of Earth

EPOXI mission patch. Credit: University of Maryland

[/caption]

The re-purposed Deep Impact spacecraft will make one final flyby of Earth on Sunday June 27, 2010, getting a gravity assist to help propel the spacecraft towards a meetup with comet Hartley 2 this fall. The spacecraft bus that brought the Deep Impact “impactor” to comet Tempel 1 in July of 2005 has been put back to work double time where two new missions share the same spacecraft. This is the fifth time this spacecraft has flown by Earth, and at the time of closest approach on Sunday, it will be about 30,400 kilometers (18,900 miles) above the South Atlantic.

“The speed and orbital track of the spacecraft can be changed by changing aspects of its flyby of Earth, such as how close it comes to the planet,” said University of Maryland astronomer Michael A’Hearn, principal investigator for both the new EPOXI mission and its predecessor mission, Deep Impact.

The combined operation EPOXI is a combo-acronym of the two separate missions. The Deep Impact Extended Investigation (DIXI) of comets will observe comet 103P/Hartley 2 during a close flyby in November 2010. The other half of the dynamic duo, called the Extrasolar Planet Observation and Characterization (EPOCh) which is observing stars already known to have transiting giant planets.

“There is always some gravity boost at a flyby and in some cases, like this one, it is the main reason for a flyby. The last Earth flyby was used primarily to change the tilt of the spacecraft’s orbit to match that of comet Hartley 2, and we are using Sunday’s flyby to also change the shape of the orbit to get us to the comet,” said A’Hearn.

The Deep Impact mission smashed a companion probe into comet Tempel 1 on July 4, 2005 to reveal the inner material of a comet.

“Earth is a great place to pick up orbital velocity,” said Tim Larson, the EPOXI project manager from NASA’s Jet Propulsion Laboratory in Pasadena, Calif. “This flyby will give our spacecraft a 1.5-kilometer-per-second [3,470 mph] boost, setting us up to get up close and personal with comet Hartley 2.”

During a previous flyby of Earth, the mission team has used the spacecraft’s instruments to find evidence of water on the Moon and to study light reflected from Earth as a template that scientists eventually may be able be use to identify Earth-like planets around other stars.

Source: University of Maryland

ISS Will Be in Constant Sunlight the Next Few Days

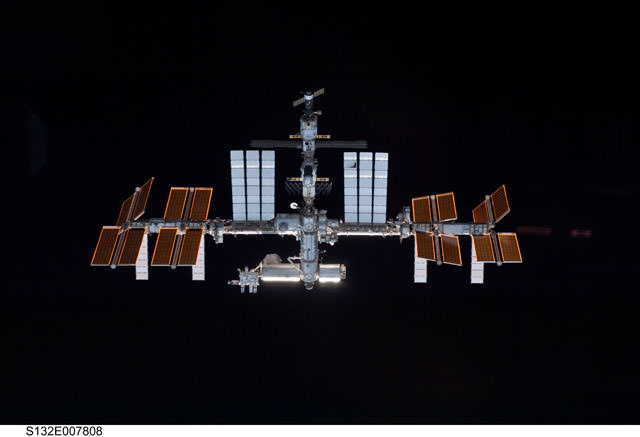
I just took a look at Heaven’s Above to check on when I could see the International Space Station this weekend, and got the surprise of my life! On Saturday (June 26) I have 5 — count ’em — 5 opportunities to see it! That is completely unusual, so what’s up? For the next few days, the International Space Station (ISS) will be orbiting Earth in constant sunlight, as its orbit lines up with Earth’s day-night terminator. Therefore, the ISS will be putting on an incredible show the next few nights, since it will be constantly illuminated, and will be visible in the night sky every single time it passes overhead. Some observers will be able to see the space station 3, 4 — or like me — even 5 times a night. Check on Heaven’s Above, or NASA’s NASA has a Skywatch page where you can find your specific city to look for satellite sighting info.

Spaceweather.com, has a Satellite Tracker Tool. Just put in your zip code (good for the US and Canada) to find out what satellites will be flying over your house.

I’m expecting you all are going to be submitting some great astrophotos of the ISS during the next few days! Send ’em in!

Weekend SkyWatcher’s Forecast: June 25-27, 2010

Greetings, fellow SkyWatchers! If we can keep the clouds and rain away, this will be an incredible weekend to enjoy some peaceful and relaxing time under the Moon and stars. We’ll begin with a heads up on a partial lunar eclipse whose beginning – or end – will be visible to most of us. Check your times carefully, because this one crosses the international date line! While you’re out, take a look at the lunar surface for some very interesting craters – or just relax with binoculars and suck in the photons of some curious variable stars. Are you ready? Then I’ll see you in the back yard…

June 25, 2010 – Today celebrates the birth of Hermann Oberth. Born in 1894 on this date, Oberth is considered to be the father of modern rocketry and space travel. But you won’t need a rocket to travel skyward as we gear up for the 2010 partial lunar eclipse!

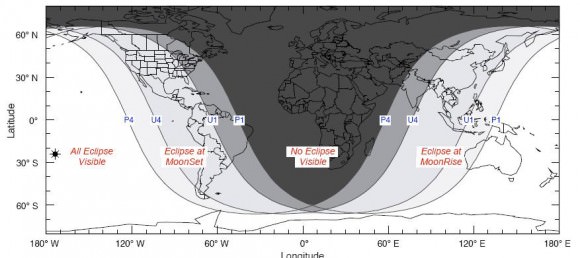
A major section of western North and South America is in for treat as they will be able to see the beginning stages. These areas include Western Brazil, western Venezuela, and South American countries west of these locations. Believe it or not, a section of the southeastern United States will even be able to witness the eclipse – if it’s not raining!


The dividing line runs through the state of Georgia following a diagonal path north to Minnesota. States west of this line will also be within range of seeing the entire event until sunrise. On the west coast of the United States, the Moon will slide into umbral eclipse at 3:16 a.m. PDT, be deepest in shadow at 4:38 a.m. PDT, and the eclipse ends at 6:00 a.m. PDT – right about dawn. Locations that will be able to see the entire partial eclipse include the Pacific islands such as Hawaii, Polynesia, Fiji, Marshall Islands, New Zealand, Papua New Guinea, Australia, and most of Japan and the Philippines. Regions such as eastern China, the east edge of the USSR, Indonesia and the Thailand area will be able to see the very end of the 2010 partial lunar eclipse.

Despite bright skies tonight, take out your binoculars and look for a circlet of seven stars that reside about halfway between orange Arcturus and brilliant blue-white Vega. This quiet constellation is named Corona Borealis, or the Northern Crown.


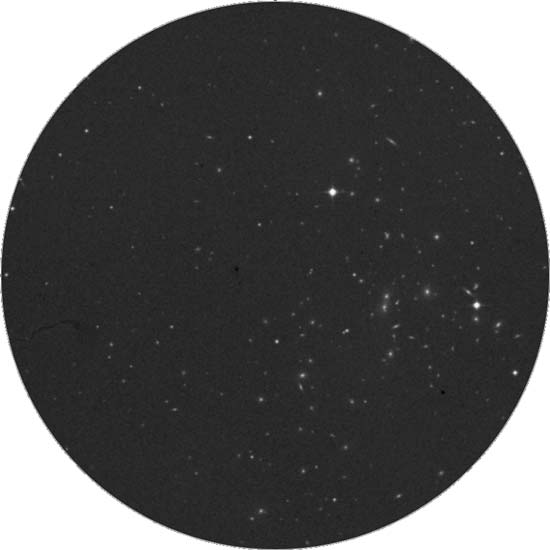
Just northwest of its brightest star is a huge concentration of over 400 galaxies that reside over a billion light-years away from us. Known as Abell 4065, the Corona Borealis Galaxy Cluster is an area so small in apparent size that from our point of view we could eclipse it with a small coin held at arm’s length!

June 26, 2010 – Happy Birthday, Charles Messier! Born in 1730 on this date, almost everyone recognizes the name of this French astronomer who discovered 15 comets. He was the first to compile a systematic catalog – the ‘‘M objects.’’ The Messier Catalogue (1784) contains 103 star clusters, nebulae, and galaxies. But did you know Lyman Spitzer, Jr, shared this birthday? Born in 1914, Spitzer advanced our knowledge of physical processes in interstellar space and pioneered efforts to harness nuclear fusion as a clean energy source. He studied star-forming regions and suggested that the brightest stars in spiral galaxies formed recently. Not only that, but Spitzer was the first person to propose placing a large telescope in space, and so launched the development of the Hubble Space Telescope!

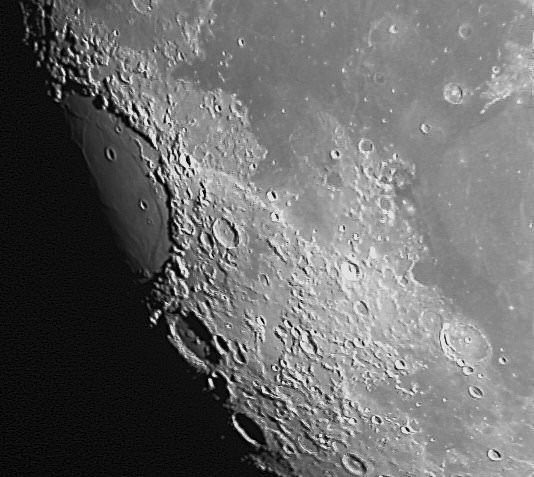
Tonight the mighty Moon will still rule the sky, providing a wonderful opportunity for casual inspection. Why not grab a telescope and view the lunar surface for a couple of telescopic challenges that are easy to catch? All you have to know is Mare Crisium!


On the southeastern shoreline is a peninsula that reaches into Crisium’s dark basin. This is Promontorium Agarum. On the western shore, bright Proclus lights the banks, but look into the interior for the two dark pockmarks of Pierce to the north and Picard to the south. Be sure to mark them on your notes!

When you’re finished, point your binoculars or telescopes back toward Corona Borealis and about three finger-widths northwest of Alpha for variable star R (RA 15 48 35 Dec +28 09 24). This star is a total enigma. Discovered in 1795, most of the time R carries a magnitude near 6 but can drop to magnitude 14 in a matter of weeks – only to unexpectedly brighten again! It is believed that R emits a carbon cloud, which blocks its light. Oddly enough, scientists can’t even accurately determine the distance to this star! When studied at minimum, the light curve resembles a ‘‘reverse nova’’ and has a peculiar spectrum. It is very possible that this ancient Population II star has used all of its hydrogen fuel and is now fusing helium to form carbon.

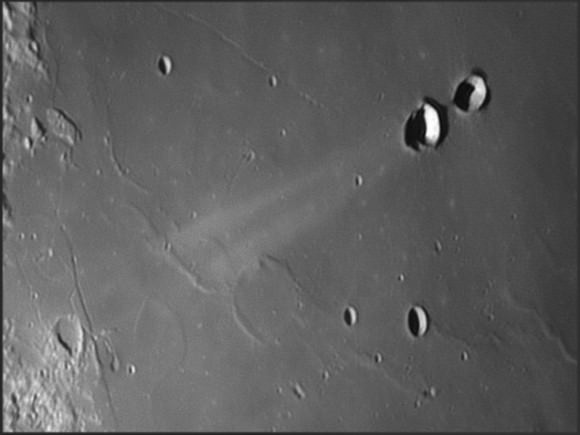
July 27, 2010 – Tonight we’ll again honor the June 26 birth of Charles Messier by heading toward the lunar surface first, in order to pick off another study object on our list – the twin crater pair Messier and Messier A.


Located in Mare Fecunditatis about a third of its width from west to east, these two craters will be difficult to find in binoculars, but not hard for even a small telescope and intermediate power. Indeed named for the famed French astronomer, the easternmost crater is somewhat oval in shape, with dimensions of 9 by 11 kilometers. At high power, Messier A to the west appears to have overlapped a smaller crater during its formation; and it is slightly larger at 11 by 13 kilometers. Although it is not on the challenge list, you’ll find another point of interest to the northwest. Rima Messier is a long surface crack, which runs diagonally across Mare Fecunditatis’s northwestern flank and reaches a length of 100 kilometers.

For variable star fans, let’s return to and focus our attention on S Coronae Borealis, located just west of Theta and the westernmost star in the constellation’s arc formation (RA 15 21 23 Dec +31 22 02). At magnitude 5.3, this long-term variable takes almost a year to go through its changes – usually far outshining the 7th magnitude star to its northeast – but will drop to a barely visible magnitude 14 at minimum. Compare it to the eclipsing binary U Coronae Borealis about a degree northwest. In slightly over 3 days, this Algol-type will range by a full magnitude as its companions draw together.

Until next week? Wishing you clear skies!

This article’s awesome illustrations are: Eclipse Chart courtesy of NASA, Abell 4065, R CorBor and S CorBor from Palomar Observatory, courtesy of Caltech, Lyman Spitzer historical image, Crisium in Decline courtesy of Shevill Mathers and Messier craters by Damien Peach. We thank you so much!

See the Sunrise Daily at Kennedy Space Center

A beautiful sunrise at Kennedy Space Center in the Industrial Area. Credit: Jen Scheer, @flyingjenny on Twitter.

[/caption]

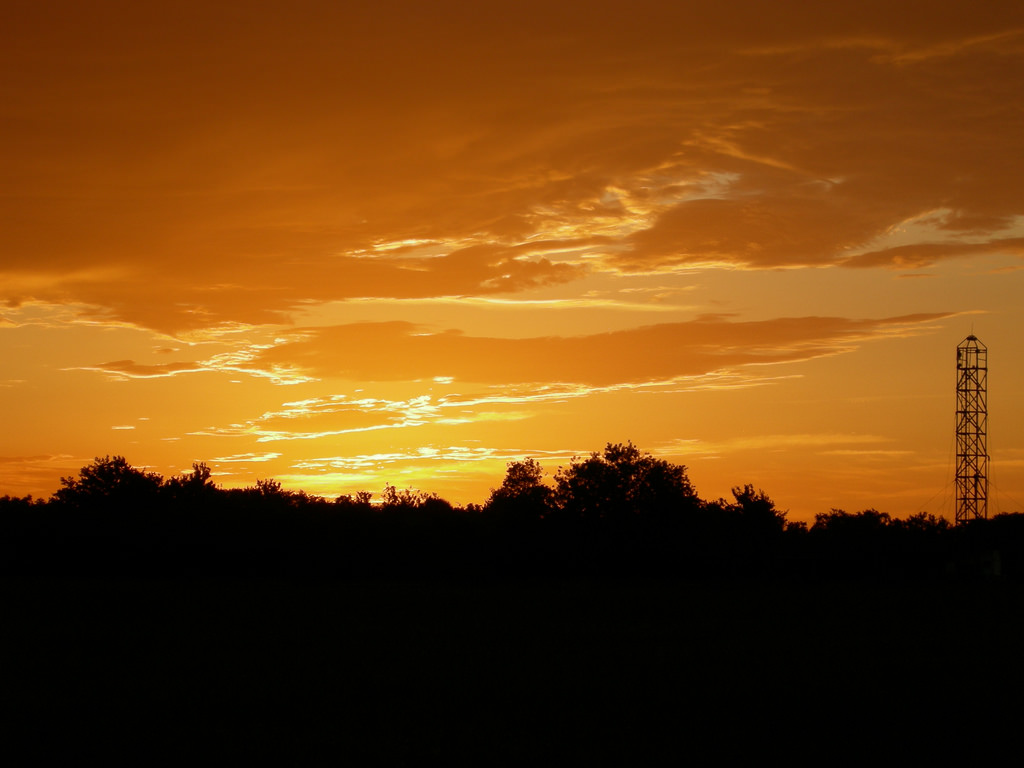
Sunrises are beautiful almost any place in the world, but for some reason first light every morning over Central Florida is almost always breathtaking. Then, if you add into the mix a sunrise over Kennedy Space Center — America’s Spaceport — any space geek will likely melt with delight. Thanks to Jen Scheer, a shuttle technician at KSC, anyone can see the sunrise over the space center almost every day. Jen takes tons of images at KSC and shares them via Twitter (follow her @flyingjenny) and her Flickr page, but her specialty is taking a daily picture or two of the sunrise. “I’ve been taking sunrise pics since 2006,” Jen told me, “but only sporadically until early January of this year. That’s when I began stepping it up a bit, and it became a daily thing.”

Some of the images have some interesting landmarks or space-related features in them, too, such as the image above, or the one below that includes the Vertical Processing Facility which housed many parts of Hubble at one time, as well as Chandra and others. This image is especially poignant as that building was recently torn down. “In some of my sunrise pics, you can see the progression of it being dismantled,” Jen said.

'Serene' by Jen Scheer. The building on the left is the Vertical Processing Facility, which is now demolished.

But don’t wait very long to take advantage of Jen’s marvelous photography. With the shuttle program ending soon, Jen’s job will be eliminated and she likely will not be working at KSC much longer. “We all love the shuttle program and will be very sad to see it come to an end,” Jen said. (Read our previous article, “Tough Times Could Be Ahead for Kennedy Space Center.“) “There are a lot of people who have no idea what they are going to do when it is all over. I’m looking into some possibilities, but we’ll just have to see how everything turns out.”

As an avid supporter of spaceflight, Jen also started the Space Tweep Society, an organization with a mission to “promote enthusiasm for all things space and to unite those inside the space industry with those who are outside looking in.” Check out the website for how you can get involved.

Climate Change Contributes to Space Junk Problem

An upper stage of a spacecraft exploding. Image Credit: ESA

[/caption]
The effects of climate change can be seen across the majority of the planet, but a new study reveals it is also affecting the space environment. New Scientist reports that increased carbon dioxide levels are cooling the upper atmosphere, which decreases the atmospheric density. This in turn affects how long defunct satellites, spent rocket boosters and other space debris stay in orbit, contributing to the space junk problem.

Atmospheric drag creates a braking effect on space debris, and eventually causes the various bits and pieces to drop out of orbit and burn up. Two researchers at the University of Southampton in the UK, Arrun Saunders and Hugh Lewis, studied the orbits of 30 satellites over the past 40 years, and recorded a gradual increase in the time they remain in orbit.

They calculated that at an altitude of 300 kilometers, the atmosphere is reducing in density by 5 per cent every decade. “The lower molecular braking means debris can remain in orbit up to 25 per cent longer,” said Lewis.

This raises the risk of collisions with satellites and makes it more hazardous to launch spacecraft. Space agencies and commercial launch companies may need to step up the current space debris mitigation procedures now in place, which include employing on-board passive measures to eliminate the potential for explosions from batteries, fuel tanks, propulsion systems and pyrotechnics, which helps reduce the number of objects in orbit. Or we may need to find a way to remove debris from orbit sooner rather than later.

Saunders and Lewis presented their work at a conference in Boulder, Colorado, last week.

Source: New Scientist

Was Venus Once a Waterworld?

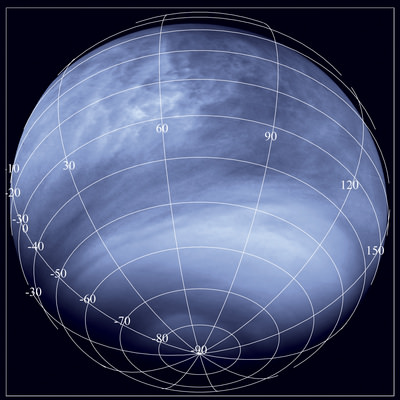
Venus Monitoring Camera image taken in the ultraviolet (0.365 micrometres), from a distance of about 30,000 km. Credits: ESA/MPS/DLR/IDA

[/caption]

Ever read Isaac Asimov’s 1950’s novel “Lucky Starr and the Oceans of Venus”? Maybe Asimov wasn’t so wrong about Venus after all. Analyzing data from ESA’s Venus Express, planetary scientists are looking at the possibility that the planet may have once harbored oceans, and potentially could have been habitable when during its early history.

While Earth and Venus are comparable in size, they otherwise seem completely different. Earth is a lush, clement world teeming with life, while Venus is hellish, its surface roasting at temperatures higher than those of a kitchen oven.

The biggest difference between the two planets is that Venus has very little water, while Earth is bathed in it. Were the contents of Earth’s oceans to be spread evenly across the world, they would create a layer 3 km deep. If you were to condense the amount of water vapor in Venus’ atmosphere onto its surface, it would create a global puddle just 3 cm deep.

But scientists are beginning to think that billions of years ago, Venus probably had much more water. Venus Express has confirmed that the planet has lost a large quantity of water into space, by measuring the rate of how much hydrogen and oxygen is escaping into space, as the Sun’s ultraviolet radiation beats down on the planet and breaks up water molecules.

Venus Express has measured the rate of this escape and confirmed that roughly twice as much hydrogen is escaping as oxygen. It is therefore believed that water is the source of these escaping ions. It has also shown that a heavy form of hydrogen, called deuterium, is progressively enriched in the upper echelons of Venus’s atmosphere, because the heavier hydrogen will find it less easy to escape the planet’s grip.

“Everything points to there being large amounts of water on Venus in the past,” says Colin Wilson, Oxford University, UK. But that does not necessarily mean there were oceans on the planet’s surface.

Eric Chassefière, Université Paris-Sud, France, has developed a computer model that suggests the water was largely atmospheric and existed only during the very earliest times, when the surface of the planet was completely molten. As the water molecules were broken into atoms by sunlight and escaped into space, the subsequent drop in temperature probably triggered the solidification of the surface. In other words: no oceans.

Although it is difficult to test this hypothesis it is a key question. If Venus ever did possess surface water, the planet may possibly have had an early habitable phase.

Even if true, Chassefière’s model does not preclude the chance that colliding comets brought additional water to Venus after the surface crystallized, and these created bodies of standing water in which life may have been able to form.

There are many open questions. “Much more extensive modelling of the magma ocean–atmosphere system and of its evolution is required to better understand the evolution of the young Venus,” said Chassefière.

When creating those computer models, the data provided by Venus Express will prove crucial.

The Venus Express team are meeting this week to discuss their latest findings at the International Venus Conference in Aussois, France.

Source: ESA

Evidence for Past Water on Mars Keeps Flowing, This Time from Glaciers

This image shows a river that sprang from a past glacier from an unnamed crater in Mars’ middle latitudes. Credit: NASA/JPL/MSSS

[/caption]

No sooner do we post one article about water on Mars when it’s time for another. Planetary scientists have uncovered telltale signs of water on Mars — frozen and liquid — in the earliest period of the Red Planet’s history. They found evidence of running water that sprang from glaciers throughout the Martian middle latitudes as recently as the Amazonian epoch, several hundred million years ago. These glaciofluvial valleys were, in essence, tributaries of water created when enough sunlight reached the glaciers to melt a thin layer on the surface. This led to “limited surface melting” that formed channels that ran for several kilometers and could be more than 150 feet wide.

The finding is “more than ‘Yes, we found water,’” said Caleb Fassett from Brown University, who along with Brown research analyst James Dickson, professor James Head III, and geologists from Boston University and Portland State University published a paper in Icarus. “What we see now is there’s this complex history of different environments where water is being formed.”

The team analyzed 15,000 images snapped by the Context Camera (CTX) aboard the Mars Reconnaissance Orbiter to compile the first survey of glaciofluvial valleys on Mars. The survey was sparked by a glaciofluvial valley that Dickson, Fassett, and Head spotted within the Lyot crater, located in the planet’s middle latitudes. The team, in a paper last year in Geophysical Research Letters, dated that meltwater-inspired feature to the Amazonian.

In his survey, Fassett found dozens of other Amazonian-era ice deposits that spawned supraglacial and proglacial valleys, most of them located on the interior and exterior of craters in Mars’ midlatitude belt. “The youthfulness (of the features) is surprising,” he said. “We think of [post-Noachian] Mars as really, really cold and really, really dry, so the fact that these exist, in those kinds of conditions, is changing how we view the history of water on the planet.”

What makes the finding even more intriguing is that the Brown planetary scientists can study what they believe are similar conditions on Earth. Teams from Brown and Boston University have visited the Antarctic Dry Valleys for years, where the surfaces of glaciers melt during the austral summer, sparking enough meltwater to carve a channel. The team will return to the Dry Valleys later this year to continue the study of this microclimate.

“It’s sort of crazy,” said Dickson, a member of the Brown team who stayed in the Dry Valleys for three months last year. “You’re freezing cold and there’s glacial ice everywhere, and it gets just warm enough that you get a river.”

Fassett plans to search for more glaciofluvial valleys as more images come from the CTX, which has mapped roughly 40 percent of the planet.

Source: Brown University