What is Space?

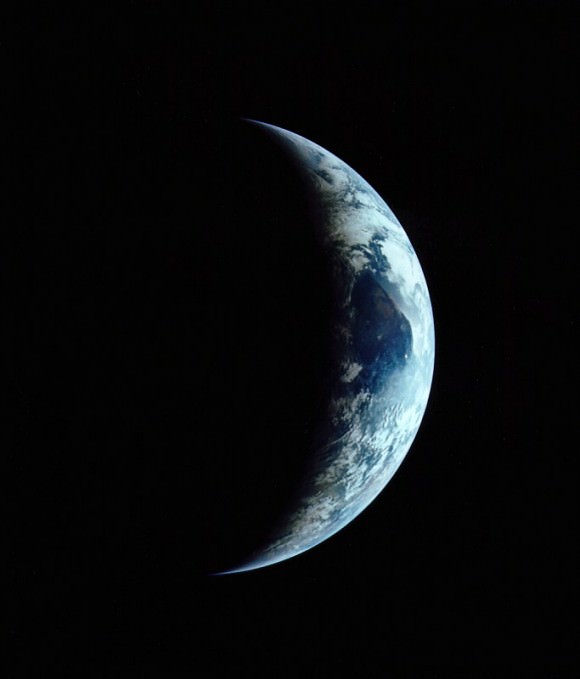
First, some simple answers: space is everything in the universe beyond the top of the Earth’s atmosphere – the Moon, where the GPS satellites orbit, Mars, other stars, the Milky Way, black holes, and distant quasars. Space also means what’s between planets, moons, stars, etc – it’s the near-vacuum otherwise known as the interplanetary medium, the interstellar medium, the inter-galactic medium, the intra-cluster medium, etc; in other words, it’s very low density gas or plasma (‘space physics’ is, in fact, just a branch of plasma physics!).

But you really want to know what space is, don’t you? You’re asking about the thing that’s like time, or mass.

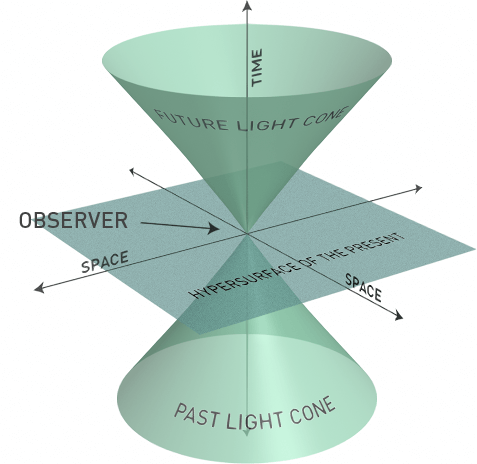
And one simple, but profound, answer to the question “What is space?” is “that which you measure with a ruler”. And why is this a profound answer? Because thinking about it lead Einstein to develop first the theory of special relativity, and then the theory of general relativity. And those theories overthrew an idea that was built into physics since before the time of Newton (and built into philosophy too); namely, the idea of absolute space (and time). It turns out that space isn’t something absolute, something you could, in principle, measure with lots of rulers (and lots of time), and which everyone else who did the same thing would agree with you on.

Space, in the best theory of physics on this topic we have today – Einstein’s theory of general relativity (GR) – is a component of space-time, which can be described very well using the math in GR, but which is difficult to envision with our naïve intuitions. In other words, “What is space?” is a question I can’t really answer, in the short space I have in this Guide to Space article.

More reading: What is space? (ESA), What is space? (National Research Council of Canada), Ned Wright’s Cosmology Tutorial, and Sean Carroll’s Cosmology Primer pretty much cover this vast topic, from kids’ to physics undergrad’ level.

It’s hard to know just what Universe Today articles to recommend, because there are so many! Space Elevator? Build it on the Moon First illustrates one meaning of the word ‘space’; for meanings closer to what I’ve covered here, try New Way to Measure Curvature of Space Could Unite Gravity Theory, and Einstein’s General Relativity Tested Again, Much More Stringently.

Astronomy Cast episodes Einstein’s Theory of Special Relativity, Einstein’s Theory of General Relativity, Large Scale Structure of the Universe, and Coordinate Systems, are all good, covering as they do different ways to answer the question “What is space?”
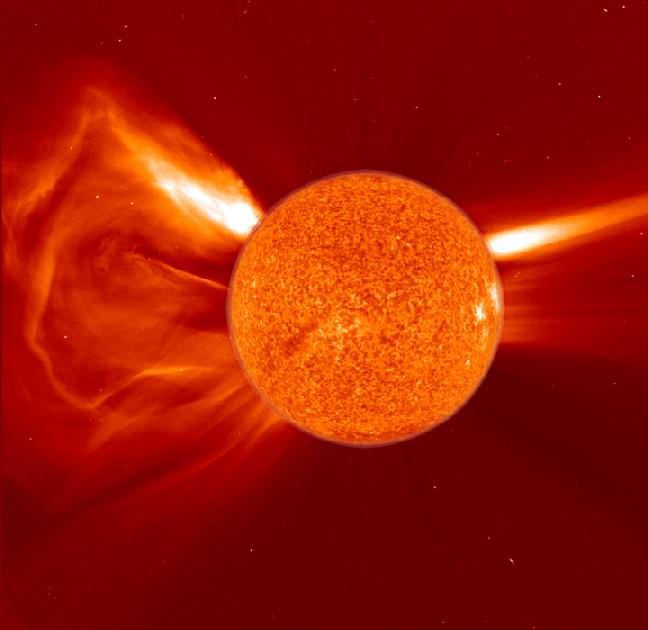
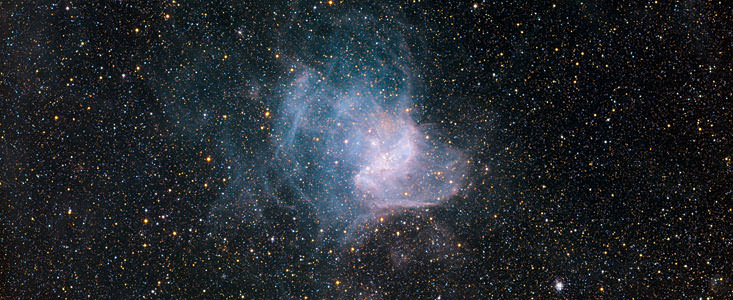
Source: ESA

This Week’s astro-ph Preprints: Jean Tate’s Best Pick

Examples of ring objects (Mizuno et al./Spitzer)

It goes by the super-catchy (not!) title “A Catalog of MIPSGAL Disk and Ring Sources”. I chose it, over 213 competitors, because it’s pure astronomy, and because it’s something you don’t need a PhD to be able to do, or even a BSc.

Oh, and also because Don Mizuno and co-authors may have found two, quite local, spiral galaxies that no one has ever seen before!

Some quick background: arXiv has been going for several years now, and provides preprints, on the web, of papers “in the fields of physics, mathematics, non-linear science, computer science, quantitative biology and statistics”. It’s owned, operated and funded by Cornell University. astro-ph is the collection of preprints classified as astro physics; the “recent” category in astro-ph is the new preprints submitted in the last week.

When I have any, one of my favorite spare-time activities is browsing astro-ph (Hey, I did say, in my profile, that I am hooked on astronomy!)

Briefly, what Mizuno and his co-authors did was get hold of some of the images from Spitzer (something that anyone can do, provided their internet connection has enough bandwidth), and eyeball them, looking for things which look like disks and rings. Having found over 400 of them, they did what the human brain does superbly well: they grouped them by similarity of appearance, and gave the groups names. They then checked out other images – from different parts of Spitzer’s archive, and from IRAS – and checked to see how many had already been cataloged.

And what did they find? Well, first, that most of the objects they found had not been cataloged before, and certainly not given definite classifications! Many, perhaps most, of the new objects are planetary nebulae, and their findings may help address a long-standing puzzle in this part of astronomy.

MGE314.2378+00.9793 (Mizuno et al./Spitzer)
MGE351.2381-00.0145 (Mizuno et al./Spitzer)

But they also may have found two local spiral galaxies, which had not been noticed before because they are obscured by the gas-and-dust clouds in the Milky Way plane. How cool is that!

Here’s the ‘credits’ section of the preprint: “This work is based on observations made with the Spitzer Space Telescope, which is operated by the Jet Propulsion Laboratory, California Institute of Technology under a contract with NASA. Support for this work was provided by NASA in part through an award issued by JPL/Caltech. This research made use of the SIMBAD database and the Vizier catalog access tool, operated by the Centre de Donnees Astronomique de Strasbourg. This research has also made use of NASA’s Astrophysics Data System Bibliographic Services.”

And here’s the preprint itself: arXiv:1002.4221 A Catalog of MIPSGAL Disk and Ring Sources; D.R. Mizuno(1), K. E. Kraemer(2), N. Flagey(3), N. Billot(4), S. Shenoy(5), R. Paladini(3), E. Ryan(6), A. Noriega-Crespo(3), S. J. Carey(3). ((1) Institute for Scientific Research, (2) Air Force Research Laboratory, (3) Spitzer Science Center, (4) NASA Herschel Science Center, (5) Ames Research Center, (6) University of Minnesota)

PS, going over the Astronomy Cast episode How to be Taken Seriously by Scientists is what motivated me to pick this preprint (however, I must tell you, in all honesty, that there are at least ten other preprints that are equally pickable).

Ripped to Shreds, Exoplanet Suffers Painful Death

Illustration of WASP-12b in orbit about its host star (Credit: ESA/C Carreau)

[/caption]
WASP-12b, discovered in 2008, is a real outlier among the 400 or so exoplanets discovered to date. Not that it’s particularly massive (it’s a gas giant, not unlike Jupiter), nor that its homesun (host star) is particularly unusual (it’s rather similar to our own Sun), but it orbits very close to its homesun, and is considerably larger than any other gas giant discovered to date.

Results from recent research explain why WASP-12b is so unusual; we’re watching it die a painful death at the hands of its homesun, which is snacking on it.

“This is the first time that astronomers are witnessing the ongoing disruption and death march of a planet,” says UC Santa Cruz professor Douglas N.C. Lin. Lin is a co-author of the new study and the founding director of the Kavli Institute for Astronomy and Astrophysics (KIAA) at Peking University, which was deeply involved with the research.

The research was led by Shu-lin Li of the National Astronomical Observatories of China. A graduate of KIAA, Li and a research team analyzed observational data on the planet to show how the gravity of its parent star is both inflating its size and spurring its rapid dissolution.

WASP-12b, like most known exoplanets discovered to date, is large and gaseous, resembling Jupiter and Saturn; however, unlike Jupiter, Saturn, or most other exoplanets, it orbits its homesun at extremely close range – 75 times closer than the Earth is to the Sun, or just over 1.5 million km. It is also larger than astrophysical models predict. Its mass is estimated to be almost 50% larger than Jupiter’s and it is 80% larger, giving it six times Jupiter’s volume. It is also unusually toasty, with a daytime temperature of more than 2500° C.

Some mechanism must be responsible for expanding this planet to such an unexpected size, say the researchers. They have focused their analysis on tidal forces, which they say are strong enough to produce the effects observed on WASP-12b.

On Earth, tidal forces between the Earth and the Moon cause local sea levels rise and fall, modestly, twice a day. WASP-12b, however, is so close to its homesun that the gravitational forces are enormous. The tremendous tidal forces acting on the planet completely change the shape of the planet into something similar to that of a rugby or American football.

These tides not only distort the shape of WASP-12b. By continuously deforming the planet, they also create friction in its interior. The friction produces heat, which causes the planet to expand. “This is the first time that there is direct evidence that internal heating (or ‘tidal heating’) is responsible for puffing up the planet to its current size,” says Lin.

Huge as it is, WASP-12b faces an early demise, say the researchers. In fact, its size is part of its problem. It has ballooned to such a point that it cannot retain its mass against the pull of its homesun’s gravity. As the study’s lead author Li explains, “WASP-12b is losing its mass to the host star at a tremendous rate of six billion metric tons each second. At this rate, the planet will be completely destroyed by its host star in about ten million years. This may sound like a long time, but for astronomers it’s nothing. This planet will live less than 500 times less than the current age of the Earth.”

The WASP-12 system (Courtesy: KIAA/Graphic: Neil Miller)

About this image: The massive gas giant WASP-12b is shown in purple with the transparent region representing its atmosphere. The gas giant planet’s orbit is somewhat non-circular. This indicates that there is probably an unseen lower mass planet in the system, shown in brown, that is perturbing the larger planet’s orbit. Mass from the gas giant’s atmosphere is pulled off and forms a disk around the star, shown in red.

The material that is stripped off WASP-12b does not fall directly onto the parent star; instead it forms a disk around the star and slowly spirals inwards. A careful analysis of the orbital motion of WASP-12b suggests circumstantial evidence of the gravitational force of a second, lower-mass planet in the disk. This planet is most likely a massive version of the Earth – a so-called “super-Earth.”

The disk of planetary material and the embedded super-Earth should be detectable with currently available telescope facilities. Their properties can be used to further constrain the history and fate of the mysterious planet WASP-12b.

In addition to KIAA, support for the WASP-12b research came from NASA, the Jet Propulsion Laboratory, and the National Science Foundation. Along with Li and Lin, co-authors include UC Santa Cruz professor Jonathan Fortney and Neil Miller, a graduate student at the university.

Source: KIAA; the paper published in the February 25 issue of Nature is “WASP-12b as a prolate, inflated and disrupting planet from tidal dissipation” (arXiv:1002.4608 is the preprint).

Stunning New Looks at the Mars Avalanche

A single-image photoclinometric 3D reconstruction of the Mars avalanche from HiRISE. Image data: NASA/JPL/UA; 3D model: Bernhard Braun

[/caption]

Remember the amazing image of an avalanche on Mars back in 2008, captured by the HiRISE camera on the Mars Reconnaissance Orbiter? Bernhard Braun from UnmannedSpaceflight.com has now created several different 3-D views of the event, providing never-seen-before, ground-level observations by using special software he developed that can create three dimensional images from one 2-dimensional picture. Normally, to create a 3-D image you need at least two images, or you have to combine images with data from an instrument such as a laser altimeter. But Braun’s single-image photoclinometric 3D reconstruction algorithm, also known as “shape from shading” allows the shape of three dimensional objects to be recovered from shading in a two-dimensional image. Braun told Universe Today that since developing the software, one of the areas he has wanted to “visit from the ground” is the famous dust avalanche caught live in action by HiRISE. His images provide an entirely new — and stunning — view of Mars.

A single-image photoclinometric 3D reconstruction of the Mars avalanche from HiRISE. Image data: NASA/JPL/UA; 3D model: Bernhard Braun

Braun said that the software is useful to look at various areas of interest, in particular where we have no other (i.e stereo-imaging based) detailed 3D reconstructions yet. Previously, we’ve shown 3-D movies on Universe Today that Doug Ellision and others from UnmannedSpaceflight.com have created from HiRISE DEMs (Digitial Elevation Models) which are a grid, or raster file describing elevation values at regularly spaced points, or posts. HiRISE DEMs are made from two high-resolution images of the same area, taken from different look angles by the spacecraft. The HiRISE folks say that creating a DEM is complicated and involves sophisticated software and a lot of time, both computing time and man-hours.

But Braun’s software (although it took him quite some time to develop) allows for a moderate processing time, about 15 minutes per medium-resolution image, using about 2 gigabytes of memory. Also, no texturing or additional coloring/shading was applied when rendering the surface, and every detail visible is real 3D down to the pixel-level.

But, Braun doesn’t think his method is in any way “superior” to the HiRISE team’s efforts.

“Quite to the contrary,” he told me via email. “Traditionally, single-image shape-from-shading methods like the one that I developed, are considered to nicely complement the multi-image (stereo) methods because the weaknesses of one method (large scale distortions in single-image-methods vs. less detail resolution in multi-image methods ) is the strength of the other. Also, the official HiRISE DEMs are generally more accurate at exactly reproducing absolute terrain heights (also using altimeter-based calibration), which is important for scientific usage, whereas my DEMs are less well calibrated because they are mainly intended for visualization purposes.”

The main advantage of the single-image method is that it can be used on almost arbitrary images of areas where there isn’t 3D coverage yet, such as capturing an event like an avalanche.

“In a way, it opens the door to an entirely new view of large existing 2D-only data sets, Braun said. “For example, currently I am working on an extension of the method to radar images for hi-resolution 3D reconstructions of the highest-resolution Venus Magellan data sets.”

Braun’s software method could be considered more of an art form.

“I view my software and algorithms not so much as a scientific measuring instrument,” Braun told me in an email, “but more as a tool for visualization that leaves a bit of artistic license, a degree in freedom of interpretation i.e. the means for creating atmospheric images and it is those images that are the real “publishable end product” of the whole process. The algorithms and software are just the ‘painters brush and easel’ or the photographer’s virtual camera so to speak.”

Another single-image photoclinometric 3D reconstruction of the Mars avalanche from HiRISE. Image data: NASA/JPL/UA; 3D model: Bernhard Braun

Emily Lakdawalla did a wonderful job of explaining the whys and hows of the entire process in the Planetary Society Blog: (go there if you’d like a more detailed description) “Imagine a crumpled piece of paper lit by a spotlight. Facets of the crumpled paper that are perpendicular to the spotlight will appear brightest; facets tilted away from the spotlight will appear dark. If you assume that everything in the picture reflects light in the same way, then you can tell by its albedo, or brightness, whether it is tilted toward or away from the light source. ”
A Mars Avalanche, taken by NASAs HiRISE instrument on the Mars Reconnaisance Orbiter (Credit: NASA/HiRISE)

Above is the original image from HiRISE. When looking at these images, remember that this particular scarp on Mars is a high cliff over 700 m (2300 ft) tall and slopes at over 60 degrees. A mixture of ice, rock and dust can be seen, frozen in time, as it is plummeting down the slope, ejecting a plume of dust as the debris begins to settle on the gentle slope at the bottom of the cliff. The ejected cloud is approximately 180 meters across and extends about 190 meters beyond the base of the cliff.

Braun told us he is working on some new images which we hope to be able to share with you soon, and we extend our thanks to him for allowing us to post the avalanche images on Universe Today.

Follow this link to look at Braun’s entire gallery of wonderful color 3D renderings of the avalanche, derived from the originally published HiRISE image, rendered under various viewing positions and light source directions.

Nailing Down Goldilocks: What’s “Just Right” for Exo-Earths?

Cresent Earth

For Goldilocks, the porridge had to be not too hot, and not too cold … the right temperature was all she needed.

For an Earth-like planet to harbor life, or multicellular life, certainly temperature is important, but what else is important? And what makes the temperature of an exo-Earth “just right”?

Some recent studies have concluded that answering these questions can be surprisingly difficult, and that some of the answers are surprisingly curious.

Consider the tilt of an exo-Earth’s axis, its obliquity.

In the “Rare Earth” hypothesis, this is a Goldilocks criterion; unless the tilt is kept stable (by a moon like our Moon), and at a “just right” angle, the climates will swing too wildly for multicellular life to form: too many snowball Earths (the whole globe covered in snow and ice with an enhanced albedo effect), or too much risk of a runaway greenhouse.

“We find that planets with small ocean fractions or polar continents can experience very severe seasonal climatic variations,” Columbia University’s David Spiegel writes*, summing up the results of an extensive series of models investigating the effects of obliquity, land/ocean coverage, and rotation on Earth-like planets, “but that these planets also might maintain seasonally and regionally habitable conditions over a larger range of orbital radii than more Earth-like planets.” And the real surprise? “Our results provide indications that the modeled climates are somewhat less prone to dynamical snowball transitions at high obliquity.” In other words, an exo-Earth tilted nearly right over (much like Uranus) may be less likely to suffer snowball Earth events than our, Goldilocks, Earth!

Ultraviolet view of the Sun. Image credit: SOHO

Consider ultra-violet radiation.

“Ultraviolet radiation is a double-edged sword to life. If it is too strong, the terrestrial biological systems will be damaged. And if it is too weak, the synthesis of many biochemical compounds cannot go along,” says Jianpo Guo of China’s Yunnan Observatory** “For the host stars with effective temperatures lower than 4,600 K, the ultraviolet habitable zones are closer than the habitable zones. For the host stars with effective temperatures higher than 7,137 K, the ultraviolet habitable zones are farther than the habitable zones.” This result doesn’t change what we already knew about habitability zones around main sequence stars, but it effectively rules out the possibility of life on planets around post-red giant stars (assuming any could survive their homesun going red giant!)

(Credit: NASA)

Consider the effects of clouds.

Calculations of the habitability zones – the radii of the orbits of an exo-Earth, around its homesun – for main sequence stars usually assume an astronomers’ heaven – permanent clear skies (i.e. no clouds). But Earth has clouds, and clouds most definitely have an effect on average global temperatures! “The albedo effect is only weakly dependent on the incident stellar spectra because the optical properties (especially the scattering albedo) remain almost constant in the wavelength range of the maximum of the incident stellar radiation,” a German team’s recent study*** on the effects of clouds on habitability concludes (they looked at main sequence homesuns of spectral classes F, G, K, and M). This sounds like Gaia is Goldilocks’ friend; however, “The greenhouse effect of the high-level cloud on the other hand depends on the temperatures of the lower atmosphere, which in turn are an indirect consequence of the different types of central stars,” the team concludes (remember that an exo-Earth’s global temperature depends upon both the albedo and greenhouse effects). So, the take-home message? “Planets with Earth-like clouds in their atmospheres can be located closer to the central star or farther away compared to planets with clear sky atmospheres. The change in distance depends on the type of cloud. In general, low-level clouds result in a decrease of distance because of their albedo effect, while the high-level clouds lead to an increase in distance.”

“Just right” is tricky to pin down.

* lead author; Princeton University’s Kristen Manou and Colombia University’s Caleb Scharf are the co-authors (“Habitable Climates: The Influence of Obliquity”, The Astrophysical Journal, Volume 691, Issue 1, pp. 596-610 (2009); arXiv:0807.4180 is the preprint)
** lead author; Fenghui Zhang, Xianfei Zhang, and Zhanwen Han, all also at the Yunnan Observatory, are the co-authors (“Habitable zones and UV habitable zones around host stars”, Astrophysics and Space Science, Volume 325, Number 1, pp. 25-30 (2010))
*** “Clouds in the atmospheres of extrasolar planets. I. Climatic effects of multi-layered clouds for Earth-like planets and implications for habitable zones”, Kitzmann et al., accepted for publication in Astronomy & Astrophysics (2010); arXiv:1002.2927 is the preprint.

Radio Waves

The Parkes Radio Antenna. Credit: R. Hollow, CSIRO

[/caption]
Radio waves are electromagnetic waves, or electromagnetic radiation, with wavelengths of about a centimeter or longer (the boundary is rather fuzzy; microwaves and terahertz radiation are sometimes considered to be radio waves; these have wavelengths as short as a tenth of a millimeter or so). In other words, radio waves are electromagnetic radiation at the lowest energy end of the electromagnetic spectrum.

Radio waves were predicted two decades or so before they were generated and detected; in fact, the historical story is one of the great triumphs of modern science.

Many years – centuries even – of work on electrical and magnetic phenomena, by many scientists, culminated in the work of James Clerk Maxwell. In 1865 he published a set of equations which describe everything known about electricity and magnetism (electromagnetism) up till that time (the next major advance was the work of Planck and Einstein – among others – some four decades or so later, involving the discovery of photons, or quantized electromagnetic radiation). Maxwell’s equations, as they are now called, predicted that there should be a kind of wave of interacting electrical and magnetic fields, which is self-propagating, and which travels at the speed of light.

In 1887, Heinrich Hertz created radio waves in his lab, and detected them after they’d travelled a short distance … exactly as Maxwell had predicted! It wasn’t long before practical applications of this discovery were developed, leading to satellite TV, cell phones, GPS, radar, wireless home networks, and much, much, more.

For Universe Today readers, the discovery of radio waves lead to radio astronomy. Interestingly, theory again preceded observation … several scientists – Planck among them – predicted that the Sun should emit radio waves (be a source of radio waves), but the Sun’s radio emission was not detected until 1942 (by Hey, in England), nearly a decade after celestial radio waves were detected and studied, by Jansky (and Reber, among others).

Here are some other webpages, or websites, with more on radio waves: Radio Waves (NASA), How Radio Waves Are Produced (National Radio Astronomy Observatory), and Radio Waves & Electromagnetic Fields (an interactive simulation from the University of Colorado).

Universe Today stories on radio waves? Sure! Device Makes Radio Waves Travel Faster Than Light, Magnetar Crackles with Radio Waves, and All-Sky Radio Image in 60 Seconds, No Moving Parts. And that’s just a sample.

Astronomy Cast episodes covering radio waves? Sure! Radio Astronomy, and Across the Electromagnetic Spectrum are two particularly good ones.

Sources:
Wikipedia
NASA
NRAO

Report: Two Objects Crash to Ground in Mongolia

One of the objects that crashed in Mongolia. Image: MUFON

Two objects reportedly crashed to the ground near Ulan Bator, the capital of Mongolia on Feb. 19, 2010. The first object, according to the report on the Mutual UFO Network (MUFON) witness database, weighed 10 kg, while the second larger object weighed approximately 2 tons. Other than that, there’s not a lot of information available about the objects. But of course, UFOers are having a field day, calling the image, above, that accompanied the report a “leaked UFO crash” picture. But the object looks suspiciously like a rocket or jet engine, or perhaps a rocket nose cone. Objects that crash to Earth likely have a very terrestrial origin. We’ll provide an update when any news becomes available. But if you are looking for a few laughs, check out the comments on Io9.

Where In The Universe Challenge #93

Its time for another “Where In The Universe” challenge, and this one is actually on time this week! The WITU challenge will test your visual knowledge of the cosmos, and this week’s image was submitted by UT reader Rob Bowman. Rob is hoping to stump everyone this week, but try to guess/name where in the Universe this image is from, and give yourself extra points if you can name the spacecraft responsible for the image. Make your guess and post a comment, but please no links or extension explanations to the answer. Check back sometime on Thursday to find the answer and see how you did. Good luck!

UPDATE: The answer is now posted below.

This is a composite image of part of Jupiter’s moon, Europa, which shows the distribution of ice and minerals for the structure named Tyre. The image was created with data from the Galileo spacecraft’s Solid State Imaging (SSI) camera and the Near Infrared Mapping Spectrometer (NIMS). Tyre, the circular feature, is 140 kilometers in diameter (about the size of the island of Hawaii) and is thought to be the site where an asteroid or comet impacted Europa’s ice crust.

Lots of correct answers! Great job everyone, and thanks again to Rob Bowman for submitting the image. Check back next week for another WITU challenge.

New Citizen Science Opportunity: Solar Storm Watch

A coronal mass ejection. Credit: Solar Storm Watch

[/caption]

Sun-worshiper alert! Now you can have the chance to help scientists spot and track solar storms and be involved in the latest solar research. The ‘hottest’ new Citizen Science project from the “Zooniverse” is Solar Storm Watch. Volunteers can spot storms and track their progress as they hurtle across space towards our planet. Your “clicks” and input will help solar scientists better understand these potentially dangerous storms and help to forecast their arrival time at Earth. “The more people looking at our data, the more discoveries we will make,” said Dr. Chris Davis, Project Scientist with the STEREO mission. “We encourage everyone to track these spectacular storms through space. These storms are a potential radiation hazard for spacecraft and astronauts alike and together we hope to provide advanced warning of their arrival at Earth.”

Solar Storm Watch has been in Beta testing for about two months, but is now officially open for business. “It’s been wonderful to watch the team get ready for a flood of data,” said Chris Lintott, one of the founders of the original Galaxy Zoo, and now Zooniverse — new citizen science projects that that use the Galaxy Zoo model — of which Solar Storm Watch is a part. ” I’m sure there are discoveries there already.”

“I’ve been sitting at my desk watching the results roll in and there are plenty of CMEs that just need a few more clicks,” said Arfon Smith from Oxford University, one of the developers of Zooniverse, who has helped solar astronomers at the Royal Observatory in Greenwich integrate their science projects into the Galaxy Zoo model.

STEREO spacecraft. Credit: NASA

The project uses real data from NASA’s STEREO spacecraft, a pair of satellites in orbit around the Sun which give scientists a constant eye on the ever-changing solar surface. STEREO’s two wide-field instruments, the Heliospheric Imagers provide Solar Stormwatch with its data. Each imager has two cameras helping STEREO stare across the 150 million kilometers from the Earth to the Sun.

“The Solar Stormwatch website has a game-like feel without losing any of the science,” said Julia Wilkinson, Solar Stormwatch volunteer. “I can click away identifying features and watch solar storms head towards Earth on the video clips and learn about solar science at the same time. It’s fun, it’s addictive, it’s educational and you get to contribute to real astronomy research without being an expert in astrophysics … The fact that any Solar Stormwatch volunteer could make a brand new discovery about our neighboring star is very cool indeed. All you need is a computer and an interest in finding out more about what the sun is really like. Solar astronomy has never been easier!”

Solar Storm Watch has made their project very interactive with social media, as you can share your discoveries on the user forum and Flickr, as well as follow the space weather forecast on Twitter. SSW also has a blog to shre the latest news and challenges.

To participate, go to the Solar Storm Watch website. You can get a “Mission Briefing”, or watch informative videos on why the solar science community needs you!

Sources: Royal Observatory, Zooniverse

Elements of the Universe Shown in New Image

New image of NGC 346, the Small Magellanic Cloud. Credit: ESO

[/caption]

It’s not Earth, Wind and Fire*, but light, wind and fire in this dramatic new image of the Small Magellanic Cloud (NGC 346) that will make you want to Keep Your Head to the Sky**. The light, wind and heat given off by massive, Mighty Mighty ** Shinging Star(s)** have dispersed the glowing gas within and around this star cluster, forming a surrounding wispy nebular structure that looks like a cobweb. As yet more stars form from lose matter in the area, they will ignite, scattering leftover dust and gas, carving out great ripples and altering the face of this lustrous object. But, That’s the Way of the World** in this open cluster of stars, that we just Can’t Hide Love** for.

You’ll really get a Happy Feelin’** by looking at the zoomable image of the Small Magellanic Cloud, or see below for a video zooming into the region.

The nebula containing this clutch of bright stars can really Sparkle **. It is known as an emission nebula, meaning that gas within it has been heated up by stars until the gas emits its own light, just like the neon gas used in electric store signs.

This image was taken with the Wide Field Imager (WFI) instrument at the MPG/ESO 2.2-metre telescope at the La Silla Observatory in Chile. Images like this help astronomers Turn It Into Something Good** by helping to chronicle star birth and evolution, while offering glimpses of how stellar development influences the appearance of the cosmic environment over time.

If you want more information about this image, you can Let Your Feelings Show** by visiting the ESO website.

*The band Earth, Wind and Fire is sometimes known as Elements of the Universe
** indicates song titles recorded by Earth, Wind and Fire