How Old Am I? Star Cluster Perplexes Astronomers

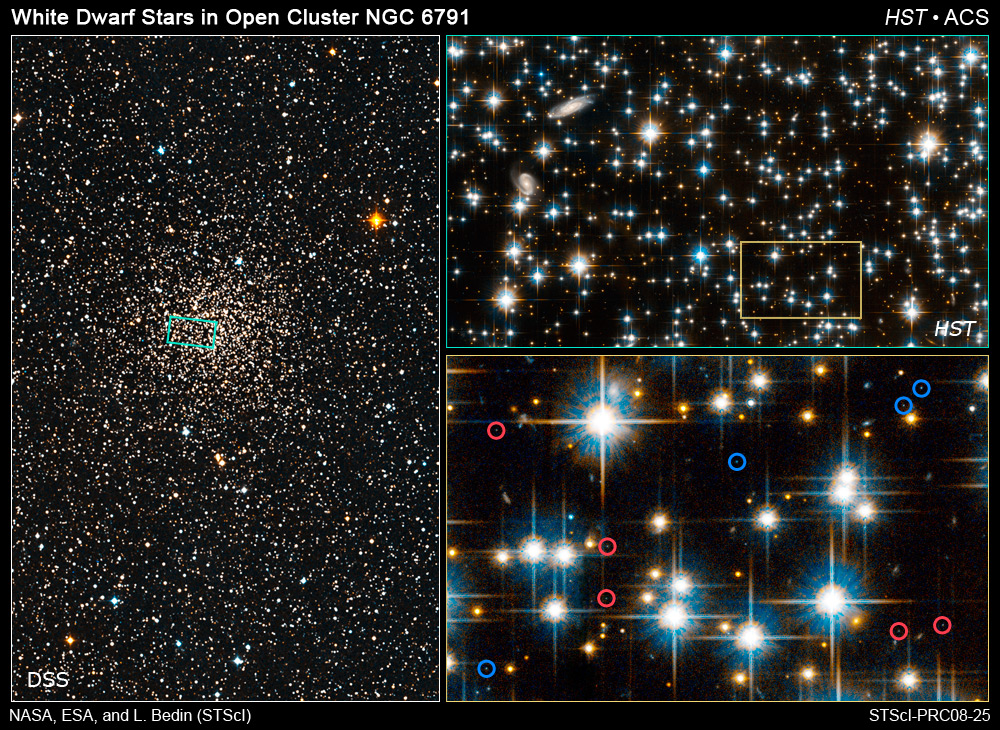
Ever have one of those moments when you can’t remember how old you are? A group of astronomers may have felt they were having a “senior moment” when they couldn’t seem to figure out exactly the age of stars in the open star cluster NGC 6791, located in the constellation Lyra. Conventional thinking among astronomers is that stars in open clusters form at the same time, but in this particular cluster, researchers found stars at three different ages: one group of white dwarf stars appeared to be 4 billion years old, a second group of white dwarfs seemed to 6 billion years old, while the other regular stars were calculated to be 8 billion years of age. The astronomers say this dilemma may fundamentally challenge the way astronomers estimate cluster ages. Ivan King of the University of Washington and leader of the group using the Hubble Space Telescope to study this star cluster said: “This finding means that there is something about white dwarf evolution that we don’t understand.”

I just love it when astronomers say something like that, because it means they’ll return to their telescopes and the data in order to figure out the dilemma, and we’ll learn something new. And that’s just what they did. At least, partially.

“The age discrepancy is a problem because stars in an open cluster should be the same age. They form at the same time within a large cloud of interstellar dust and gas. So we were really puzzled about what was going on,” explained astronomer Luigi Bedin, who works at the Space Telescope Science Institute in Baltimore, Md.

After extensive analysis, members of the research team realized how the two groups of white dwarfs can look different and yet have the same age. It is possible that the younger- looking group consists of the same type of stars, but the stars are paired off in binary-star systems, where two stars orbit each other. Because of the cluster’s great distance, astronomers see the paired stars as a brighter single star.

Their brightness made them look younger.

Binary systems are also a significant fraction of the normal stellar population in NGC 6791, which contains over 10,000 stars, and are also observed in many other clusters. However, this would be the first time they have been found in a white-dwarf population.

“Our demonstration that binaries are the cause of the anomaly is an elegant resolution of a seemingly inexplicable enigma,” said team member Giampaolo Piotto the University of Padova in Italy.

Bedin and his colleagues are relieved that they now have only two ages to reconcile: an 8- billion-year age of the normal stellar population and a 6-billion-year age for the white dwarfs. All they need now is a process that slows down white-dwarf evolution.

Hubble’s Advanced Camera for Surveys analyzed the cooling rate of the entire population of white dwarfs in NGC 6791, from brightest to dimmest. White dwarfs are the smoldering embers of Sun-like stars that no longer generate nuclear energy and have burned out. Their hot remaining cores radiate heat for billions of years as they slowly fade into darkness. Astronomers have used white dwarfs as a reliable measure of the ages of star clusters, because they are the relics of the first cluster stars that exhausted their nuclear fuel.

White dwarfs have long been considered dependable because they cool down at a predictable rate. The older the dwarf, the cooler it is, making it a seemingly perfect clock that has been ticking for almost as long as the cluster has existed.

All right, astronomers, back to your telescopes to get this all figured out! And when they do, the rest of you can read about it on Universe Today. In the meantime, enjoy the lovely images above of star cluster NGC 6791.

News Source: Hubble press release

Let’s Study Law: Kepler Would Be So Proud!

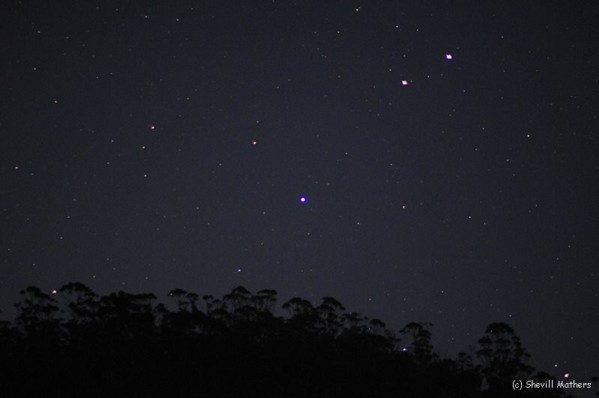
Mars and Saturn Meet - Shevill Mathers

Just a couple of days ago we took a look at the splendid conjunction of Mars, Saturn and Regulus which occurred on July 6, 2008. Now, four days later, the position of everything has changed drastically. We watch it occur in the sky. We accept that it’s natural. We even know it’s celestial mechanics! But exactly what laws govern these movements and how do we understand them? Let’s take a look…

Johannes KeplerOnce upon a time, a very cool dude named Johannes Kepler was born just two days after Christmas in 1571. Like most of us, he had a pretty rough life. His dad died when he was 5, but he had a great mom who was not only a waitress, but a herbalist as well. One of the best things she ever did for her son was to take him out to watch the “Great Comet of 1577” and a lunar eclipse in 1580. Even though she ended up being later tried for witchcraft, the love of astronomy that she inspired in her son would shape the way we now understand planetary motion.

Even though smallpox crippled Kepler’s vision and hands, he excelled at studying planetary motion in the astrological sense and kept himself busy being a math teacher. In his spare time, he also liked to play around with lenses, too… and write letters to his friend Galileo Galilei. Even though he ran the risk of losing his job and getting in trouble with the church, Kepler defended Copernican theory of a sun-centered system and went on to devise some formulae of his own. At age 24, he was teaching a class about the conjunction of Saturn and Jupiter when he realized that regular polygons bound one inscribed and one circumscribed circle at definite ratios, which, he reasoned, might be the geometrical basis of the universe. Thankfully, his school supported him and published his work as the “Mysterium Cosmographicum” (The Cosmographic Mystery).

Fortunately, that was a good move and it landed Kepler a part time job helping out an astronomer named Tycho Brahe. To make a long story short, that was his introduction into the real world of astronomy and many long years and bad political times kept things from progressing. However, the astronomers of the time respected his work in their own ways and continued to test out Kepler’s theories – right down to his predictions when Venus and Mercury would transit the Sun. Yep. It would be long after Kepler died before his ideas were finally recognized, but these three principles withstood the test of time:

Kepler's Laws

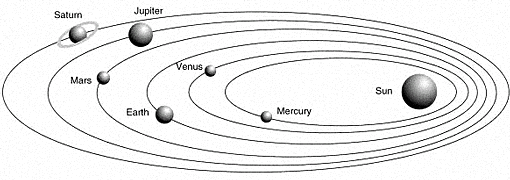
1. The orbit of every planet is an ellipse with the sun at one of the foci.

2. A line joining a planet and the sun sweeps out equal areas during equal intervals of time. (Suppose a planet takes one day to travel from point A to B. The lines from the Sun to A and B, together with the planet orbit, will define a (roughly triangular) area. This same amount of area will be formed every day regardless of where in its orbit the planet is. This means that the planet moves faster when it is closer to the Sun.) This is because the sun’s gravity accelerates the planet as it falls toward the Sun, and decelerates it on the way back out, but Kepler did not know that reason.

3. The squares of the orbital periods of planets are directly proportional to the cubes of the semi-major axis of the orbits. Thus, not only does the length of the orbit increase with distance, the orbital speed decreases, so that the increase of the orbital period is more than proportional.

So what does studying these laws have to do with what we see? Let’s take a three day time lapse look…

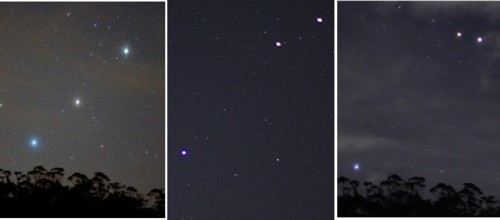
Planetary Motion - July7-9, 2008 - Shevill Mathers

The observable distance between Saturn and Regulus hasn’t changed much has it? But the motion of Mars has been huge! When skies permit, make your own nightly observations of planetary motions and try studying Kepler’s law. We’ve watched Mars travel from points A to B. If we drew an imaginary line, from the Sun to the planet, it would sweep out a roughly triangular area and the same amount of area will be swept every day. As Mars progresses in its elliptical orbit, its distance from the Sun changes. As an equal area is swept during any period of time and the distance from Mars to the Sun varies, we can then plainly see that for the changes to remain constant that Mars must also vary in speed! Yep. It’s the second law.

Kepler would be so proud…

Many thanks to AORAIA member Shevill Mathers whose dedication and photographs helped make this article possible!

Particle Physicists Discover Lowest Energy “Bottomonium” Particle

During particle collisions, hadrons split into quarks and bosons (University of Oregon)

Particle physicists working with the BaBar detector at Stanford Linear Accelerator Center have discovered a new particle in the bottomonium family of “quarkonium” particles. Technically it isn’t a “new particle” it is a previously unobserved state of particle, but when we are talking about subatomic particles, their energy states become a big deal (and their names get very cool). We are in the realms of the vanishingly small and the discovery of the lowest energy bottomonium particle may not seem very significant. But in the world of quantum chromodynamics, this completes the long quest to find experimental evidence for this elusive meson and may help explain why there is more matter than anti-matter in the Universe…

Quarkonia are types of mesons containing two quarks: one quark and its anti-quark (they are therefore “colourless”). They belong to one of two families: “bottomonium” or “charmonium”. As the names suggest, bottomonium contains a bottom quark and anti-bottom quark; charmonium contains a charm quark and anti-charm quark. Groups of three quarks (interacting via the strong force) are baryons (i.e. protons and neutrons) whereas groups of two quarks are mesons. Mesons are all thought to be made from a quark-antiquark pair and are therefore of huge importance when studying why there is more matter than anti-matter in the Universe.

This is where the BaBar detector at the Stanford Linear Accelerator Center (SLAC), CA, comes in. The BaBar international collaboration investigates the behaviour of particles and anti-particles during the production of the bottomonium meson (bottom-antibottom quark pairs) in the aim of explaining why there is an absence of anti-particles in everyday life.

For each particle of matter there exists an equivalent particle with opposite quantum characteristics, called an anti-particle. Particle and anti-particle pairs can be created by large accumulations of energy and, conversely, when a particle meets an anti-particle they annihilate with intense blasts of energy. At the time of the big-bang, the large accumulation of energy must have created an equal amount of particles and anti-particles. But in everyday life we do not encounter anti-particles. The question, therefore, is “What has happened to the anti-particles?” – From the BaBar/SLAC collaboration pages.

All matter has a “ground state”, or the lowest energy the system is trying to attain. As particles for instance try to reach this ground state, they lose energy, often in the form of electromagnetic radiation. Once reached, the ground state determines the baseline at which measurements can be made for higher energy states of those particles. And this is what the BaBar team has done, they have been able to isolate the lowest possible energy state for the bottomonium particle (which is far from easy). So what have they named the ground state of bottomonium? Quite simply: ηb, pronounced “eta-sub-b“.

The bottomonium particle was generated during a collision between an electron and positron. The energy generated by this collision created a bottom quark and an anti-bottom quark bound together. At this point, the bottomonium particle was of too high an energy, but it very quickly decayed, emitting a gamma ray leaving the ηb behind. However, ηb’s are highly unstable and will quickly decay into other particles, plus they are very rare and difficult to detect. This particular decay event only occurs once in every two or three thousand higher energy bottomonium decays, so many collisions had to be measured and a huge amount of data had to be gathered by the BaBar detector before a precise measurement of the ηb ground state could be gained.

This very significant observation was made possible by the tremendous luminosity of the PEP-II accelerator and the great precision of the BaBar detector, which was so well calibrated over the BaBar experiment’s 8-plus years of operation. These results were highly sought after for over 30 years and will have an important impact on our understanding of the strong interactions.” – Hassan Jawahery, BaBar Spokesperson, University of Maryland.

If you want to find out more, you can check out the BaBar team’s publication (with the longest list of co-authors I’ve ever seen!) or the SLAC press release.

Source: SLAC

Large Hadron Collider Could Generate Dark Matter

A simulation of a LHC collision (CERN)

One of the biggest questions that occupy particle physicists and cosmologists alike is: what is dark matter? We know that a tiny fraction of the mass of the universe is the visible stuff we can see, but 23% of the Universe is made from stuff that we cannot see. The remaining mass is held in something called dark energy. But going back to the dark matter question, cosmologists believe their observations indicate the presence of darkmatter, and particle physicists believe the bulk of this matter could be held in quantum particles. This trail leads to the Large Hadron Collider (LHC) where the very small meets the very big, hopefully explaining what particles could be generated after harnessing the huge energies possible with the LHC…

The excitement is growing for the grand switch-on of the LHC later this summer. We’ve been following all the news releases, research possibilities and some of the more “out there” theories as to what the LHC is likely to discover, but my favourite bits of LHC news include the possibility of peering into other dimensions, creating wormholes, generating “unparticles” and micro-black holes. These articles are pretty extreme possibilities for the LHC, I suspect the daily running of the huge particle accelerator will be a little more mundane (although “mundane” in accelerator physics will still be pretty damn exciting!).

David Toback, professor at Texas A&M University in College Station, is very optimistic as to what discoveries the LHC will uncover. Toback and his team have written a model that uses data from the LHC to predict the quantity of dark matter left over after the Big Bang. After all, the collisions inside the LHC will momentarily recreate some of the conditions at the time of the birth of our Universe. If the Universe created dark matter over 14 billion years ago, then perhaps the LHC can do the same.

Should Toback’s team be correct in that the LHC can create dark matter, there will be valuable implications for both particle physics and cosmology. What’s more, quantum physicists will be a step closer to proving the validity of the supersymmetry model.

If our results are correct we now know much better where to look for this dark matter particle at the LHC. We’ve used precision data from astronomy to calculate what it would look like at the LHC, and how quickly we should be able to discover and measure it. If we get the same answer, that would give us enormous confidence that the supersymmetry model is correct. If nature shows this, it would be remarkable.” – David Toback

So the hunt is on for dark matter production in the LHC… but what will we be looking for? After all dark matter is predicted to be non-interacting and, well, dark. The supersymmetry model predicts a possible dark matter particle called the neutralino. It is supposed to be a heavy, stable particle and should there be a way of detecting it, there could be the opportunity for Toback’s group to probe the nature of the neutralino not only in the detection chamber of the LHC, but the nature of the neutralino in the Universe.

If this works out, we could do real, honest to goodness cosmology at the LHC. And we’d be able to use cosmology to make particle physics predictions.” – Toback

Source: Physorg.com

One More Item Found in Astounding HiRise Image of Phoenix Descending

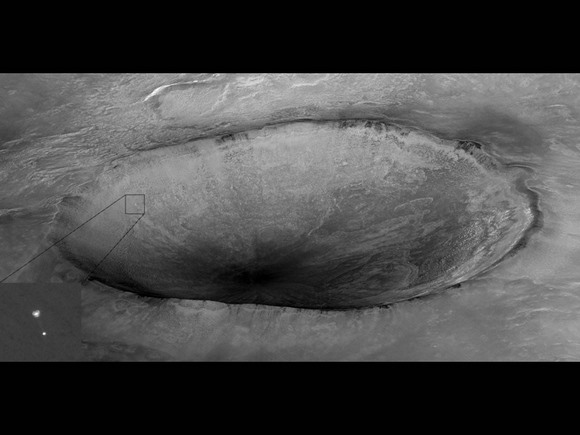
Remember the amazing image that the HiRISE Camera on the Mars Reconnaissance Orbiter captured of the Phoenix Lander as it descended to Mars’ surface via parachute back on May 25? Well, the HiRISE scientists have done a little more processing of the image, and have turned up an additional detail they didn’t see at first: Phoenix’s heat shield. The heat shield, which had been jettisons just after parachute deployment, can be seen falling toward the surface. You have to look really, really close to see it. But that’s what these HiRISE folks do. It was incredible that they found the lander with the parachute in the image (go see the big, huge image they had to hunt for it HERE) and these guys get the eagle eyes of the year award for finding the heat shield.

HiRISE made history by taking the first image of a spacecraft as it descended toward the surface of another planetary body. Here’s the image again:

The image shows NASA’s Phoenix Mars Lander when the spacecraft was still tucked inside its aeroshell, suspended from its parachute, at 4:36 p.m. Pacific Daylight Time on landing day. Although Phoenix appears to be descending into an impressive impact crater, it actually landed 20 kilometers, or 12 miles, away.

Mars Reconnaissance Orbiter was about 760 kilometers, or 475 miles, away when it pointed the HiRISE camera obliquely toward the descending Phoenix lander. The camera viewed through the hazy Martian atmosphere at an angle 26 degrees above the horizon when it took the image. The 10-meter, or 30-foot, wide parachute was fully inflated. Even the lines connecting the parachute and aeroshell are visible, appearing bright against the darker, but fully illuminated Martian surface.

In further analyzing the image, the HiRISE team discovered a small, dark dot located below the lander.
Phoenix was equipped with a heat shield that protected the lander from burning up when it entered Mars’ atmosphere and quickly decelerated because of friction. Phoenix discarded its heat shield after it deployed its parachute.

“Given the timing of the image and of the release of the heat shield, as well as the size and the darkness of the spot compared to any other dark spot in the vicinity, we conclude that HiRISE also captured Phoenix’s heat shield in freefall,” said HiRISE principal investigator Alfred McEwen.

The multigigabyte HiRISE image also includes a portion recorded by red, blue-green and infrared detectors, and scientists have processed that color part of the image.

HiRISE’s color bands missed the Phoenix spacecraft but do show frost or ice in the bowl of the relatively recent, 10-kilometer (6-mile) wide impact crater unofficially called “Heimdall.” The frost shows up as blue in the false-color HiRISE data, and is visible on the right wall within the crater.

The HiRISE camera doesn’t distinguish between carbon dioxide frost and water frost, but another instrument called CRISM on the Mars Reconnaissance Orbiter could.

News Source: SpaceRef

The Sunny Side of Asteroids

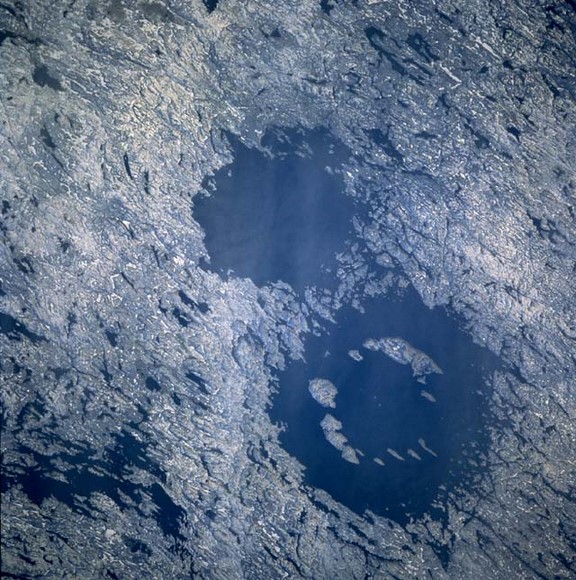
Asteroids with moons, called binary asteroids, are fairly common in the solar system. But scientists haven’t been able to figure out the dynamics of these asteroids, especially how the moons form. But a group of astronomers studying binary asteroids say the surprising answer is sunlight, which can increase or decrease the spin rate of an asteroid. The researchers also say that since there are a number of “double craters” on Earth – side-by side craters that appear to have formed at about the same time — these binary asteroids may have hit our planet in the past. The image above is of twin circular lakes in Quebec, Canada, formed by the impact of an asteroidal pair which slammed into the planet approximately 290 million years ago. Similar double craters also can be found on other planets, as well.

Derek Richardson, of the University of Maryland, and Kevin Walsh and Patrick Michel at the Cote d’Azur Observatory, France outline a model showing that when solar energy “spins up” a “rubble pile” asteroid to a sufficiently fast rate, material is slung off from around the asteroid’s equator. This process also exposes fresh material at the poles of the asteroid.

If the spun off bits of asteroid rubble shed sufficient excess motion through collisions with each other, then the material coalesces into a satellite that continues to orbit its parent.

Link to an animated model of the spin-up and binary formation from two views, on the left is an overhead view. The right pane of the movie looks at the equator of the primary body, which is also the plane in which the asteroid’s satellite is formed (courtesy of the authors of the study).

Because the team’s model closely matches observations from binary asteroids, it neatly fills in missing pieces to a solar system puzzle. And, it could have much more down-to-earth implications as well. The model gives information on the shapes and structure of near-Earth binary asteroids that could be vital should such a pair need to be deflected away from a collision course with Earth.
The authors say that their current findings also suggest that a space mission to a binary asteroid could bring back material that might shed new light on the solar system’s early history. The oldest material in an asteroid should lie underneath its surface, explained Richardson, and the process of spinning off this surface material from the primary asteroid body to form its moon, or secondary body, should uncover the deeper older material.

“Thus a mission to collect and return a sample from the primary body of such a binary asteroid could give us information about the older, more pristine material inside an asteroid,” Richardson said.

Original News Source: PhysOrg

Phoenix Relegated to Scraping the Sidewalk

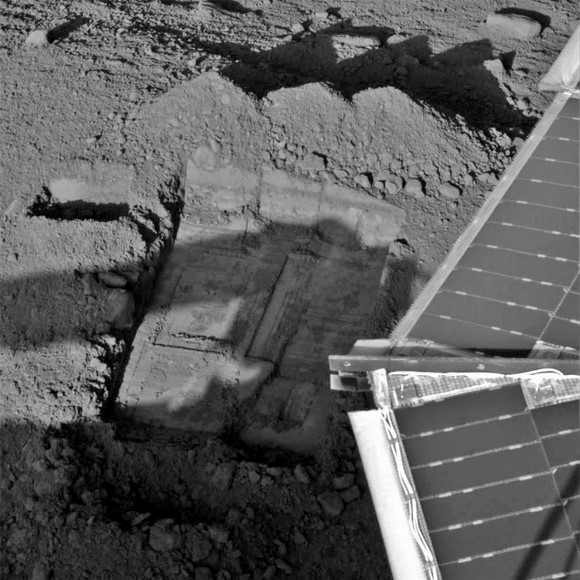
If humans ever build a city on Mars, perhaps (in its retirement) the Phoenix Lander can apply for a job with the city’s public works department to scrape ice off sidewalks. Phoenix has been trying to dig down deeper into the “Snow White” trench and has been digging, scooping and scraping the ice layer that earlier soil scooping exposed. The robotic arm team is working to get an icy sample into the Robotic Arm scoop for delivery to the Thermal and Evolved Gas Analyzer (TEGA). Ray Arvidson of the Phoenix team, known as the “dig czar,” said the hard Martian surface that Phoenix has reached is proving to be a difficult target, and compared the process to scraping a sidewalk. “We have three tools on the scoop to help access ice and icy soil,” Arvidson said. “We can scoop material with the backhoe using the front titanium blade; we can scrape the surface with the tungsten carbide secondary blade on the bottom of the scoop; and we can use a high-speed rasp that comes out of a slot at the back of the scoop.”

“We expected ice and icy soil to be very strong because of the cold temperatures. It certainly looks like this is the case and we are getting ready to use the rasp to generate the fine icy soil and ice particles needed for delivery to TEGA,” he said.

Scraping action produced piles of scrapings at the bottom of a trench on Monday, but did not get the material into its scoop, evidenced from images returned to Earth by the lander. The piles of scrapings produced were smaller than previous piles dug by Phoenix, which made it difficult to collect the material into the Robotic Arm scoop.

“It’s like trying to pick up dust with a dustpan, but without a broom,” said Richard Volpe, an engineer from NASA’s Jet Propulsion Laboratory, Pasadena, Calif., on Phoenix’s Robotic Arm team.

The mission teams are now focusing on use of the motorized rasp within the Robotic Arm scoop to access the hard icy soil and ice deposits. They are conducting tests on Phoenix’s engineering model in the Payload Interoperability Testbed in Tucson to determine the optimum ways to rasp the hard surfaces and acquire the particulate material produced during the rasping. The testbed work and tests on Mars will help the team determine the best way to collect a sample of Martian ice for delivery to TEGA.

The Phoenix team also continues to analyze results from the Wet Chemistry Lab, as a sample was delivered to the lab on July 6. Results should be forthcoming.

News Source: Phoenix News

Where In The Universe Challenge #11

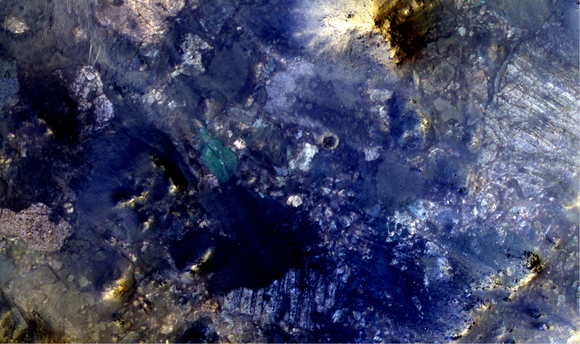
Blue is my favorite color. Especially the shade of blue in the image for this week’s “Where In The Universe” challenge. It’s just such an uplifting color. But back to the challenge. The goal of this challenge is to test your skills and knowledge of our solar system. Guess where this image is from, and give yourself extra points if you can guess which spacecraft is responsible for the image. As always, don’t peek below before you make your guess. Comments on how you did are welcome.

Ready? Go!

This image was taken by the HiRISE Camera on the Mars Reconnaissance Orbiter. It shows the central uplift within an impact crater to the west of Nili Fossae on Mars. Planetary scientists love to see central uplifts, because they provide rare views of the rock types that exist miles beneath the modern-day surface of Mars. The impact process has shuffled different rock types into a disorganized array known as impact breccia.

This is an enhanced color image, to help discern between the different types of rock. Some of the materials that appear dark blue are probably patches of sand overlying the lighter-toned breccia.

Central uplifts are features that form on the floor of an impact crater shortly after the impact occurs. The crater’s central floor rebounds upward, forming a ring of hills and raising deeply buried rocks up to Martian surface. Infrared spectrometers such as THEMIS and CRISM have found that some of the rocks in this crater’s central uplift contain minerals that are intriguing and atypical for Mars, such as quartz, clays, and other water-bearing silicate minerals.

This image is just part of a larger swath taken by HiRISE. This portion of the image shows some of the central uplift rocks in fine detail. Blocks measuring from a few meters to over a hundred meters (10 to over 300 feet) across have coloration differences, suggesting that their compositions are different. Some of the largest blocks are internally layered, implying that they are blocks of sedimentary rock.

How did you do?

More about this image and to download a larger version in all its glory

Wind Power From the Ocean (With Help from Space)

I drive regularly through Iowa and southern Minnesota in the US, and over the past few years wind farms have been popping up in that region up almost faster than corn grows. These massive wind turbines are awesome to see. But there may be an even better location for future wind farms than the breezy plains of the central United States: our oceans. Experts say ocean winds blow harder and with more reliable consistency than wind on land, which more than offsets the greater cost of building windmills offshore. Efforts to harness the energy potential of Earth’s ocean winds could soon gain an important new tool: global satellite maps from NASA. Scientists have been creating maps using nearly a decade of data from NASA’s QuikSCAT satellite that reveal ocean areas where winds could produce wind energy.

“Wind energy is environmentally friendly. After the initial energy investment to build and install wind turbines, you don’t burn fossil fuels that emit carbon,” said study lead author Tim Liu, a senior research scientist and QuikSCAT science team leader at NASA’s Jet Propulsion Laboratory in Pasadena, Calif. “Like solar power, wind energy is green energy.”

The new maps created by QuickSCAT have many potential uses including planning the location of offshore wind farms to convert wind energy into electric energy. Ocean wind farms have less environmental impact than onshore wind farms, whose noise tends to disturb sensitive wildlife in their immediate area.

QuikSCAT, launched in 1999, tracks the speed, direction and power of winds near the ocean surface. Data from QuikSCAT, collected continuously by a specialized microwave radar instrument named SeaWinds, also are used to predict storms and enhance the accuracy of weather forecasts.

Wind energy has the potential to provide 10 to 15 percent of future world energy requirements, according to Paul Dimotakis, chief technologist at JPL. If ocean areas with high winds were tapped for wind energy, they could potentially generate 500 to 800 watts of energy per square meter, according to Liu’s research. Dimotakis notes that while this is slightly less than solar energy (which generates about one kilowatt of energy per square meter), wind power can be converted to electricity more efficiently than solar energy and at a lower cost per watt of electricity produced.

The new QuikSCAT maps, which add to previous generations of QuikSCAT wind atlases, also will be beneficial to the shipping industry by highlighting areas of the ocean where high winds could be hazardous to ships, allowing them to steer clear of these areas.

Scientists use the QuikSCAT data to examine how ocean winds affect weather and climate, by driving ocean currents, mixing ocean waters, and affecting the carbon, heat and water interaction between the ocean and the atmosphere.

News Source: NASA

Sun-like Stars May Have Low Probability of Forming Planets

This protoplanetary disk in the Orion Nebula has a mass more than one hundredth that of the sun, the minimum needed to form a Jupiter-sized planet. Image credit: Bally et al 2000/Hubble Space Telescope & Eisner et al 2008/CARMA, SMA)

The Orion Nebula shines brilliantly, as it is packed with over 1,000 young stars in a region just a few light-years wide. With all those stars, there’s probably the potential for thousands of planets to one day form from the dust and gas surrounding these stars, right? Actually, according to a new study, fewer than 10 percent of stars in the Orion Nebula have enough surrounding dust to make a planet the size of Jupiter. And that doesn’t bode well for the planet-forming abilities of most stars, at least in forming planets the size of Jupiter or larger. “We think that most stars in the galaxy are formed in dense, Orion-like regions, so this implies that systems like ours may be the exception rather than the rule,” said Joshua Eisner lead author of the study from the University of California Berkeley. This finding is also consistent with the results of current planet searches, which are finding that only about 6 percent of stars surveyed have planets the size of Jupiter or larger.

In the observations of Orion’s central region of more than 250 known stars, the findings showed that only about 10 percent emit the wavelength radiation typically emitted by a warm disk of dust, (1.3-millimeter). Even fewer – less than 8 percent of stars surveyed – were found to have dust disks with masses greater than one-hundredth the mass of the sun, which is thought to be the lower mass limit for the formation of Jupiter-sized planets. The average mass of a protoplanetary disk in the region was only one-thousandth of a solar mass, the researchers calculated.

The study was done using the Combined Array for Research in Millimeter Astronomy (CARMA) in California, and the Submillimeter Array (SMA) atop Mauna Kea in Hawaii. Both facilities observe at millimeter wavelengths, which is ideal for piercing the clouds of dust and gas surrounding young stars to see their dense, dusty disks.

Four billion years ago our own sun may have been in a dense, open cluster like Orion. Because open clusters like Orion eventually become gravitationally unbound, they disperse over the course of billions of years, and as a result, the sun’s birth neighbors are long gone.

Eisner said studying star clusters like the Orion Nebula Cluster “helps our understanding of the typical mode of star and planet formation.”

However, another survey of the Taurus cluster, which is a lower-density star-forming region showed that more than 20 percent of its stars have enough mass to form planets. The difference is probably related to the tightly packed, hot stars of the Orion cluster, said John Carpenter, colleague of Eisner’s in the study.

“Somehow, the Orion cluster environment is not conducive to forming high mass disks or having them survive long, presumably due to the ionization field from the hot, massive OB stars , which you might expect would photoevaporate dust and lead to small disk masses,” he said.

News Source: UC Berkley