Liquid Lake on Titan Confirmed

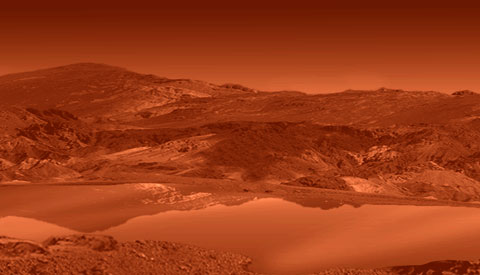
Artist's concept of the liquid lake on Titan. Credit: NASA/JPL

[/caption]

NASA’s Cassini mission has detected liquid hydrocarbons on Saturn’s moon Titan, in a large, glassy lake near the moon’s south pole. Before the Cassini mission began, scientists thought Titan would have global oceans of methane, ethane and other light hydrocarbons. But after more than 40 close flybys of Titan by Cassini, data showed no global oceans exist. However hundreds of dark, lake-like features are present. Until now, it was not known whether these features were liquid or simply dark, solid material. Using Cassini’s Visual and Infrared Mapping Spectrometer (VIMS), which identifies the chemical composition of objects by the way matter reflects light, a liquid ethane lake 235 kilometers (150 miles) long was detected. This makes Titan the only body in our solar system beyond Earth known to have liquid on its surface.

“This is the first observation that really pins down that Titan has a surface lake filled with liquid,” said Bob Brown of the University of Arizona, Tucson, leader of the VIMS instrument.

Scientists had deduced through earlier observations that there was likely liquid on Titan, but this is the first incontrovertible evidence. (Emily Lakdawalla at the Planetary Society explains this excellently.)

“Detection of liquid ethane confirms a long-held idea that lakes and seas filled with methane and ethane exist on Titan,” said Larry Soderblom, a Cassini interdisciplinary scientist with the U.S. Geological Survey. “The fact we could detect the ethane spectral signatures of the lake even when it was so dimly illuminated, and at a slanted viewing path through Titan’s atmosphere, raises expectations for exciting future lake discoveries by our instrument.”
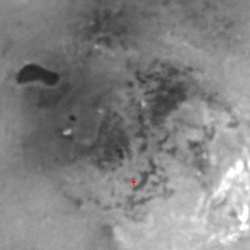
The dark area near the top is Ontario Lacus.  Credit: NASA / JPL / Space Science Institute
The dark area near the top is Ontario Lacus. Credit: NASA / JPL / Space Science Institute

Titan’s hazy, nitrogen and methane atmosphere makes it difficult to study the moon’s surface. The liquid ethane was identified using a technique that removed the interference from the atmospheric hydrocarbons.

The VIMS instrument observed a lake, called Ontario Lacus, in Titan’s south polar region during a close Cassini flyby in December 2007. The lake is roughly 20,000 square miles (7,800 square miles) in area, slightly larger than North America’s Lake Ontario.

The ethane is in a liquid solution with methane, other hydrocarbons and nitrogen. At Titan’s surface temperatures, approximately 300 degrees Fahrenheit below zero, these substances can exist as both liquid and gas. Titan shows overwhelming evidence of evaporation, rain, and fluid-carved channels draining into what, in this case, is a liquid hydrocarbon lake.

Earth has a hydrological cycle based on water and Titan has a cycle based on methane. Scientists ruled out the presence of water ice, ammonia, ammonia hydrate and carbon dioxide in Ontario Lacus. The observations also suggest the lake is evaporating. It is ringed by a dark beach, where the black lake merges with the bright shoreline. Cassini also observed a shelf and beach being exposed as the lake evaporates.

“During the next few years, the vast array of lakes and seas on Titan’s north pole mapped with Cassini’s radar instrument will emerge from polar darkness into sunlight, giving the infrared instrument rich opportunities to watch for seasonal changes of Titan’s lakes,” Soderblom said.

More information is available at NASA’s Cassini site, JPL’s Cassini site, and the Univeristy of Arizona’s VIMS site.

Glow in the Dark Solar System

Now this is a cool project. You can buy a glow in the dark Solar System kit, and put the entire Solar System on your ceiling. When you turn off the lights, the Sun and the planets glow in the dark.

There are several sets available from Amazon.com.

One kit is called Planets and Supernova, and it comes with 100 small, medium and large glow in the dark stars. It also has 9 planets for the Solar System (sshh, somebody tell them that Pluto isn’t a planet anymore).

Another set contains just the glow in the dark planets themselves. It’s pretty inexpensive, just $3.95 for the set.

And if you want a 3-dimensional version, check out this set. It’s got all the planets as well as stars. The largest planet is 4″ across.

Here’s a cool project that lets you build a Solar System model.

We have recorded a whole series of podcasts about the Solar System at Astronomy Cast. Check them out here.

Solar System Order

Planets in the Solar System. Image credit: NASA/JPL/IAU

[/caption]

If you give most people enough time to think, they can come up with the names of all of the planets. Most will still throw in Pluto, despite its demotion. What those same people will have difficulty with is the Solar System order. It can be difficult to remember which planet is where. The current Solar System order is Mercury, Venus, Earth, Mars, Jupiter, Saturn, Uranus, and Neptune.

The best thing to do is come up with a handy mnemonic. The most common one taught in school used to be My Very Educated Mother Just Served Us Nine Pizzas, then Pluto lost the prestige of planetary status. Most educators have cast about for another, just as handy mnemonic device. This one should work just fine: My Very Educated Mother Just Served Us Noodles. Of course, both devices assume that everyone knows that the Sun is at the center of our Solar System.

Here are a few details about each planet that might be of interest to you.

Mercury has a tenuous atmosphere, so, despite being the planet closest to the Sun, it is unable to retain the heat it is exposed to. The temperature ranges by a few hundred degrees Celsius each Mercurian day.

Venus has a thick atmosphere and an average surface temperature of 460 degrees Celsius. If you were standing on Venus, you would choke on the high amounts of carbon dioxide as your skin dissolved in the sulfuric acid rain.

Earth needs no introduction or details.

Mars is perhaps the most studied planet besides Earth. It has a nearly nonexistent atmosphere, so it is a cold world. Temperatures are about -140 Celsius in the winter. At the height of summer you could not comfortably wear shorts.

Jupiter is 2.5 times as massive as all of the other planets in the Solar System combined. Jupiter has 63 recognized moons, but more are thought to be in orbit. That accounts for about 1/3 of the moons in our Solar System.

Saturn is a contradiction. It is the second largest planet, yet it has a very low density. It would float if you had enough water to put it in. There are 60 acknowledged moons orbiting Saturn.

Uranus is tilted like crazy. All planets are slightly tilted on their axis, but Uranus is tilting at 98 degrees.

Neptune, is last, but not least. It orbits an average of 4.5 billion km from the Sun. It was discovered in 1846, making it the most recent recognized planet to be discovered.

And there you have the Solar System order, a way to remember it, and a few interesting facts about each planet. We encourage you to explore the NASA website to get more information.

Here’s an article from Universe Today that goes into more detail for each of the planets in the Solar System.

Here’s an article from the BBC with several suggestions down in the comments. And here are some more.

We have recorded a whole series of podcasts about the Solar System at Astronomy Cast. Check them out here.

Reference:
http://solarsystem.nasa.gov/planets/profile.cfm?Object=SolarSys

Where In The Universe Challenge #14

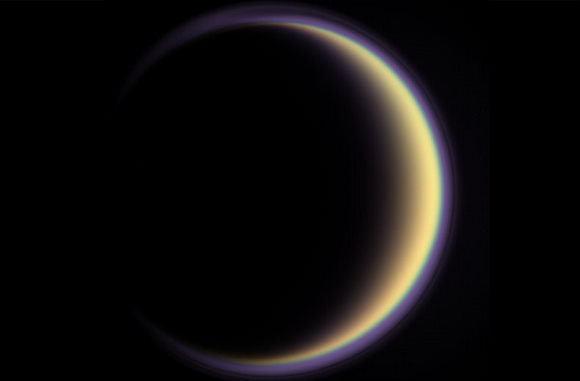
Here’s this week’s image for the “Where In The Universe” challenge. Take a look at the image above and guess where in our universe this image was taken. Extra points if you can name the spacecraft responsible for the image as well. No peeking below before you make your guess. Of course, some of our readers out there don’t guess: they KNOW! Universe Today draws some pretty savvy space buffs who know their stuff. Hopefully this weekly challenge is helping everyone to hone (or show off?) their skills.

Ready? Go!

This week’s image is a composite image, composed of two images taken with Cassini’s visual and infrared mapping spectrometer, shows a crescent view of Saturn’s moon Titan.

The data were obtained during a flyby on July 22, 2006, at a distance of 15,700 kilometers (9,700 miles) from Titan. The image was constructed from images taken at wavelengths of 1.26 microns shown in blue, 2 microns shown in green, and 5 microns shown in red.

Not only is Titan a very intriguing world, its beautiful as well. Just a little chilly there, though.

How’d you do in this week’s challenge?

More info on this image.

Solar System Coloring

Exploring the Solar System
  • Windows on the Universe – This site has a Solar System coloring book you can print off. It offers a Java version or a PDF version.
  • Enchanted Learning – Here’s another Solar System coloring book. This one contains images of all the planets, the Sun, the Moon, and other astronomical objects that you can color in.
  • Johnson Space Center (NASA) – Of course, NASA has some coloring books you can use. Here’s one that covers human spaceflight.
  • Solar System Coloring Book – This one comes from the Space Store. It’s not free, but it’s only $3.95 and has each of the planets.
  • Exploring the Solar System – Another book you can buy. This one is available from Amazon.com.

Let us know if you find any other books for coloring the Solar System.

StarGazer’s Telescope: Jumpin’ Jupiter!

Greetings, Fellow Stratos Dwellers! Have you had more than your fair share of clouds lately and are hankering for a few photons? Skies haven’t been spectacular in this part of the world either and when it is clear, the heat is sure making it difficult to get a nice steady view. But, it’s a nice night out. Wanna’ take out the StarGazer’s telescope and have a look at Jupiter? I’ll see you in the back yard…

Yes. The skies are still hazy, but it’s a warm night. Isn’t it something to see Jupiter up there riding along on the Milky Way? Makes me think of that crazy song… “Now that’s she’s back in the atmosphere, with drops of Jupiter in her hair..” Ok! Ok! I know we have to keep it quiet or we’ll wake the neighbors. Careful walking around the edge of the pool while you’re looking up. I don’t want to have to fish you out! You’ll see the telescope set up right over there. Go ahead. The eyepiece is waiting on you.

What’s that? Oh, yeah. It is awesome! Did you know that it has two and a half times more mass than all of the other planets put together? In fact, if it had much more mass Jupiter would shrink. Don’t laugh! I’m not kidding. If Jupiter gained more weight it could have even conceivably been a star. Can you imagine that? Then we’d never have a dark night.

Hmmm? Yes. You’re right. There are very noticeable markings when it steadies down a bit. Those are the cloud zones. The white one in the center is the EZ. Now quit that laughing! It stands for equatorial zone. The dark one underneath the EZ is the north equatorial belt and the one on top of it is the south. Yes. There’s lots of other fine lines, too. Below the north equatorial belt is the tropical and temperate zones. Same goes for the south up above. Just a bunch of fast moving ammonia crystals with maybe a little ammonium hydrosulfide thrown in for good measure. As phosphorus, sulfur or maybe even hydrocarbons swirl up from below, the ultraviolet light from Sol gives ’em a little suntan.

Hey! You saw it? Good for you! Yep. Just a little right of center in the southern tropical zone. That’s why I called you out here tonight. The Great Red Spot isn’t all that red, is it? Just a strange, salmon colored oval that shows up every now and again when things steady off. Yes, it sure is a storm. An anticyclonic storm that we know started at least as early as 1831 and maybe even as early as 1665. Sometimes it rotates fast and sometimes it rotates slow, but it always rotates counterclockwise to Jupiter. No one really knows why it is the color it is, but we do know its cooler than the other cloudtops and big enough at times to swallow three planet Earths. Now, move over…

It’s my turn.

Phobos Up Close from Mars Express

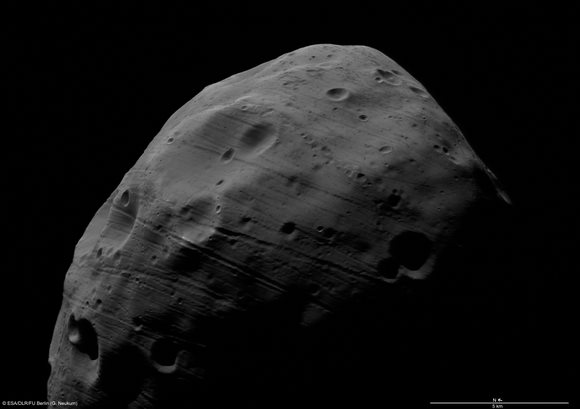
Hi-Res Phobos. Credits: ESA/ DLR/ FU Berlin (G. Neukum)

[/caption]
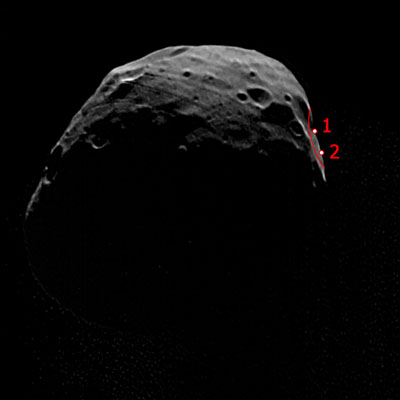
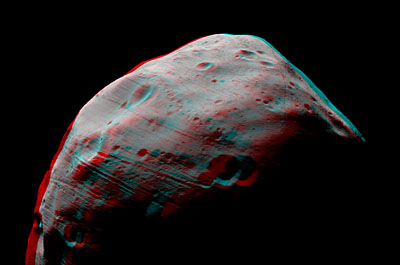
On July 23, Europe’s Mars Express spacecraft flew only 93 kilometers from Mars’ moon Phobos, and took the most detailed images ever of the small, irregular moon. Additionally, the spacecraft made other close flybys during the past few weeks, and creating a variety of images. The moon’s grooved surface can be seen in the pictures quite clearly, but the origin of the grooves is not known. They could have been formed by ejecta thrown up from impacts on Mars, or if they could be caused by internal fissures result from the surface regolith, or soil, slipping into internal fissures. Whatever the cause, enjoy these new hi-resolution images of Phobos.

Phobos flyby. Credits: ESA/ DLR/ FU Berlin (G. Neukum)

The best images taken by Mars Express have a resolution of 3.7 m/pixel and are taken in five channels different channels to create 3-D images, and to analyze the physical properties of the surface. Measuring 27 km × 22 km × 19 km, Phobos is one of the least reflective objects in the Solar System, thought to be a capture-asteroid or a remnant of the material that formed the planets.

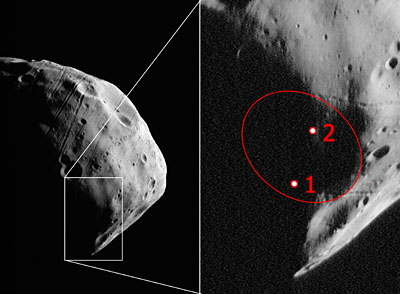
A Russian sample return mission called Phobos-Grunt (Phobos soil), is scheduled to launch in 2009. It is expected to land on the far-side of Phobos at a region between 5° south to 5° north, and 230° west to 235° west. This region was last imaged in the 1970s by the Viking orbiters. The inset here shows potential landing sites for the Russian mission.

Phobos.  Credits: ESA/ DLR/ FU Berlin (G. Neukum)
Phobos. Credits: ESA/ DLR/ FU Berlin (G. Neukum)

The images obtained by several other spacecraft so far have either been of a lower resolution, or not available in 3D and have not covered the entire disc of Phobos. This is also the first time that portions of the far-side of the moon have been imaged in such high resolution (Phobos always faces Mars on the same side). Mars Express’ High Resolution Camera (HRSC) Super-resolution channel (SRC) image taken on 22 July 2008 from a distance of 4500 km, showing the illuminated edge of the potential landing site of the Russian Phobos-Grunt mission.

Phobos in 3-D.  Credits: ESA/ DLR/ FU Berlin (G. Neukum)
Phobos in 3-D. Credits: ESA/ DLR/ FU Berlin (G. Neukum)

The imaging team is still working on producing additional images of the moon, including more in 3-D like this one. Managing the close fly-bys was an operational challenge, made possible by spacecraft operations engineers and scientists who worked together to specially optimise Mars Express’s trajectory and obtain the best possible views.

Original News Source: ESA

Podcast: The Milky Way

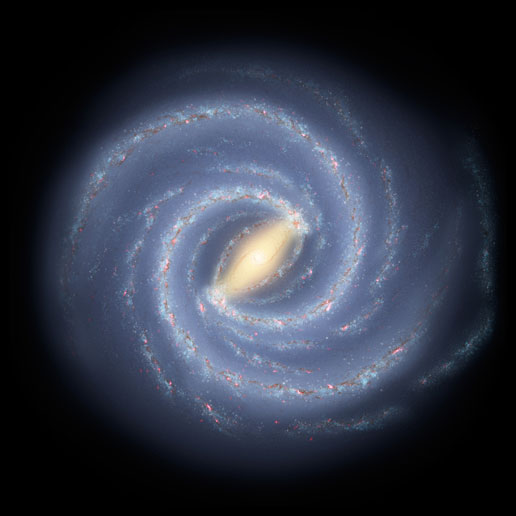
Artist illustration of the Milky Way. Image credit: NASA

[/caption]

The Milky Way is our home. An island of stars in a universe of other galaxies. But you might be surprised to learn that astronomers have only known the Milky Way’s true nature for just a century. Let’s learn the history of discoveries about the Milky Way, and what today’s science tells us. And let’s peer into the future to learn the ultimate fate of our galaxy.

Click here to download the episode

Milky Way – Show notes and transcript

Or subscribe to: astronomycast.com/podcast.xml with your podcatching software.

Astronomers Find New Evidence for Dark Energy

Dark Energy's stretching effect. Credit: U of Hawaii

[/caption]
A team of astronomers has found what they say is the clearest detection to date of dark energy in the universe. Scientists at the University of Hawaii compared an existing database of galaxies with a map of the cosmic microwave background radiation (CMB), and were able to detect dark energy’s effect on vast cosmic structures such as superclusters of galaxies, where there is a high concentration of galaxies, and supervoids, areas in space with a small number of galaxies. “We were able to image dark energy in action, as it stretches huge supervoids and superclusters of galaxies,” said Dr. István Szapudi said, from U of Hawaii’s Institute for Astronomy.

The discovery in 1998 that the universe was actually speeding up in its expansion was a surprise to astronomers. Dark energy refers to the fact that something must fill the vast reaches of mostly empty space in the Universe in order to be able to make space accelerate in its expansion. Dark energy works against the tendency of gravity to pull galaxies together and so causes the universe’s expansion to speed up.But the nature of dark energy and why it exists is one of the biggest puzzles of modern science.

The team from the University of Hawaii made the discovery by measuring the subtle imprints that superclusters and supervoids leave in microwaves that pass through them. Superclusters and supervoids are the largest structures in the universe.

“When a microwave enters a supercluster, it gains some gravitational energy, and therefore vibrates slightly faster,” explained Szapudi. “Later, as it leaves the supercluster, it should lose exactly the same amount of energy. But if dark energy causes the universe to stretch out at a faster rate, the supercluster flattens out in the half-billion years it takes the microwave to cross it. Thus, the wave gets to keep some of the energy it gained as it entered the supercluster.”

“Dark energy sort of gives microwaves a memory of where they’ve been recently,” postdoctoral scientist Mark Neyrinck said.

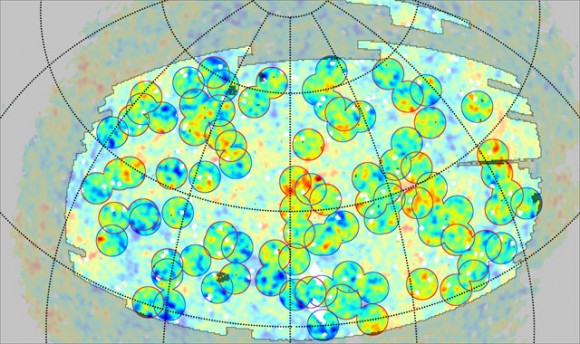
Comparing superclusters (red circles) and supervoids (blue circles) with the CMB.  Credit:  U of Hawaii
Comparing superclusters (red circles) and supervoids (blue circles) with the CMB. Credit: U of Hawaii

When the team compared galaxies against the CMB, they found that the microwaves were a bit stronger if they had passed through a supercluster, and a bit weaker if they had passed through a supervoid.

“With this method, for the first time we can actually see what supervoids and superclusters do to microwaves passing through them,” said graduate student Benjamin Granett.

The signal is difficult to detect, since ripples in the primordial CMB are larger than the imprints of individual superclusters and supervoids. To extract a signal, the team averaged together patches of the CMB map around the 50 largest supervoids and the 50 largest superclusters that they detected in extremely bright galaxies drawn from the Sloan Digital Sky Survey, a project that mapped the distribution of galaxies over a quarter of the sky.

The astronomers say there is only a one in 200,000 chance that the evidence they detected would occur by chance.

Original News Source: U of Hawaii press release

Area Beneath Phoenix Lander Is Changing

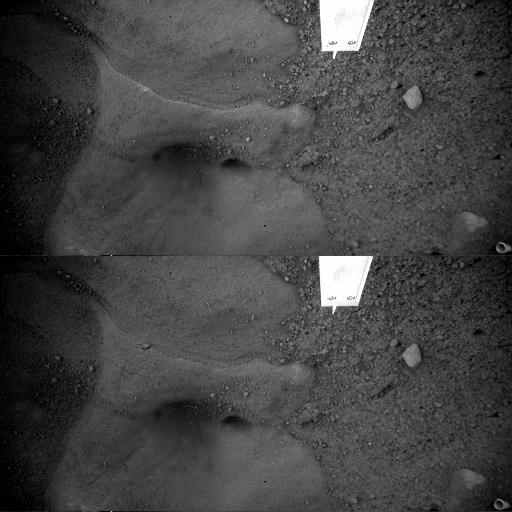
Snow Queen is changing! Credit: NASA/JPL/Caltech/U of Arizona

[/caption]
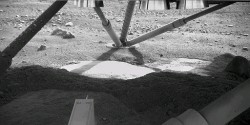
The bright, hard surface feature beneath the Phoenix Mars Lander has visibly changed from when it was first imaged shortly after the lander touched down on the Red Planet. Scientists believe the area, called “Snow Queen” could possibly be ice. Thruster exhaust blew away surface soil covering Snow Queen as Phoenix landed, exposing a hard layer with several smooth, rounded cavities. Phoenix’s Robotic Arm Camera (RAC) took its first close-up image of the area under the lander on May 31, the sixth sol of the mission. Now, more than 60 days since landing, cracks as long as 10 centimeters, or about four inches, have appeared in Snow Queen. A seven-millimeter (less than one-third inch) pebble or clod not seen there before has popped up on the surface, and some smooth texture has subtly roughened. These changes have been occurring slowly. “Images taken since landing showed these fractures didn’t form in the first 20 sols of the mission,” Phoenix co-investigator Mike Mellon of the University of Colorado, Boulder, said. “We might expect to see additional changes in the next 20 sols.”

Mellon said long-term monitoring of Snow Queen and other icy soil cleared by Phoenix landing and trenching operations is unprecedented for science. It’s the first chance to see visible changes in Martian ice at a place where temperatures are cold enough that the ice doesn’t immediately sublimate, or vaporize, away. Phoenix scientists discovered that centimeter-sized chunks of ice scraped up in the Dodo-Goldilocks trench lasted several days before vanishing.

“I’ve made a list of hypotheses about what could be forming cracks in Snow Queen, and there are difficulties with all of them,” Mellon said.

One possibility is that temperature changes over many sols, or Martian days, have expanded and contracted the surface enough to create stress cracks. It would take a fairly rapid temperature change to form fractures like this in ice, Mellon said.

Another possibility is the exposed layer has undergone a phase change that has caused it to shrink. An example of a phase change could be a hydrated salt losing its water after days of surface exposure, causing the hard layer to shrink and crack. “I don’t think that’s the best explanation because dehydration of salt would first form a thin rind and finer cracks,” Mellon said.

May 31 image of ice under Phoenix.  Credit:  NASA/JPL/Caltech/U of Arizone
May 31 image of ice under Phoenix. Credit: NASA/JPL/Caltech/U of Arizone

“Another possibility is that these fractures were already there, and they appeared because ice sublimed off the surface and revealed them,” he said.

As for the small pebble that popped up on Snow Queen after 21 sols — it might be a piece that broke free from the original surface or it might be a piece that fell down from somewhere else. “We have to study the shadows a little more to understand what’s happening,” Mellon said.

Meanwhile, scientists and engineers for the mission are studying the icy soil on Mars, examining how it interacts with the scoop on the lander’s robotic arm, trying different techniques to deliver a sample to the TEGA or Thermal and Evolved Gas Analyzer instrument.

“It has really been a science experiment just learning how to interact with the icy soil on Mars — how it reacts with the scoop, its stickiness, whether it’s better to have it in the shade or the sunlight,” said Phoenix Principal Investigator Peter Smith of the University of Arizona.

Last weekend, the team tried two different methods to pick up and deliver a sample of icy soil to one of the ovens in TEGA. In both cases, most of the sample stuck inside the lander’s scoop, with only a small amount of soil getting into the oven. All the data received from the lander – both images and other data — indicated that not enough soil had been funneled into the oven to prompt the oven to close and begins its analysis.

The team plans to keep gaining experience in handling the icy soil while continuing with other Phoenix studies of the soil and the atmosphere.

Smith said, “While we continue with determining the best way to get an icy sample, we intend to proceed with analyzing dry samples that we already know how to deliver. We are going to move forward with a dry soil sample.”

Original News Source: Phoenix News site