TV Alert: NOVA scienceNOW

I know you never watch television any more, but you might want to dust off the box on Tuesday, January 10th to watch Nova scienceNOW on PBS. It has a collection of science stories including coverage about the newly discovered 10th planet. Visit their website for more information and viewing times. Although it’s not available yet, PBS makes all its Nova scienceNOW episodes available to watch online from its archive.

Fraser Cain
Publisher
Universe Today

The North Star is Really Three Stars

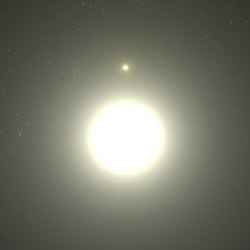
Polaris with its faint companions. Image credit: Greg Bacon (STScI) Click to enlarge
We tend to think of the North Star, Polaris, as a steady, solitary point of light that guided sailors in ages past. But there is more to the North Star than meets the eye – two faint stellar companions. The North Star is actually a triple star system. And while one companion can be seen easily through small telescopes, the other hugs Polaris so tightly that it has never been seen directly – until now.

By stretching the capabilities of NASA’s Hubble Space Telescope to the limit, astronomers have photographed the close companion of Polaris for the first time. They presented their findings today in a press conference at the 207th meeting of the American Astronomical Society in Washington, DC.

“The star we observed is so close to Polaris that we needed every available bit of Hubble’s resolution to see it,” said Smithsonian astronomer Nancy Evans (Harvard-Smithsonian Center for Astrophysics).

The companion proved to be less than two-tenths of an arcsecond from Polaris – an incredibly tiny angle equivalent to the apparent diameter of a quarter located 19 miles away. At the system’s distance of 430 light-years, that translates into a physical separation of about 2 billion miles.

“The brightness difference between the two stars made it even more difficult to resolve them,” stated Howard Bond of the Space Telescope Science Institute (STScI). Polaris is a supergiant more than two thousand times brighter than the Sun, while its companion is a main-sequence star. “With Hubble, we’ve pulled the North Star’s companion out of the shadows and into the spotlight.”

By watching the motion of the companion star, Evans and her colleagues expect to learn not only the stars’ orbits but also their masses. Measuring the mass of a star is one of the most difficult tasks facing stellar astronomers.

Astronomers want to determine the mass of Polaris accurately because it is the nearest Cepheid variable star. Cepheids are used to measure the distance to galaxies and the expansion rate of the universe, so it is essential to understand their physics and evolution. Knowing their mass is the most important ingredient in this understanding.

“Studying binary stars is the best available way to measure the masses of stars,” said science team member Gail Schaefer of STScI.

“We only have the binary stars that nature provided us,” added Bond. “With the best instruments like Hubble, we can push farther into space and study more of them up close.”

The researchers plan to continue observing the Polaris system for several years. In that time, the movement of the small companion in its 30-year orbit around the primary should be detectable.

“Our ultimate goal is the get an accurate mass for Polaris,” said Evans. “To do that, the next milestone is to measure the motion of the companion in its orbit.”

Headquartered in Cambridge, Mass., the Harvard-Smithsonian Center for Astrophysics (CfA) is a joint collaboration between the Smithsonian Astrophysical Observatory and the Harvard College Observatory. CfA scientists, organized into six research divisions, study the origin, evolution and ultimate fate of the universe.

Original Source: CfA News Release

Massive Star Cluster Discovered

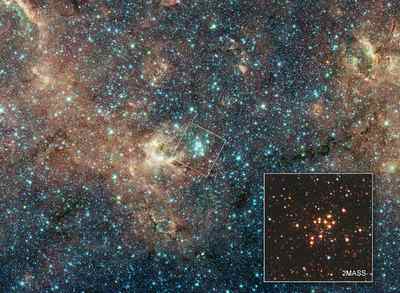
The Bermuda triangle of the Milky Way galaxy. Image credit: NASA/JPL-Caltech Click to enlarge
Call it the Bermuda Triangle of our Milky Way Galaxy: a tiny patch of sky that has been known for years to be the source of the mysterious blasts of X-rays and gamma rays. Now, a team of astronomers, led by Don Figer of the Space Telescope Science Institute (STScI) in Baltimore, Md., has solved the mystery by identifying one of the most massive star clusters in the galaxy. The little-known cluster, which has not been catalogued, is about 20 times more massive than typical star clusters in our galaxy, and appears to be the source of the powerful outbursts.

Supporting evidence for the hefty weight of this cluster is the presence of 14 red supergiants, hefty stars that have reached the end of their lives. They bloat up to about 100 times their normal size before exploding as supernovae. In fact, Figer’s team believes that the blasts of X-rays and gamma rays were released in supernova explosions. Sightings of red supergiants are rare. Astronomers have spotted only about 200 such stars in the Milky Way. The lack of sightings is because the red supergiant phase is very short in astronomical terms, lasting about half a million to a million years.

“Only the most massive clusters can have lots of red supergiants, because they are the only clusters capable of making behemoth stars,” Figer explained. “They are good signposts that allow astronomers to predict the mass of the cluster. This observation also is a rare chance to study huge stars just before they explode. Normally, we don’t get to see stars before they pop off.”

Figer will present his results on Jan. 9 at the 207th meeting of the American Astronomical Society in Washington, D.C. The 14 red supergiants in this cluster represent almost three times as many as in any other star cluster in our galaxy. The runner-up, NGC 7419, has five. Stars that become red supergiants weigh between 8 to 25 times our Sun’s mass and are 6 to 15 million years old.

The team identified the star cluster as a potential behemoth from the newly found clusters compiled in the Two Micron All Sky Survey catalogue. Astronomer John MacKenty, also of STScI, performed follow-up observations of the cluster in Sept. and Oct. 2005 with a unique ground-based infrared spectrograph at Kitt Peak National Observatory in Arizona. Called the Infrared Multi-object Spectrograph, “the instrument has about 500,000 movable microscopic mirrors in its focal plane which allow astronomers to take infrared spectra of up to 100 stars at once,” said MacKenty, the instrument’s lead investigator. Spectra display stars’ energy output as a series of individual wavelengths of light for study. The resulting patterns are akin to sets of fingerprints for stars, revealing characteristics such as composition, temperature, mass, and age. Astronomers plan to use similar technology on the Near Infrared Spectrograph aboard the James Webb Space Telescope, scheduled for launch in 2013.

Figer relied on data from a variety of telescopes, including the Spitzer Space Telescope, to confirm that the infrared colors of the suspected red supergiants are consistent with those of known red supergiants. The red supergiants discovered by Figer’s team are very bright, indicating that the cluster is a youngster of about 8 to 10 million years old. The cluster has to be young enough for astronomers to see these short-lived stars before they explode, yet old enough to have stars that have evolved to the red supergiant stage. The cluster’s mass equals 20,000 times the mass of our Sun. An estimated 20,000 stars reside in the cluster.

The cluster is the first of 130 massive star cluster candidates that Figer and his team will study over the next five years using a variety of telescopes, including the Spitzer and Hubble Space telescopes. “We can only see a small part of our galaxy in visible light because a dusty veil covers most of our galaxy,” Figer said. “I know there are other massive clusters in the Milky Way that we can’t see because of the dust. My goal is to find them using infrared light, which penetrates the dusty veil.”

The monster cluster’s location, nearly two-thirds of the way to our galaxy’s center and 18,900 light-years from Earth, is in an area known for energetic activity. Several observatories ? the High Energy Stereoscopic System, the International Gamma-Ray Astrophysics Laboratory and the Advanced Satellite for Cosmology and Astrophysics ? detected very high-energy X-rays and gamma rays from that region. Astronomers knew that something powerful was occurring there, but they couldn’t identify the source.

Original Source: Hubblesite News Release

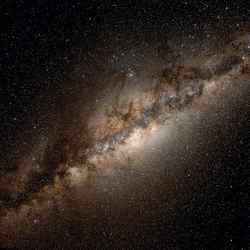
How the Milky Way Got its Warp

The Milky Way galaxy. Image credit: Serge Brunier. Click to enlarge
The most prominent of the Milky Way’s satellite galaxies – a pair of galaxies called the Magellanic Clouds – appears to be interacting with the Milky Way’s ghostly dark matter to create a mysterious warp in the galactic disk that has puzzled astronomers for half a century.

The warp, seen most clearly in the thin disk of hydrogen gas permeating the galaxy, extends across the entire 200,000-light year diameter of the Milky Way, with the sun and earth sitting somewhere near the crease. Leo Blitz, professor of astronomy at the University of California, Berkeley, and his colleagues, Evan Levine and Carl Heiles, have charted this warp and analyzed it in detail for the first time, based on a new galactic map of hydrogen gas (HI) emissions.

They found that the atomic gas layer is vibrating like a drum, and that the vibration consists almost entirely of three notes, or modes.

Astronomers previously dismissed the Magellanic Clouds – comprised of the Large and Small Magellanic Clouds – as a probable cause of the galactic warp because the galaxies’ combined masses are only 2 percent that of the disk. This mass was thought too small to influence a massive disk equivalent to about 200 billion suns during the clouds’ 1.5 billion-year orbit of the galaxy.

Nevertheless, theorist Martin D. Weinberg, a professor of astronomy at the University of Massachusetts, Amherst, teamed up with Blitz to create a computer model that takes into account the Milky Way’s dark matter, which, though invisible, is 20 times more massive than all visible matter in the galaxy combined. The motion of the clouds through the dark matter creates a wake that enhances their gravitational influence on the disk. When this dark matter is included, the Magellanic Clouds, in their orbit around the Milky Way, very closely reproduce the type of warp observed in the galaxy.

“The model not only produces this warp in the Milky Way, but during the rotation cycle of the Magellanic Clouds around the galaxy, it looks like the Milky Way is flapping in the breeze,” said Blitz, director of UC Berkeley’s Radio Astronomy Laboratory.

“People have been trying to look at what creates this warp for a very long time,” Weinberg said. “Our simulation is still not a perfect fit, but it has a lot of the character of the actual data.”

Levine, a graduate student, will present the results of the work in Washington, D.C., on Jan. 9 during a 10 a.m. session on galactic structure at the American Astronomical Society meeting. Blitz will summarize the work later that day during a 12:30 p.m. press briefing in the Wilson C Room of the Marriott Wardman Park Hotel.

The interaction of the Magellanic Clouds with the dark matter in the galaxy to produce an enigmatic warp in the hydrogen gas layer is reminiscent of the paradox that led to the discovery of dark matter some 35 years ago. As astronomers built better and better telescopes able to measure the velocities of stars and gas in the outer regions of our galaxy, they discovered these stars moving far faster than would be expected from the observed number and mass of stars in the entire Milky Way. Only by invoking a then-heretical notion, that 80 percent of the galaxy’s mass was too dark to see, could astronomers reconcile the velocities with known theories of physics.

Though no one knows the true identity of this dark matter – the current consensus is that it is exotic matter rather than normal stars too dim to see – astronomers are now taking it into account in their simulations of cosmic dynamics, whether to explain the lensing effect galaxies and galaxy clusters have on the light from background galaxies, or to describe the evolution of galaxy clusters in the early universe.

Some physicists, however, have come up an alternative theory of gravity called Modified Newtonian Dynamics, or MOND, that seeks to explain these observations without resorting to belief in a large amount of undetected mass in the universe, like an invisible elephant in the room. Though MOND can explain some things, Weinberg thinks the theory will have a hard time explaining the Milky Way’s warp.

“Without a dark matter halo, the only thing the gas disk can feel is direct gravity from the Magellanic Clouds themselves, which was shown in the 1970s not to work,” he said. “It looks bad for MOND, in this case.”

Because many galaxies have warped disks, similar dynamics might explain them as well. Either way, the researchers say their work suggests that warps provide a way to verify the existence of the dark matter.

The starting point for this research was new spectral data released this past summer about hydrogen’s 21-centimeter emissions in the Milky Way. The survey, the Leiden-Argentina-Bonn or LAB Survey of Galactic HI, merged a northern sky survey conducted by astronomers in the Netherlands (the Leiden/Dwingeloo Survey) with a southern sky survey from the Instituto Argentino de Radioastronom?a. The data were corrected by scientists at the Institute for Radioastronomy of the University of Bonn, Germany.

Blitz, Levine and Heiles, UC Berkeley professor of astronomy, took these data and produced a new, detailed map of the neutral atomic hydrogen in the galaxy. This hydrogen, distributed in a plane with dimensions like those of a compact disk, eventually condenses into molecular clouds that become stellar nurseries.

With map in hand, they were able to mathematically describe the warp as a combination of three different types of vibration: a flapping of the disk’s edge up and down, a sinusoidal vibration like that seen on a drumhead, and a saddle-shaped oscillation. These three “notes” are about 3 million octaves below middle C.

“We found something very surprising, that we could describe the warp by three modes of vibration, or three notes, and only three,” Blitz said, noting that this rather simple mathematical description of the warp had escaped the notice of astronomers since the warp’s discovery in 1957.

“We were actually trying to analyze a more complex ‘scalloping’ structure of the disk, and this simple, elegant vibrational structure just popped out,” Levine added.

The current warp in the gas disk is a combination of these three vibrational modes, leaving one-half of the galactic disk sticking up above the plane of stars and gas, while the other half dips below the disk before rising upward again farther outward from the center of the galaxy. The results of this analysis will be published in an upcoming issue of the Astrophysical Journal.

Weinberg thought he could explain the observed warp dynamically, and used computers to calculate the effect of the Magellanic Clouds orbiting the Milky Way, plowing through the dark matter halo that extends far out into the orbit of the clouds.

What he and Blitz found is that the clouds’ wake through the dark matter excites a vibration or resonance at the center of the dark matter halo, which in turn makes the disk embedded in the halo oscillate strongly in three distinct modes. The combined motion during a 1.5-billion-year orbit of the Magellanic Clouds is reminiscent of the edges of a tablecloth flapping in the wind, since the center of the disk is pinned down.

“We often think of the warp as being static, but this simulation shows that it is very dynamic,” Blitz said.

Blitz, Levine and Heiles are continuing their search for anomalies in the structure of the Milky Way’s disk. Weinberg hopes to use the UC Berkeley group’s data and analysis to determine the shape of the dark matter halo of the Milky Way.

The research of the UC Berkeley group is supported by the National Science Foundation. Weinberg is partly supported by NASA and the NSF.

Original Source: UC Berkeley News Release

What’s Up This Week – January 9 – January 15, 2006

What's Up 2006

Download our free “What’s Up 2006” ebook, with entries like this for every day of the year.

Plato crater on the Moon. Image credit: Wes Higgins. Click to enlarge.
Monday, January 9 – Today in 1839, South African Thomas Henderson measured the distance to the closest bright star other than the Sun. Using geometrical parallax, Alpha Centauri was found to be 4.3 light-years away – this amounted to a distance of almost 41 trillion kilometers! Such a distance is the equivalent of over 270,000 earth-sun distances (astronomical units – AU).

Speaking of parallax, let’s take a look at a star with the precisely measured distance of 10.67 light-years from our Sun – Epsilon Eridani. Epsilon is the third closest of the visible stars and can be found tonight by starting at Rigel. About a hand span southwest, locate Gamma Eridani and head another fist-width northwest for a pair of easy stars. Epsilon is the westernmost.

At magnitude 3.7, Epsilon is not one of the brightest stars in the night sky because it has only 85% of the mass of our own Sun. It is also a young star, some 4 billion years younger than Sol and slightly variable. But, like our own “star,” Epsilon has no companion. On a curious note, science fiction chose Epsilon Eridani to be the home of the Vulcans!
Now let’s have a look at the Moon and a crater so prominent that it can be spotted unaided. To the lunar north, look for the dark ellipse of Plato. This mountain-walled plain with a dark floor is a Class V crater. Its slightly oval shape spans 64 by 67 miles in diameter, but appears far more elliptical due to its northern latitude. Plato’s floor is its most curious feature. Consisting of 2,700 square miles of unique lava, and only broken by a couple of very minor and supremely challenging craters, Plato is one of the very few areas on the lunar surface that seems to have changed in recent history.

Be sure to notice how close the Moon and Pleiades are tonight and check on the internet (IOTA) for grazing and occultation events visible from your area.

Tuesday, January 10 – Robert W. Wilson was born this day in 1936. Wilson is co-discoverer, along with Arno Penzias, of the cosmic microwave background and in 1978, won the Nobel Prize for Physics. On this day in 1946, the US Army’s Signal Corps became the first to successfully bounce radar waves off the Moon. Although this might sound like a minor achievement, let’s look just a bit further into what it really meant.

Known as “Project Diana,” scientists were hard at work to find a way to pierce the Earth’s ionosphere with radio waves – a feat believed impossible at the time. Headed by Lt. Col. John DeWitt, and working with only a handful of full-time researchers, a modified bedspring-type radar antenna was set up at Camp Evans, Georgia. Anxiously, the power was cranked up and the antenna aimed at the rising Moon. A series of radar signals were broadcast and echoes were picked up exactly 2.5 seconds later – the time it takes light to travel to the Moon and back. The significance of Project Diana cannot be underestimated. Because the ionosphere could be pierced, communications became possible between Earth and future space missions. Although it would be more than a decade before the first satellites and manned missions were launched into space, Project Diana had paved the way.

To commemorate Project Diana, let’s have a look at one of the most impressive craters on the Moon – Copernicus.
While Copernicus is not the oldest, deepest, largest, or brightest crater on the Moon, it certainly is one of the most detailed. Visible in binoculars toward Plato and near the terminator, this youthful crater gives a highly etched appearance. Its location in a fairly smooth plain near the center of the Moon’s disc, and prominent “splash” ray system, all combine to make Copernicus visually stunning in a small telescope.
Tonight let’s try our hand at splitting a double star – Gamma Arietis. Known as Mesarthim, Gamma is the third star in the line of bright stars – about a hand span west of the Pleiades – pointing in the direction of Eta Piscium. This orange and green pair gives the appearance of two glowing eyes in the night. Seeing two equal magnitude stars so close together can’t help but get you out observing – even when there’s Moon!

Wednesday, January 11 – Tonight in 1787, Sir William Herschel discovered Uranus’ largest moons – Oberon and Titania. Let’s have a look. Sixth magnitude Uranus is around two finder-widths south-southwest of Lambda Aquarii. Its small, pale blue disc will be distinguishable from neighboring stars. Under the right conditions, the planet can sometimes be seen unaided and was once given the designation “34 Tauri” by 17th century astronomer John Flamsteed. The two satellites – both 14th magnitude – can be seen with very large scopes with excellent seeing conditions.

The most outstanding feature on the northern lunar surface this evening is the “Bay of Rainbows” – Sinus Iridum. Take the time to power up and enjoy its many wonderful features including the bright Promontorium LaPlace to the northeast and Heraclides to the southwest. Ringed by the Juras Mountains, Sinus Iridum also includes crater Bianchini at center and Sharp to the west.

Thursday, January 12 – This date celebrates the 1830 founding of what – one year later – would become the Royal Astronomical Society. Conceived by John Herschel, Charles Babbage, James South and others, the RAS has continuously published its Monthly Notices since 1831.

Tonight our primary lunar study is crater Kepler. Look for it as a bright point, slightly lunar north of center near the terminator. Its home is the Oceanus Procellarum – a sprawling dark mare composed primarily of dark minerals of low reflectivity (albedo) such as iron and magnesium. Bright, young Kepler will display a wonderfully developed ray system. The crater rim is very bright, consisting mostly of a pale rock called anorthosite. The “lines” extending from Kepler are fragments that were splashed out and flung across the lunar surface when the impact occurred. The region is also home to features known as “domes” – seen between the crater and the Carpathian Mountains. So unique is Kepler’s geological formation that it became the first crater mapped by U.S. Geological Survey in 1962.

With the nearly full Moon in Gemini, go north to Cassiopeia and check out wide double star 35 Cassiopeia about two finger-widths west of Epsilon and an equal distance north of Gamma. This is an easy split for telescopes and can be resolved in steady binoculars.

Friday, January 13 – Tonight let’s give the Moon a rest and turn our scopes to Mars high overhead. With the exception of Sirius, Mars remains brighter than any star in the sky. To the eye, the planet’s ruddy glow makes it unmistakable. Through the telescope, observers can make out large-scale details such as the planets polar caps, Syrtis Major, Sinus Sabaeus, and the three major Mares – Cimmerium, Sirenum and Acidalium. Although good “seeing” makes high power and fine details possible, sometimes just “viewing” is half the fun!

Saturday, January 14 – Tonight’s Full Moon is known as the Wolf Moon. For the northern hemisphere in January, extreme cold and deep snows gave rise to the legend of wolf packs howling hungrily outside Indian villages. Sometimes the January Full Moon is also referred to as the Old Moon, or the Moon after Yule. No matter what it is called, it is still a lovely sight to watch rise and glide across the luminous night sky.

As a challenge this evening, try tracking down 5th magnitude double star Zeta Piscium. Located two finger-widths due east of Epsilon, this pair is easily resolved at low magnification due to its near matched brightness. Look for subtle shades of color displayed by the blue primary, and ivory-colored secondary.

Sunday, January 15 – With only short time before the Moon rises tonight, let’s start our evening by viewing a distant multiple star system – Sigma Orionis.

You’ll easily find 1400 light-years distant Sigma less than a finger-width below the left hand star in Orion’s “Belt” (Zeta or Alnitak). What won’t be easy is to distinguish the closest and brightest pair! 3.8 magnitude A and 6.6 magnitude B revolve around each other every 170 years and are separated by a close 0.3 arc seconds. Among the most massive binaries known, these two stars have extremely hot surfaces (approaching 50,000 degrees K) and both appear white in the eyepiece.

At a more comfortable separation, the white 8.8 magnitude C star resides 11.4 arc seconds southwest of the brighter pair. At a similar distance from AB to the east, look for red 6.7 magnitude D. Considerably further away at 41 arc seconds, the blue E star resides east-northeast of the AB primary. Unusual star E shares the same spectral qualities as the AB primary, yet is rich in helium light (emission lines) within its color spectrum. If five isn’t enough, then look 30 arc seconds southwest of E – because it, too, has a companion. All of these stars are part of the same physical system spanning about one-third of a light-year.

If you choose to look at the lunar surface, carefully check along the eastern edge where the terminator is now receding. In the north, look for the dark shades of Mare Humboldtianum and the equally dark floor of crater Endymion to its west. This lava filled area is around 70 miles in diameter.

I would personally like to thank all of you for your support and kind comments on the look at the year ahead. Be sure to stay tuned to the weekly column as breaking observing news is added. Until next week, ask for the Moon, but keep reaching for the stars! May all of your journeys be at light speed… ~Tammy Plotner

Star Orbiting a Medium Sized Black Hole

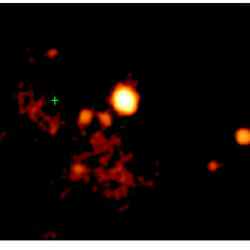
An image of the central region of the starburst galaxy M82. Image credit: NASA Click to enlarge
Scientists using NASA’s Rossi X-ray Timing Explorer have found a doomed star orbiting what appears to be a medium-sized black hole ? a theorized “in-between” category of black hole that has eluded confirmation and frustrated scientists for more than a decade.

With the discovery of the star and its orbital period, scientists are now one step away from measuring the mass of such a black hole, a step which would help verify its existence. The star’s period and location already fit into the main theory of how these black holes could form.

A team led by Prof. Philip Kaaret of the University of Iowa, Iowa City, announced these results today in Science Express. The results will also appear in the Jan. 27 issue of Science.

“We caught this otherwise ordinary star in a unique stage in its evolution, toward the end of its life when it has bloated into a red giant phase,” said Kaaret. “As a result, gas from the star is spilling into the black hole, causing the whole region to light up. This is a well-studied region of the sky, and we spotted the star with a little luck and a lot of perseverance.”

A black hole is an object so dense and with a gravitational force so intense that nothing, not even light, can escape its pull once within its boundary. A black hole region becomes visible when matter falls toward it and heats to high temperatures. This light is emitted before the matter crosses the border, called the event horizon.

Our galaxy is filled with millions of stellar-mass black holes, each with the mass of a few suns. These form from the collapse of very massive stars. Most galaxies possess at their core a supermassive black hole, containing the mass of millions to billions of suns confined to a region no larger than our solar system. Scientists do not know how these form, but it likely entails the collapse of enormous quantities of primordial gas.

“In the past decade, several satellites have found evidence of a new class of black holes, which could be between 100 and 10,000 solar masses,” said Dr. Jean Swank, Rossi Explorer project scientist at NASA?s Goddard Space Flight Center, Greenbelt, Md. “There has been debate about the masses and how these black holes would form. Rossi has provided major new insight.”

These suspected mid-mass black holes are called ultra-luminous X-ray objects because they are bright sources of X-rays. In fact, most of these black hole mass estimates have been based solely on a calculation of how strong a gravitational pull is needed to produce light of a given intensity.

Kaaret’s group at the University of Iowa, which includes Prof. Cornelia Lang and Melanie Simet, an undergraduate, made a measurement that can be used in the equation to directly calculate mass. Using straightforward Newtonian physics, scientists can calculate an object’s mass once they know an orbital period and velocity of smaller objects rotating around it.

“We found a rise and fall in X-ray light every 62 days, likely caused by the orbit of the companion star around the black hole,” said Simet. ?The velocity will be hard to determine, however, because the star is located in such a dust-obscured area. This makes it hard for optical and infrared telescopes to observe the star and make velocity calculations. Yet for now, knowing just the orbital period is very revealing.?

The suspected mid-mass black hole, known as M82 X-1, is a well-studied ultra-luminous X-ray object in a nearby star cluster containing about a million stars packed into a region only about 100 light years across. A leading theory proposes that a multitude of star collisions over a short period in a crowded region will create a short-lived gigantic star that collapses into a 1,000-solar-mass black hole. The cluster near M82 X-1 has a high-enough density to form such a black hole. No normal companion could provide enough fuel to make M82 X-1 shine so brightly. But the 62-day orbital period implies that the companion must have a very low density. This fits the scenario of a bloated super-giant star losing mass at a rate high enough to fuel M82 X-1.

“With this discovery of the orbital period, we now have a consistent picture of the whole evolution of a mid-mass black hole binary,” said Kaaret. “It was formed in a ‘super’ star cluster; the black hole then captured a companion star; the companion star evolved to the giant stage; and we now see it as an extremely luminous X-ray source because the companion star has expanded and is feeding the black hole.”

Original Source: NASA News Release

Hazy View of Saturn

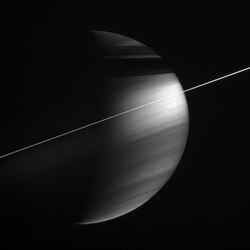
Haze layers in the atmosphere encircling Saturn. Image credit: NASA/JPL/SSI Click to enlarge
In this magnificent view, delicate haze layers high in the atmosphere encircle the oblate figure of Saturn. A special combination of spectral filters used for this image makes the high haze become visible. A methane-sensitive filter (centered at 889 nanometers) makes high altitude features stand out, while a polarizing filter makes small haze particles appear bright.

Methane in the atmosphere absorbs light with wavelengths around 889 nanometers as it travels deeper into the gas planet, thus bright areas in this image must represent reflective material at higher altitudes. Small particles or individual molecules scatter light quite effectively to a polarization of 90 degrees, which this polarizing filter is sensitive to. Thus, high altitude haze layers appear bright in this view.

The small blob of light at far right is Dione (1,126 kilometers, or 700 miles across).

The image was taken with the Cassini spacecraft wide-angle camera on Dec. 5, 2005, at a distance of approximately 2.9 million kilometers (1.8 million miles) from Saturn and at a Sun-Saturn-spacecraft, or phase, angle of 100 degrees. The image scale is 169 kilometers (105 miles) per pixel.

The Cassini-Huygens mission is a cooperative project of NASA, the European Space Agency and the Italian Space Agency. The Jet Propulsion Laboratory, a division of the California Institute of Technology in Pasadena, manages the mission for NASA’s Science Mission Directorate, Washington, D.C. The Cassini orbiter and its two onboard cameras were designed, developed and assembled at JPL. The imaging operations center is based at the Space Science Institute in Boulder, Colo.

For more information about the Cassini-Huygens mission visit http://saturn.jpl.nasa.gov . The Cassini imaging team homepage is at http://ciclops.org .

Original Source: NASA/JPL/SSI News Release

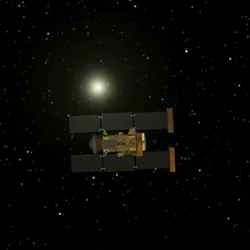
10 Days Until Stardust Returns

An artist’s illustration of Stardust approaching Earth. Image credit: NASA/JPL Click to enlarge
Ten days before its historic return to Earth with the first-ever samples from a comet, NASA’s Stardust spacecraft successfully performed its 18th flight path adjustment. This second-to-last scheduled maneuver puts the spacecraft on the right path to rendezvous with Earth on Jan. 15 (Universal Time), when it will release its sample return capsule.

At 1800 Universal Time (10:00 am Pacific Time) on Thursday, Jan. 5, Stardust fired all eight of its 4.4 newton (1-pound) thrusters for a total of 107 seconds, changing the comet sampler’s speed by 2.4 meters per second (about 5.4 miles per hour). The maneuver required 385 grams (0.85 pounds) of hydrazine monopropellant to complete. A final trajectory correction maneuver is scheduled prior to release of the sample return capsule.

“It was a textbook maneuver,” said Ed Hirst, Stardust deputy mission manager at NASA’s Jet Propulsion Laboratory, Pasadena, Calif. “After sifting through all the post-burn data, I expect we will find ourselves right on the money.”

In the early morning hours of January 15, 2006, the Stardust mission returns to Earth after a 4.63 billion kilometer (2.88 billion mile) round-trip journey carrying a precious cargo of cometary and interstellar dust particles. Scientists believe Stardust’s cargo will help provide answers to fundamental questions about the origins of the solar system.

Scientists believe in-depth terrestrial analysis of cometary samples will reveal much not just about comets but about the earliest history of the solar system. Locked within the cometary particles is unique chemical and physical information that could be the record of the formation of the planets and the materials from which they were made.

Extensive information on the Stardust mission is available from the Stardust site at www.nasa.gov/stardust .

JPL manages the Stardust mission for NASA’s Science Mission Directorate, Washington. Lockheed Martin Space Systems, Denver, developed and operates the spacecraft. JPL is a division of the California Institute of Technology. NASA’s Johnson Space Center contributed to Stardust payload development, and the Johnson Space Center will curate the sample and support analysis and sample allocation.

Original Source: NASA News Release

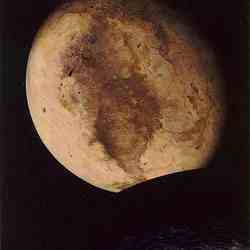
Charon has no Atmosphere

An artist’s conception of Pluto and its moon Charon. Image credit: NASA Click to enlarge
If you want to learn something about a place that’s billions of miles away, it helps to be in the right place at the right time.

Astronomers from MIT and Williams College were lucky enough to watch as Pluto’s largest moon, Charon, passed in front of a star last summer. Based on their observations of the occultation, which lasted for less than a minute, the team reports new details about the moon in the Jan. 5 issue of Nature.

A second paper from another group, led by French astronomer Bruno Sicardy, also appears in this issue of Nature.

The MIT-Williams team was able to measure Charon’s size to an unprecedented accuracy and determine that it has no significant atmosphere. The atmosphere on Pluto, on the other hand, has been very well established.

“The results provide insight into the formation and evolution of bodies in the outer solar system,” said lead author Amanda Gulbis, a postdoctoral associate in MIT’s Department of Earth, Atmospheric and Planetary Sciences.

Specifically, the team found that Charon has a radius of 606 kilometers, “plus or minus 8 kilometers to account for local topography or possible non-sphericity in Charon’s shape,” Gulbis said. That size, combined with mass measurements from Hubble Space Telescope data, show that the moon has a density roughly one-third that of the Earth. This reflects Charon’s rocky-icy composition.

The team also found that the density of any atmosphere on the moon must be less than a millionth of that of the Earth. This argues against the theory that Pluto and Charon were formed by the cooling and condensing of the gas and dust known as the solar nebula. Instead, Charon was likely created in a celestial collision between an object and a proto-Pluto.

“Our observations show that there is no substantial atmosphere on Charon, which is consistent with an impact formation scenario,” Gulbis said. Similar theories exist about the formation of the Earth-moon system.

The success of the MIT-Williams team in observing the Charon occultation bodes well for future adaptations of the technique the researchers used.

“We are eager to use (it) to probe for atmospheres around recently discovered Kuiper Belt objects that are Pluto-sized or even larger,” said James Elliot, co-author of the Nature paper and a professor in MIT’s Department of Earth, Atmospheric and Planetary Sciences and in the Department of Physics. Elliot has been observing stellar occultations by bodies in the solar system for more than three decades.

Jay Pasachoff, Williams College team leader and a professor in its Department of Astronomy, said, “It’s remarkable that our group could be in the right place at the right time to line up a tiny body 3 billion miles away. The successful observations are quite a reward for all of the people who helped predict the event, constructed and integrated the equipment and traveled to the telescopes.”

In addition to Elliot and Gulbis, members of the MIT team were Michael Person, Elisabeth Adams and Susan Kern, with support from undergraduate Emily Kramer. The Williams College team included Pasachoff, Bryce Babcock, Steven Souza and undergraduate Joseph Gangestad.

The work was supported by NASA.

Original Source: MIT News Release

Update: Pluto isn’t a planet. Why isn’t Pluto a planet?

When a Meteor Slashed Mars

Color view of ‘butterfly’-shaped crater at Hesperia Planum. Image credit: ESA Click to enlarge
These images, taken by the High Resolution Stereo Camera (HRSC) on board ESA?s Mars Express spacecraft, show a large elliptical impact crater in the Hesperia Planum region of Mars.

The HRSC obtained these images during orbit 368 with a ground resolution of approximately 16.7 metres per pixel. The scenes show the region of Hesperia Planum, at approximately 35.3? South and 118.7? East. A large elliptical impact crater is visible within the scene, measuring approximately 24.4 km long, 11.2 km wide and reaching a maximum depth of approximately 650 metres below the surrounding plains.

Ejecta from this impact can be seen extending away from the crater, including two prominent lobes of material north-west and south-east of the crater.

The large circular feature, partly cut off by the border of the image, has a diameter of roughly 45 km.

This appears to be an impact crater that was subsequently resurfaced by lava flows, preserving the outline of the underlying crater. The curving features visible in the north of the image, known as ?wrinkle ridges?, are caused by compressional tectonics.

While the majority of impact craters are relatively circular, the elliptical shape of this impact crater suggests a very low impact angle (less than 10 degrees).

The long axis of the impact crater is viewed as the impacting direction of the projectile. Similar elliptical craters are observed elsewhere on Mars, as well as on our Moon.

The colour scenes have been derived from the three HRSC-colour channels and the nadir channel. The perspective views have been calculated from the digital terrain model derived from the stereo channels.

Color view of ‘butterfly’-shaped crater at Hesperia Planum. Image credit: ESA Click to enlarge

The 3D anaglyph image was calculated from the nadir and one stereo channel. Image resolution has been decreased for use on the internet.

Original Source: ESA Mars Express