The Milky Way Shines in X-Rays Too

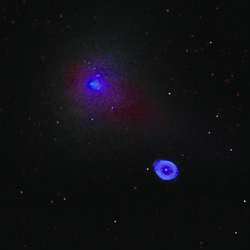
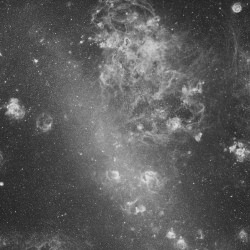
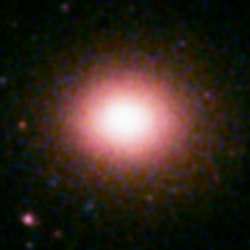
The X-ray background consists of a huge number of faint objects. Image credit: NASA Click to enlarge
Using the most sensitive X-ray map of the Galaxy, obtained combining 10 years of data of Rossi XTE orbital observatory, scientists from the Max Planck Institute for Astrophysics have discovered the origin of the galactic background emission. They show that it consists of emission from a million accreting white dwarf binaries and hundreds of millions of normal stars with active coronas.

Nearly 400 years after Galileo determined that the wispy Milky Way actually comprises a multitude of individual stars, scientists using NASA’s Rossi X-ray Timing Explorer have done the same for the X-ray Milky Way.

The origin of the so-called galactic X-ray background has been a long-standing mystery. Scientists now say that this blanket of X-ray light is not diffuse, as many have thought, but emanates from untold hundreds of millions of individual sources dominated by a type of dead star called a white dwarf.

If confirmed, this new finding would have a profound impact on our understanding of the history of our galaxy, from star-formation and supernova rates to stellar evolution. The results solve major theoretical problems, yet point to a surprising undercounting of stellar objects.

Scientists from the Max Planck Institute for Astrophysics (MPA) in Garching, Germany, and the Space Research Institute of the Russian Academy of Sciences in Moscow discuss these results in two papers published in Astronomy & Astrophysics.

“From an airplane you can see a diffuse glow from a city at night,” said Dr. Mikhail Revnivtsev of MPA, lead author on one of the papers. “To say a city produces light is not enough. Only when you get closer do you see individual sources that make up that glow – the house lights, street lamps and automobile headlights. In this respect, we have identified the individual sources of local X-ray light. What we found will surprise many scientists.”

X-rays are a high-energy form of light, invisible to our eyes and far more energetic than optical and ultraviolet light. Our eyes see individual stars sprinkled in a largely dark sky. In X-ray bandwidths the sky is never dark; there is a pervasive and constant glow.

Previous observations could not reveal enough X-ray sources to account for the “X-ray milky way.” This led to theoretical problems. If the X-ray glow were from hot and diffuse gas, it would ultimately “rise” and escape the confines of the galaxy. Furthermore, all that hot gas would need to have come from millions of past star explosions called supernovae, which would imply that estimates of star formation and star death were way off.

“X-ray telescopes can resolve the emission into discrete sources but can only account for about 30 percent of the emission,” said Dr. Jean Swank, project scientist for the Rossi Explorer at NASA Goddard Space Flight Center in Greenbelt, Maryland, USA. “Many have thought that the lion’s share was truly diffuse, for example, from hot gas between the stars. Now it seems that it can all be accounted for a combination of two types of stars.”

The new study is based on nearly 10 years of data collected by the Rossi Explorer and constitutes the most thorough map of the galaxy in X-ray bandwidths. The science team concluded that the Milky Way galaxy is indeed teeming with X-ray stars, most of them not very bright, and that scientists over the years had underestimated their numbers by perhaps a hundredfold.

Surprisingly, the usual suspects of X-ray emission – black holes and neutron stars – are not implicated here. At higher X-ray energies, the X-ray glow arises almost entirely from sources called cataclysmic variables.

A cataclysmic variable is a binary star system containing a relatively normal star and a white dwarf, which is a stellar ember of a star like our sun that has run out of fuel. On its own, a white dwarf is dim. In a binary, it can pull away matter from its companion star to heat itself in a process called accretion. The accreted gas is very hot, a source of considerable X-rays.

At slightly lower X-ray energies, the glow is a mix of about one-third cataclysmic variables and two-thirds active stellar coronas. Most of the stellar corona activity also takes place in binaries, where a nearby companion effectively stirs up the outer parts of the star. This energizes the stellar analogue to produce solar flares, which emits X-rays. The science team says there are upwards of a million cataclysmic variables in our galaxy and close to a billion active stars. Both of these numbers reflect a major undercounting in previous estimates.

“Like a medical x-ray, the chart of the galactic X-ray background reveals details of the Milky Way’s structure,” said Revnivtsev. “We can see through the whole galaxy and count X-ray sources. This is very important to astronomers who calculate the lives of stars.”

NASA Goddard Space Flight Center in Greenbelt, Maryland, USA manages the Rossi Explorer, which was launched in December 1995.

Original Source: Max Planck Society

Saturn’s Feathery Northern Clouds

Saturn’s northern hemisphere. Image credit: NASA/JPL/SSI Click to enlarge
After a year and a half in orbit, the Cassini spacecraft has begun to image Saturn’s northern hemisphere in detail. The northern latitudes currently are experiencing winter, and atmospheric scientists are interested in determining whether the winter hemisphere is systematically different in appearance than the sunnier southern hemisphere.

This scene contains a great deal of bright, whorl-shaped cloud activity.

The image was taken in visible light with the Cassini spacecraft narrow-angle camera on Jan. 6, 2006, at a distance of approximately 2.9 million kilometers (1.8 million miles) from Saturn. The image scale is 17 kilometers (11 miles) per pixel.

The Cassini-Huygens mission is a cooperative project of NASA, the European Space Agency and the Italian Space Agency. The Jet Propulsion Laboratory, a division of the California Institute of Technology in Pasadena, manages the mission for NASA’s Science Mission Directorate, Washington, D.C. The Cassini orbiter and its two onboard cameras were designed, developed and assembled at JPL. The imaging operations center is based at the Space Science Institute in Boulder, Colo.

For more information about the Cassini-Huygens mission visit http://saturn.jpl.nasa.gov . The Cassini imaging team homepage is at http://ciclops.org .

Original Source: NASA/JPL/SSI News Release

The Sky is Full of Black Holes

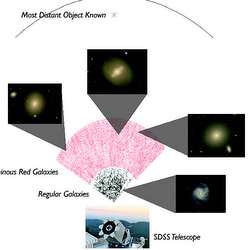
X-ray image of the Chandra Deep Field-North. Image credit: NASA/PSU Click to enlarge
Data from X-ray observatory surveys show that black holes are much more numerous and evolved differently than researchers would have expected, according to a Penn State astronomer.

“We wanted a census of all the black holes and we wanted to know what they are like,” said Niel Brandt, professor of astronomy and astrophysics. “We also wanted to measure how black holes have grown over the history of the Universe.”

Brandt and other researchers have done just that by looking at a patch of sky in the Northern hemisphere called the Chandra Deep Field-North, using NASA’s Chandra X-ray Observatory and a similar patch in the Southern hemisphere called the Extended Chandra Deep Field-South. Surveys also are being carried out in other parts of the sky using both Chandra and the European Space Agency’s X-ray Multi-Mirror Mission-Newton.

The researchers looked at X-ray emissions because areas around black holes emit X-rays as well as visible light. The penetrating nature of X-rays provides a direct way to identify the black holes. Using X-rays also enables astronomers to pinpoint the black holes at the centers of galaxies without their signal being washed out by the visible light coming from a galaxy’s stars, Brandt told attendees at the annual meeting of the American Association for the Advancement of Science in St. Louis, Mo. Feb. 17. The black holes they studied were those that reside at the centers of galaxies and are actively emitting X-rays, therefore they are called active galactic nuclei.

“We find active super massive black holes at the centers of massive galaxies,” said Brandt. “Our galaxy also has its own black hole at its center measuring 2.6 million solar masses. Our black hole is not active today, but we presume it was active in the past.”

These deep, extragalactic X-ray surveys looked at carefully chosen patches of sky, that are largely free of anything that might interfere with obtaining the X-ray data. Chandra looked at the Chandra Deep Field-North — an area of sky two thirds the size of the full Moon — for the time span of 23 days over a two-year period. The researchers detected about 600 X-ray sources. After comparing the X-ray images with optical images of exactly the same slice of sky taken by the Hubble Space Telescope, nearly all 600 point sources corresponded to optical galaxies, suggesting that the black holes that were sources for the X-ray signature were in the centers of galaxies.

“X-ray astronomers are doing better than anyone else by about a factor of ten, in identifying these active galactic nuclei” said Brandt. “With more time we could do even better, going even deeper.”

What the researchers found was that super massive black holes are more numerous than we might have expected. They also found that black holes evolved differently than astronomers expected prior to the Chandra work. Extrapolating from the 600 black holes found by Chandra, Brandt suggests that there are about 300 million super massive black holes in the whole sky.

The existence of so many black holes, confirmed that what was once thought to be a truly diffuse cosmic X-ray background radiation, actually comes from point sources.

In the 1960s, astronomers discovered quasars, very distant, highly luminous black holes, in galactic centers. Quasars, initially called quasi-stellar radio sources, were studied intensely. Researchers soon realized that only some of these objects were radio emitters and that they formed early in the history of the Universe.

“While quasars are spectacular, they are not representative of typical active galactic nuclei,” said Brandt. “Now, using Chandra and other X-ray observatories, we can find and study the moderate-luminosity, typical active galactic nuclei in the distant, high-redshift Universe.”

Quasars and moderate-luminosity active galactic nuclei also evolved differently. Quasars are a phenomenon of young galaxies, while moderate-luminosity, active galactic nuclei peaked later in cosmic time.

“We would like to know if active galactic nuclei change over cosmic time,” said Brandt. “Do black holes feed and grow in the same way over the history of the Universe?”

Researchers looked at the relative amount of power coming out in X-rays compared to other wavelengths and found that this ratio does not change over 13 billion years of time. They looked at the X-ray spectra and found that these also did not change through time.

“Despite the enormous changes in the space density of back holes, the individual engines powering active galactic nuclei are remarkably stable,” Brandt said.

Brandt believes that Chandra could observe the Chandra Deep Field-North for a longer period of time and obtain more sensitive, deeper data. This would bring to light galaxies that are currently obscured. It would also gather more X-rays allowing better X-ray spectral and variability analyses. With more sensitive probing, the researchers are also detecting an increasing number of non-active galaxies like our own.

“Chandra has worked well for six years now,” said Brandt. “There is no reason why Chandra and Newton cannot continue to observe for another 10 or more years.”

Original Source: PSU News Release

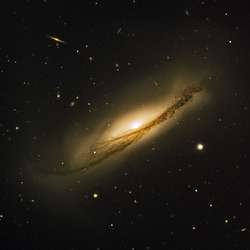
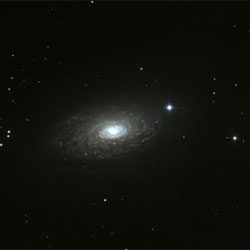
The Sombrero Galaxy by Adam Block and Morris Wade

The Sombrero Galaxy by Adam Block/Morris Wade/NOAO/AURA/NSF
Located 28 million light years from our planet and rushing away at over 700 miles a second, the Sombrero Galaxy has some impressive statistics: it spans over 50,000 light years, it contains the mass of 800 billion suns and is surrounded by over 2 thousand globular clusters – nearly ten times as many as our own Milky Way. The glowing central region is home to a monster producing a tremendous amount of X-rays. Most astronomers believe it’s an enormous black hole over a billion times more massive than our sun.

The prominent dust lane that cuts horizontally across the edge coupled with the bulge near the center gives the galaxy a hat-like appearance, thus the common name of Sombrero. Slightly too faint to be seen by naked eye, the Sombrero, which is located in the constellation of Virgo, appears to be approximately 1/5 as large as the Moon from our vantage point on Earth.

This picture was taken by Adam Block and Morris Wade using a 20 inch, f/8 RCOS Ritchey-Chretien telescope and a three mega-pixel SBIG astronomical camera at the Kitt Peak National Observatory Visitor Center outside of Tucson, Arizona. The observatory operates an Advanced Observing Program most nights of the year where interested visitors regardless of previous experience can pre-arrange to take amazing astronomical photos like this. This image was produced after two and one half hours of total exposure. Post production processing included two iterations of deconvolution, which increases sharpness, and use of DDP, a digital enhancement technique which helps display both the very faint and very bright parts of the image simultaneously.

Do you have photos you’d like to share? Post them to the Universe Today astrophotography forum or email them, and we might feature one in Universe Today.

Written by R. Jay GaBany

The Shadow of Phobos

Black and white view of Phobos’s shadow. Image credit: ESA Click to enlarge
This image, taken by the High Resolution Stereo Camera (HRSC) on board ESA’s Mars Express spacecraft, shows the fast-moving shadow of the moon Phobos as it moved across the Martian surface.

The HRSC obtained this unique image during orbit 2345 on 10 November 2005. These observations would not have been possible without the close co-operation between the camera team at the Institute of Planetary Research at DLR and the ESA teams, in particular the mission engineers at ESA’s European Space Operations Centre (ESOC) in Darmstadt, Germany.

They confirm the model of the moon’s orbit around Mars, as it was determined earlier in 2004 also on the basis of HRSC images. They also show that with accurate planning even moving objects can be captured exactly at their predicted position.

The basis for such observations is the accurate knowledge of the spacecraft position in its orbit as well as of the targeted location on Mars to within a few hundred metres.

Phobos is the larger of the two Martian moons, 27 kilometres by 22 kilometres in size, and travels around Mars in an almost circular orbit at an altitude of about 6000 kilometres. Phobos takes slightly more than 7.5 hours to complete a full revolution around the planet.

When it is between the Sun and Mars, Phobos casts a small and diffuse shadow onto the Martian surface. To an observer on Mars, this would appear as a very quick eclipse of the Sun. This is similar to an eclipse on Earth, when the Moon covers the solar disk but much slower.

The shadow of Phobos has an elliptical shape on the Martian surface, because the shadow’s cone hits the surface at an oblique angle. This shadow appears to be distorted even more because of the imaging technique of the HRSC.

The shadow moves across the surface with a speed of roughly 7200 kilometres per hour from west to east. The spacecraft travels with a higher speed of about 12 600 kilometres per hour on its almost polar orbit from south to north.

Since HRSC scans the surface synchronised with the flight velocity of Mars Express, it takes some time to cover the shadow in its full dimension. Within this short time, however, the moon moves on, and therefore the shape of its shadow is ‘smeared’ in the HRSC image.

Another phenomenon, that the shadow is darker at its centre than the edges, can be explained by again imagining the observer on Mars. With its small size, Phobos would only cover some 20% of the solar disk.

Even if the observer stood in the centre of the shadow, they would still be illuminated by the uncovered part of the Sun’s disk, in a partial solar eclipse instead of a total eclipse.

Members of the HRSC Science Team recalculated the orbit of Phobos on the basis of images taken in 2004. With the help of the improved orbit determination ? the moon has advanced about 12 kilometres with respect to its previously predicted position along its orbit ? it was possible to calculate those precise times when the shadow observations could be made. In turn, it was possible to verify the accuracy of the improved orbit determination by the shadow’s position in the new images.

Original Source: ESA Portal

Tethys and Titan

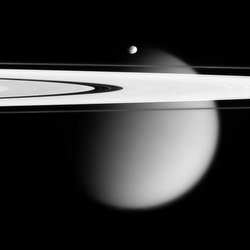
The two moons Titan and Tethys with its great crater Odysseus. Image credit: NASA/JPL/SSI Click to enlarge
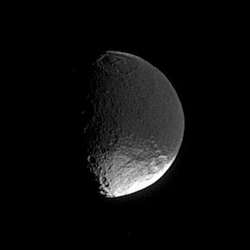
Cassini looks toward Tethys and its great crater Odysseus, while at the same time capturing veiled Titan in the distance (at left).

Titan (5,150 kilometers, or 3,200 miles across) is shrouded in a thick, smog-like atmosphere in which many small, potential impactors burn up before hitting the moon’s surface. Crater-pocked Tethys (1,071 kilometers, or 665 miles across) has no such protective layer, although even a thick blanket of atmosphere would have done little good against the impactor that created Odysseus.

The eastern limb of Tethys is overexposed in this view.

The image was taken in visible light with the Cassini spacecraft narrow-angle camera on Jan. 6, 2006, at a distance of approximately 4 million kilometers (2.5 million miles) from Titan and 2.7 million kilometers (1.7 million miles) from Tethys. The image scale is 25 kilometers (16 miles) per pixel on Titan and 16 kilometers (10 miles) per pixel on Tethys.

The Cassini-Huygens mission is a cooperative project of NASA, the European Space Agency and the Italian Space Agency. The Jet Propulsion Laboratory, a division of the California Institute of Technology in Pasadena, manages the mission for NASA’s Science Mission Directorate, Washington, D.C. The Cassini orbiter and its two onboard cameras were designed, developed and assembled at JPL. The imaging operations center is based at the Space Science Institute in Boulder, Colo.

For more information about the Cassini-Huygens mission visit http://saturn.jpl.nasa.gov . The Cassini imaging team homepage is at http://ciclops.org .

Original Source: NASA/JPL/SSI News Release

Mars Express Finds Auroras on Mars

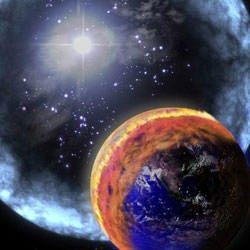
An artist’s illustration of aurorae on night-side of Mars. Image credit: M. Holmstrom (IRF) Click to enlarge
ESA’s Mars Express spacecraft has seen more evidence that aurorae occur over the night side of Mars, especially over areas of the surface where variations in the magnetic properties of the crust have been detected.

Observations from the ASPERA instrument on board ESA’s Mars Express spacecraft show structures (inverted-V features) of accelerated electrons and ions above the night side of Mars that are almost identical to those that occur above aurorae on Earth.

Aurorae are spectacular displays often seen at the highest latitudes on Earth. On our planet, as well as on the giant planets Jupiter, Saturn, Uranus and Neptune, they occur at the foot of the planetary magnetic field lines near the poles, and are produced by charged particles ? electrons, protons or ions ? precipitating along these lines.

“Aurorae are created when energetic charged particles collide with the upper atmosphere,” says Rickard Lundin, Principal Investigator for ASPERA, from the Swedish Institute of Space Physics Physics (IRF), Kiruna, Sweden.

“When they are decelerated, energy is released that causes emissions of light – aurorae. During strong aurorae the precipitating particles are accelerated and gain energy, leading to more intense light,” said Lundin.

The scientists have found that the energy flux of the precipitating particles is large enough that it would lead to aurorae comparable to those of weak or medium intensity at Earth.

“Mars lacks a strong intrinsic magnetic or dipole field, and therefore we have not had reason to believe that aurorae occur there,” said Lundin.

A few years ago it was suggested that auroral phenomena could exist on Mars too. This hypothesis was reinforced by the Mars Global Surveyor discovery of ‘crustal magnetic anomalies’, most likely the remnants of an old planetary magnetic field.

This discovery started speculation that auroras could also occur at Mars. In 2004, the SPICAM instrument on board Mars Express observed emissions of light during a magnetic anomalies investigation – emissions that could be due to precipitating energetic particles.

The ASPERA scientists have now found that the structures of accelerated particles are indeed associated with the ‘crustal magnetic anomalies’ at Mars, but that strong acceleration mainly occurs in a region close to local midnight.

The precise emissions of light that occur remain to be studied since the composition of the upper atmosphere on the night side is not well known. On the basis of atmospheric models, the scientists speculate that the classical ‘green’ emission line of oxygen might be present.

“But, as we see Mars as always sunlit, the aurorae on the night side of Mars cannot be observed from Earth,” added Lundin.

Original Source: ESA Portal

Venus Express Tests its Engine

Venus Express main engine firing in space. Image credit: ESA Click to enlarge
One hundred days after beginning its cruise to Venus, ESA’s Venus Express spacecraft successfully tested its main engine for the first time in space.

The main engine test is a critical step in the mission. In fact, it is due to its powerful thrust that Venus Express will be able to ‘brake’ on arrival at Venus. The spacecraft must slow down in order to be captured in orbit around the planet.

The engine was fired during the night of 16/17 February, starting at 01:27 CET (00:27 UT) and the ‘burn’ lasted for about three seconds. Thanks to this engine burn, the spacecraft changed its velocity by almost three metres per second.

About one hour later, the data received from the spacecraft by the Venus Express ground control team (via ESA’s New Norcia antenna in Australia) revealed that the test was successful.

The engine performed as expected. The spacecraft reacted correctly to the push and was able to recover the control of its attitude and to correctly point its high-gain antenna back to Earth to communicate with ground control.

All data recorded during the burn will now be carefully analysed by Astrium (who built the spacecraft) and ESA’s engineers to study the performance of the engine in detail.

The next big milestone is the Venus Orbit Insertion manoeuvre on 11 April 2006, which will require the main engine firing sequence to operate for about 51 minutes in the opposite direction to the spacecraft motion. This braking will allow the spacecraft to counteract the pull of the Sun and Venus, and to start orbiting the planet.

Venus Express is currently at a distance of about 47 million kilometres from Earth.

Original Source: ESA Portal

Greenland Ice Loss Doubled in the Past Decade

Helheim Glacier, located in southeast Greenland. Image credit: NASA/JPL Click to enlarge
The loss of ice from Greenland doubled between 1996 and 2005, as its glaciers flowed faster into the ocean in response to a generally warmer climate, according to a NASA/University of Kansas study.

The study will be published tomorrow in the journal Science. It concludes the changes to Greenland’s glaciers in the past decade are widespread, large and sustained over time. They are progressively affecting the entire ice sheet and increasing its contribution to global sea level rise.

Researchers Eric Rignot of NASA’s Jet Propulsion Laboratory, Pasadena, Calif., and Pannir Kanagaratnam of the University of Kansas Center for Remote Sensing of Ice Sheets, Lawrence, used data from Canadian and European satellites. They conducted a nearly comprehensive survey of Greenland glacial ice discharge rates at different times during the past 10 years.

“The Greenland ice sheet’s contribution to sea level is an issue of considerable societal and scientific importance,” Rignot said. “These findings call into question predictions of the future of Greenland in a warmer climate from computer models that do not include variations in glacier flow as a component of change. Actual changes will likely be much larger than predicted by these models.”

The evolution of Greenland’s ice sheet is being driven by several factors. These include accumulation of snow in its interior, which adds mass and lowers sea level; melting of ice along its edges, which decreases mass and raises sea level; and the flow of ice into the sea from outlet glaciers along its edges, which also decreases mass and raises sea level. This study focuses on the least well known component of change, which is glacial ice flow. Its results are combined with estimates of changes in snow accumulation and ice melt from an independent study to determine the total change in mass of the Greenland ice sheet.

Rignot said this study offers a comprehensive assessment of the role of enhanced glacier flow, whereas prior studies of this nature had significant coverage gaps. Estimates of mass loss from areas without coverage relied upon models that assumed no change in ice flow rates over time. The researchers theorized if glacier acceleration is an important factor in the evolution of the Greenland ice sheet, its contribution to sea level rise was being underestimated.

To test this theory, the scientists measured ice velocity with interferometric synthetic-aperture radar data collected by the European Space Agency’s Earth Remote Sensing Satellites 1 and 2 in 1996; the Canadian Space Agency’s Radarsat-1 in 2000 and 2005; and the European Space Agency’s Envisat Advanced Synthetic Aperture Radar in 2005. They combined the ice velocity data with ice sheet thickness data from airborne measurements made between 1997 and 2005, covering almost Greenland’s entire coast, to calculate the volumes of ice transported to the ocean by glaciers and how these volumes changed over time. The glaciers surveyed by those satellite and airborne instrument data drain a sector encompassing nearly 1.2 million square kilometers (463,000 square miles), or 75 percent of the Greenland ice sheet total area.

From 1996 to 2000, widespread glacial acceleration was found at latitudes below 66 degrees north. This acceleration extended to 70 degrees north by 2005. The researchers estimated the ice mass loss resulting from enhanced glacier flow increased from 63 cubic kilometers in 1996 to 162 cubic kilometers in 2005. Combined with the increase in ice melt and in snow accumulation over that same time period, they determined the total ice loss from the ice sheet increased from 96 cubic kilometers in 1996 to 220 cubic kilometers in 2005. To put this into perspective, a cubic kilometer is one trillion liters (approximately 264 billion gallons of water), about a quarter more than Los Angeles uses in one year.

Glacier acceleration has been the dominant mode of mass loss of the ice sheet in the last decade. From 1996 to 2000, the largest acceleration and mass loss came from southeast Greenland. From 2000 to 2005, the trend extended to include central east and west Greenland.

“In the future, as warming around Greenland progresses further north, we expect additional losses from northwest Greenland glaciers, which will then increase Greenland’s contribution to sea level rise,” Rignot said.

For information about NASA and agency programs on the Web, visit:
http://www.nasa.gov/home.

For University of Kansas Center for Remote Sensing of Ice Sheets information, visit:
http://www.cresis.ku.edu/flashindex.htm.

JPL is managed for NASA by the California Institute of Technology in Pasadena.

Original Source: NASA News Release

Book Review: Europa, the Ocean Moon

The moon Europa orbits the giant gas planet Jupiter. The recent Galileo probe and the more dated Voyager probe traveled past this moon and, with their collection of sensors, they took measurements. Galileo, even with its failed main communication antenna, was kept busy taking pictures. Some images filled in the blanks remaining from Voyager. Others were high resolution views of noteworthy features. Other sensors already revealed that a water-ice layer lies overtop an earthen core. However, there are almost no craters. So the surface is relatively new. No one knows how the surface refreshes itself but one option is for local heat from the ground to melt the overburden of ice. Of course, water, heat and some other choice ingredients are the ingredients for life. This possibility is what gives Europa its present allure.

Europa is front and centre throughout this book and in it Greenberg pushes a number of related agendas. First and foremost he classifies aspects of the images and associates them to possible causes. There is no expectation for the viewer to be a wiz as Greenberg starts slow and builds up. A history lesson begins the book. Galileo’s personal observations start the ball rolling, then Greenberg continues on with eccentricity, rotation, tides and stresses. The detail can get nitty-gritty, but not to such a depth as to loose the general reader. Suffice it to say that he’s very thorough with his description of the likely forces at play on Europa’s surface.

Having completed this background, Greenberg goes on to describe each of the classifications he and his team made from the images. Using the complete set transmitted by the Galileo probe, he presents, in a clear and thorough fashion; exotic ridges, bounding cycloids, complex chaos areas and spotty lentiuclae. But he doesn’t just leave the descriptions standing on their own. For each he provides an hypothesis for their formation and often he supports these with results from computer simulation. Further, ready references to nearby black and white or colour images allow the reader to also view the special shapes. Greenberg’s explanations are clear, succinct and well supported.

Another agenda that Greenberg raises in this book regards the politics of scientific exploration. Though Greenberg is part of the Galileo Imaging Team, he bemoans its seemingly military structure over his preferred equal weighted collective. His concern is that science might become subject to personal issues. As such, there are many references to Greenberg or a member of his team being harangued by the status quo who were supporting their own canonical model. Because of this, an interesting undertone of uncertainty exists throughout the book as well as perhaps a tinge of animosity. Yet, these don’t distract from the science and do add a certain human perspective to the writing.

A final agenda or objective is an apparent desire to capture and store hard won knowledge. The perception is that the research funding is running out and the team members are disbanding. Hence, for posterity’s sake, the results of many years’ and many peoples’ work are brought together between two covers.

Though relying upon little technical information, Greenberg has written an exemplary book. Chapters stand well on their own and each leads smoothly into the next. The sum total defines a comprehensive hypothesis regarding the shaping of Europa’s surface. Sub-theories have a sound basis and each have an excellent description. A plethora of images allow the reader to appreciate the team’s challenges and their hard won results. Because of this, the book is a solid, self-contained overview of Europa that would be a great reference for a researcher or an interesting read for anyone wanting to check-out what’s happening at one of the leading edges of planetary science.

Being at the forefront of science is exhilarating on its own. Sharing the wonders with other people increases the satisfaction even more. Richard Greenberg’s Europa, The Ocean Moon summarizes his research and that of his colleagues resulting from the Galileo probe’s mission to Jupiter. Europa’s ice surface may seem haphazard in construct but with intuition and perception, we can see how science can make reason out of this exotic world.

Review by Mark Mortimer

Read more reviews online or purchase a copy from Amazon.com