What’s Up 2006 – Printed Version Available

After releasing What’s Up 2006 as an ebook, the biggest question we got was, “can I buy a printed copy?” I’m happy to report that the answer is now, “Yes!” Follow this link to go to Lulu.com. You can purchase a softcover edition of the book for $20.00 USD. Not bad for a 409-page book. We took the time and redid the pages and photos in the book so they look better printed, so I think you’ll be really happy with the result. The downloadable version is still completely free, but if you really like your words on paper, you’ve got that option too.

Click here to learn more.

Fraser Cain
Publisher
Universe Today

The Early Universe Was Unkind to Life’s Building Blocks

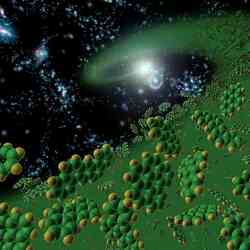
Artist’s concept symbollically represents early universe organic complex compounds. Image credit: NASA/JPL Click to enlarge
By studying distant galaxies with the Spitzer space telescope, researchers have come to the conclusion that the intense radiation of infant galaxies was very destructive to life’s building blocks. Shortly after the Big Bang, these young galaxies blazed in star formation, but they had very few organic molecules – which are quite common in older galaxies. Even through these organic molecules will be forming in young stars, their intense radiation destroys them again.

The components of life may have been under attack in the hostile environments of the universe’s first galaxies, say astronomers using NASA’s Spitzer Space Telescope.

A science team led by graduate student Yanling Wu of Cornell University, Ithaca, N.Y., recently came to this conclusion after studying the formation and destruction of polycyclic aromatic hydrocarbons molecules (PAHs) in more than 50 blue compact dwarf (BCD) galaxies. These organic molecules, comprised of hydrogen and carbon, are believed by many scientists to be among the building blocks for life.

“One of the outstanding problems in astronomy today is whether complex organic molecules of hydrogen and carbon, similar to those responsible for life on Earth, are present in the early universe,” says Wu.

According to Wu, mature massive galaxies like our Milky Way formed from the merging of smaller galaxies, probably about the size of nearby BCD galaxies. Since current technology is not sensitive enough to easily identify and study in detail the universe’s first galaxies, astronomers must infer the physical properties of the early structures by observing similar nearby galaxies like BCDs.

“We believe that BCD galaxies are similar to the universe’s first galaxies because they are infant galaxies, actively forming stars, and are not very chemically polluted,” said Wu.

Because most atomic elements other than hydrogen and helium are born from the death of stars, astronomers suspect that in the first few million years after the big bang galaxies were not “chemically polluted” with elements other than hydrogen and helium. In astronomy, these relatively unpolluted galaxies are said to have low metallicity.

The BCD galaxies’ blue colors tell astronomers that these structures are actively forming massive stars. By logically combining the galaxy’s blue color with the fact that it is low in metals, astronomers can infer that this is a young galaxy.

In her research, Wu found that nearby BCD galaxies with lowest metallicity also had little or no PAHs. As the galaxies became more chemically polluted, more traces of PAHs were found. She notes that this phenomenon makes sense because heavy metal elements like carbon are formed from the death of stars, and some of these galaxies may just be too “young” to have produced enough carbon to create PAHs.

However, in some of the BCD galaxies where the conditions allow for the formation of PAHs, Wu found that those molecules were being destroyed by intense ultraviolet radiation from the young massive stars.

“Because BCD galaxies are metal poor and very compact, the intense ultraviolet radiation from young stars will destroy PAH molecules even if they are formed,” says Wu. “The threshold for when these PAH molecules stop being destroyed is still uncertain.”

“This leads to an interesting paradox, where the young stars responsible for the formation of PAHs may also be the main culprit of their destruction,” adds co-author Dr. Vassilis Charmandaris, of the University of Greece, Heraklion.

The organic PAHs were detected using Spitzer’s Infrared Spectrometer (IRS).

“Yanling has made significant progress in a research area first opened by International Space Observatory ,” says Dr. Jim Houck of Cornell University. Houck is Wu’s academic advisor and a co-author of the paper. He is also the Principal Investigator for Spitzer’s IRS instrument and played a vital role in its creation.

“With Spitzer, Yanling is able to extend BCDs observations to a much larger sample; the new results provide a glimpse into the formation of galaxies in the early Universe,” he adds.

Wu’s paper will be published in a March issue of Astrophysical Journal. For more information on this discovery please listen to the podcast interview with Yanling Wu.

Original Source: Spitzer Space Telescope

The Part-Time Pulsar

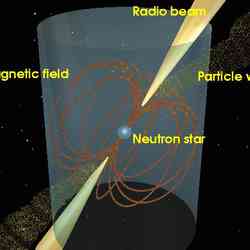
The current understanding of a pulsar. Image credit: Jodrell Bank Observatory. Click to enlarge
Astronomers have discovered a very unusual pulsar that seems to switch off from time to time. It looks like a normal pulsar for about a week, blasting out radio waves, and then goes silent for about a month. This pulsar is slowing down its rate of rotation, but this deceleration increases when it’s active. This braking mechanism is related to the powerful radio emissions. During its active phase, a wind of particles is spewed off, stealing some of its rotational energy.

Astronomers using the 76-m Lovell radio telescope at the University of Manchester’s Jodrell Bank Observatory have discovered a very strange pulsar that helps explain how pulsars act as ‘cosmic clocks’ and confirms theories put forward 37 years ago to explain the way in which pulsars emit their regular beams of radio waves – considered to be one of the hardest problems in astrophysics. Their research, now published in Science Express, reveals a pulsar that is only ‘on’ for part of the time. The strange pulsar is spinning about its own axis and slows down 50% faster when it is ‘on’ compared to when it is ‘off’.

Pulsars are dense, highly magnetized neutron stars that are born in a violent explosion marking the death of massive stars. They act like cosmic lighthouses as they project a rotating beam of radio waves across the galaxy. Dr Michael Kramer explains, “Pulsars are a physicist’s dream come true. They are made of the most extreme matter that we know of in the Universe, and their highly stable rotation makes them super-precise cosmic clocks – but, embarrassingly, we do not know how these clocks work. This discovery goes a long way towards solving this problem.”

The current understanding of a pulsar. The central neutron star is highly magnetised and emits a radio beam along its magnetic axis, which is inclined to the rotation axis. The strong magnetic field eventually leads to the extraction of particles from the surface, filling the surrounding, so-called magnetosphere with plasma. The size of the magnetosphere is given by the distance where plasma co-rotation reaches the speed of light, the so-called light-cylinder. The plasma creating the radio emission eventually leaves the light cylinder as a pulsar wind, which provides a torque onto the pulsar, contributing about 50% to its observed slow-down in rotation.

The research team, led by Dr Kramer, found a pulsar that is only periodically active. It appears as a normal pulsar for about a week and then “switches off” for about one month before emitting pulses again. The pulsar, called PSR B1931+24, is unique in this behaviour and affords astronomers an opportunity to compare its quiet and active phases. As it is quiet the majority of the time, it is difficult to detect, suggesting that there may be many other similar objects that have, so far, escaped detection.

Prof Andrew Lyne points out that, “After the discovery of pulsars, theoreticians proposed that strong electric fields rip particles out of the neutron star surface into a surrounding magnetised cloud of plasma called the magnetosphere – but, for nearly 40 years, there had been no way to test whether our basic understanding was correct.”

The University of Manchester astronomers were delighted when they found that this pulsar slows down more rapidly when the pulsar is on than when it is off. Dr Christine Jordan points out the importance of this discovery, “We can clearly see that something hits the brakes when the pulsar is on.”

This breaking mechanism must be related to the radio emission and the processes creating it and the additional slow-down can be explained by a wind of particles leaving the pulsar’s magnetosphere and carrying away rotational energy. “Such a braking effect of the pulsar wind was expected but now, finally, we have observational evidence for it” adds Dr Duncan Lorimer.

The amount of braking can be related to the number of charges leaving the pulsar magnetosphere. Dr Kramer explains their surprise when it was found that the resulting number was within 2% of the theoretical predictions. “We were really shocked when we saw these numbers on our screens. Given the pulsar’s complexity, we never really expected the magnetospheric theory to work so well.”

Prof Lyne summarized the result: “It is amazing that, after almost 40 years, we have not only found a new, unusual, pulsar phenomenon but also a very unexpected way to confirm some fundamental theories about the nature of pulsars.”

Original Source: PPARC News Release

Antarctica is Melting Faster

Antarctica. Image credit: Ben Holt, Sr. Click to enlarge
Researchers have completed the first comprehensive survey of Antarctic ice mass; not surprisingly, ice loss is on the rise – mostly from the West Antarctic ice shelf. From 2002 to 2005, the continent lost enough ice to raise global sea levels by about 1.2 mm (0.05 inches). The measurements were made by the GRACE satellite, which detects slight changes in the Earth’s gravity field over time. This is the most accurate estimate of Antarctic ice loss ever made.

The first-ever gravity survey of the entire Antarctic ice sheet, conducted using data from the NASA/German Aerospace Center Gravity Recovery and Climate Experiment (Grace), concludes the ice sheet’s mass has decreased significantly from 2002 to 2005.

Isabella Velicogna and John Wahr, both from the University of Colorado, Boulder, conducted the study. They demonstrated for the first time that Antarctica’s ice sheet lost a significant amount of mass since 2002. The estimated mass loss was enough to raise global sea level about 1.2 millimeters (0.05 inches) during the survey period, or about 13 percent of the overall observed sea level rise for the same period. The researchers found Antarctica’s ice sheet decreased by 152 (plus or minus 80) cubic kilometers of ice annually between April 2002 and August 2005.

That is about how much water the United States consumes in three months (a cubic kilometer is one trillion liters; approximately 264 billion gallons of water). This represents a change of about 0.4 millimeters (.016 inches) per year to global sea level rise. Most of the mass loss came from the West Antarctic ice sheet.

“Antarctica is Earth’s largest reservoir of fresh water,” Velicogna said. “The Grace mission is unique in its ability to measure mass changes directly for entire ice sheets and can determine how Earth’s mass distribution changes over time. Because ice sheets are a large source of uncertainties in projections of sea level change, this represents a very important step toward more accurate prediction, and has important societal and economic impacts. As more Grace data become available, it will become feasible to search for longer-term changes in the rate of Antarctic mass loss,” she said.

Measuring variations in Antarctica’s ice sheet mass is difficult because of its size and complexity. Grace is able to overcome these issues, surveying the entire ice sheet, and tracking the balance between mass changes in the interior and coastal areas.

Previous estimates have used various techniques, each with limitations and uncertainties and an inherent inability to monitor the entire ice sheet mass as a whole. Even studies that synthesized results from several techniques, such as the assessment by the Intergovernmental Panel on Climate Change, suffered from a lack of data in critical regions.

“Combining Grace data with data from other instruments such as NASA’s Ice, Cloud and Land Elevation Satellite; radar; and altimeters that are more effective for studying individual glaciers is expected to substantially improve our understanding of the processes controlling ice sheet mass variations,” Velicogna said.

The Antarctic mass loss findings were enabled by the ability of the identical twin Grace satellites to track minute changes in Earth’s gravity field resulting from regional changes in planet mass distribution. Mass movement of ice, air, water and solid earth reflect weather patterns, climate change and even earthquakes. To track these changes, Grace measures micron-scale variations in the 220-kilometer (137-mile) separation between the two satellites, which fly in formation.

Grace is managed for NASA by the Jet Propulsion Laboratory, Pasadena, Calif. The University of Texas Center for Space Research has overall mission responsibility. GeoForschungsZentrum Potsdam (GFZ), Potsdam, Germany, is responsible for German mission elements. Science data processing, distribution, archiving and product verification are managed jointly by JPL, the University of Texas and GFZ. The results will appear in this week’s issue of Science.

For information about NASA and agency programs on the Web, visit:
http://www.nasa.gov/home

For more information about Grace on the Web, visit:
http://www.csr.utexas.edu/grace ; and http://www.gfz-potsdam.de/grace

For University of Colorado information call Jim Scott at: (303) 492-3114.

JPL is managed for NASA by the California Institute of Technology in Pasadena.

Original Source: NASA News Release

Jupiter’s Next Great Red Spot

Red spots on Jupiter. Image credit: Christopher Go. Click to enlarge
If you’re an amateur astronomer with a reasonably good telescope, you might be able to see a new red spot on Jupiter. Its official name is Oval BA, and it’s half the size the of the famous Great Red Spot. It first appeared in 2000 when three smaller storms collided and merged together. It started out white, then changed to brown, and now it’s the same colour as the Great Red Spot. It’s possible that huge storms like this dredge material from deep beneath Jupiter’s cloud tops, and then ultraviolet light from the Sun changes it red.

Backyard astronomers, grab your telescopes. Jupiter is growing a new red spot.

Christopher Go of the Philippines photographed it on February 27th using an 11-inch telescope and a CCD camera:

The official name of this storm is “Oval BA,” but “Red Jr.” might be better. It’s about half the size of the famous Great Red Spot and almost exactly the same color.

Oval BA first appeared in the year 2000 when three smaller spots collided and merged. Using Hubble and other telescopes, astronomers watched with great interest. A similar merger centuries ago may have created the original Great Red Spot, a storm twice as wide as our planet and at least 300 years old.

At first, Oval BA remained white?the same color as the storms that combined to create it. But in recent months, things began to change:

“The oval was white in November 2005, it slowly turned brown in December 2005, and red a few weeks ago,” reports Go. “Now it is the same color as the Great Red Spot!”

“Wow!” says Dr. Glenn Orton, an astronomer at JPL who specializes in studies of storms on Jupiter and other giant planets. “This is convincing. We’ve been monitoring Jupiter for years to see if Oval BA would turn red – and it finally seems to be happening.” (Red Jr? Orton prefers “the not-so-Great Red Spot.”)

Why red?

Curiously, no one knows precisely why the Great Red Spot itself is red. A favorite idea is that the storm dredges material from deep beneath Jupiter’s cloudtops and lifts it to high altitudes where solar ultraviolet radiation–via some unknown chemical reaction?produces the familiar brick color.

“The Great Red Spot is the most powerful storm on Jupiter, indeed, in the whole solar system,” says Orton. The top of the storm rises 8 km above surrounding clouds. “It takes a powerful storm to lift material so high,” he adds.

Oval BA may have strengthened enough to do the same. Like the Great Red Spot, Red Jr. may be lifting material above the clouds where solar ultraviolet rays turn “chromophores” (color-changing compounds) red. If so, the deepening red is a sign that the storm is intensifying.

“Some of Jupiter’s white ovals have appeared slightly reddish before, for example in late 1999, but not often and not for long,” says Dr. John Rogers, author of the book “Jupiter: The Giant Planet,” which recounts telescopic observations of Jupiter for the last 100+ years. “It will indeed be interesting to see if Oval BA becomes permanently red.”

See for yourself: Jupiter is easy to find in the dawn sky. Step outside before sunrise, look south and up: sky map. Jupiter outshines everything around it. Small telescopes have no trouble making out Jupiter’s cloudbelts and its four largest moons. Telescopes 10-inches or larger with CCD cameras should be able to track Red Jr. with ease.

What’s next? Will Red Jr. remain red? Will it grow or subside? Stay tuned for updates.

Original Source: NASA News Release

Towering Cliffs at the Edge of Olympus Mons

The eastern scarp of the Olympus Mons volcano. Image credit: ESA Click to enlarge
This photograph was taken by ESA’s Mars Express spacecraft. It shows the eastern edge of the Olympus Mons volcano on Mars – the biggest mountain the Solar System. These huge cliffs tower above the relatively flat eastern plains around the mountain. The region has been covered repeatedly by lava flows, as recently as 200 million years ago.

This image, taken by the High Resolution Stereo Camera (HRSC) on board ESA’s Mars Express spacecraft, shows the eastern scarp of the Olympus Mons volcano on Mars.

The HRSC obtained this images during orbit 1089 with a ground resolution of approximately 11 metres per pixel. The image is centred at 17.5 North and 230.5 East. The scarp is up to six kilometres high in places.

The surface of the summit plateau’s eastern flank shows lava flows that have are several kilometres long and a few hundred metres wide.

Age determinations show that they are up to 200 million years old, in some places even older, indicating episodic geological activity.

The lowland plains, seen here in the eastern part of the image (bottom), typically have a smooth surface.

Several channel-like features are visible which form a broad network composed of intersecting and ‘anastomosing’* channels that are several kilometres long and up to 40 metres deep. (*Anastomising means branching extensively and crossing over one another, like veins on the back of your hand.)

Several incisions suggest a tectonic control, others show streamlined islands and terraced walls suggesting outflow activity.

Age determinations show that the network-bearing area was geologically active as recent as 30 million years ago.

Between the edge of the lowland plains and the bottom of the volcano slope, there are ‘wrinkle ridges’ which are interpreted as the result of compressional deformation. In some places, wrinkle ridges border the arch-like terraces at the foot of the volcano slope.

The colour scenes have been derived from the three HRSC-colour channels and the nadir channel. The perspective views have been calculated from the digital terrain model derived from the stereo channels.

The 3D anaglyph image was calculated from the nadir and one stereo channel.

Original Source: ESA Portal

Saturn’s Northern Lights Can Go Backwards

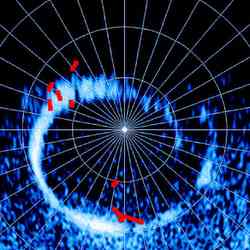
Electron particles are flying away from Saturn’s polar region. Image credit: University of Cologne. Click to enlarge
Auroras on Earth happen when the solar wind interacts with our planet’s magnetic field; electrons are accelerated downwards into the atmosphere, and we see the pretty lights in the sky. On Saturn; however, this process also goes in reverse. Most electrons are accelerated down, but others go in the opposite direction, away from the planet.

Polar lights are fascinating to look at on Earth. On other planets, they can also be spectacular. Scientists from the Max Planck Institute for Solar System Research in Katlenberg, Lindau, Germany, have now observed Saturn’s polar region using the particle spectrometer MIMI, on the Cassini Space Probe. They discovered electrons not only being accelerated toward the planet, but also away from it (Nature, February 9, 2006).

We can see polar lights on Earth when electrons above the atmosphere are accelerated downwards. They light up when they hit the upper atmosphere. Some years ago, researchers discovered that electrons inside the polar region can also be accelerated away from the Earth – that is, “backwards”. These anti-planetary electrons do not cause the sky to light up, and scientists have been puzzled about how they originate.

Until now it has also been unclear whether anti-planetary electrons only occur on Earth. An international team led by Joachim Saur at the University of Cologne have now found electrons on Saturn that are accelerated “backwards” – that is, in an anti-planetary direction. These particles were measured using “Magnetospheric Imaging Instruments” (MIMI) on NASA’s Cassini Space Probe. One of these instruments’ sensors, the “Low Energy Magnetospheric Measurement System” (LEMMS), was developed and built by scientists at the Max Planck Institute for Solar System Research.

The rotation of the space probe helped the researchers to determine the direction, number, and strength of the electron rays. They compared these results with recordings of the polar region and a global model of Saturn’s magnetic field. It turned out that the region of polar light matched up very well with the lowest point of the magnetic field lines in which electron rays were measured.

Because the electron ray is strongly focussed (with an angle of beam spread less than 10 degrees), the scientists were able to determine where its source lies: somewhere above the polar region, but inside a distance of maximum five radii of Saturn. Because the electron rays measured on the Earth, Jupiter, and Saturn are so similar, it appears that there must be some fundamental process underlying the creation of polar lights.

Doing these measurements, Norbert Krupp and his colleagues Andreas Lagg and Elias Roussos from the Max Planck Institute for Solar System Research worked closely with scientists from the Institute for Geophysics and Meteorology at the University of Cologne and the Applied Physics Laboratory of Johns Hopkins University in Baltimore. US scientists led by Tom Krimigis are responsible for service and coordination of the instrument on the Cassini Space Probe.

Original Source: Max Planck Society

Scientists are Starting to Understand Solar Cycles

The Sun taken by SOHO on Feb. 10, 2006. Image credit: SOHO Click to enlarge
Solar scientists think they’re finally getting a handle on predicting the Sun’s cycles. If everything goes as they predict, the next solar cycle will be 30-50% stronger, and be up to a year late. Astronomers have been tracking the two major flows of plasma that goven the Sun’s cycles. One acts like a conveyor belt, pulling plasma from the poles to the equator, and the other gets stretched since the Sun rotates faster at the equator than at the poles. This causes the Sun’s magnetic field to concentrate, creating the solar maximum.

Scientists predict the next solar activity cycle will be 30 to 50 percent stronger than the previous one and up to a year late. Accurately predicting the sun’s cycles will help plan for the effects of solar storms. The storms can disrupt satellite orbits and electronics; interfere with radio communication; damage power systems; and can be hazardous to unprotected astronauts.

The breakthrough “solar climate” forecast by Mausumi Dikpati and colleagues at the National Center for Atmospheric Research in Boulder, Colo. was made with a combination of computer simulation and groundbreaking observations of the solar interior from space using NASA’s Solar and Heliospheric Observatory (SOHO). NASA’s Living With a Star program and the National Science Foundation funded the research.

The sun goes through a roughly 11-year cycle of activity, from stormy to quiet and back again. Solar storms begin with tangled magnetic fields generated by the sun’s churning electrically charged gas (plasma). Like a rubber band twisted too far, solar magnetic fields can suddenly snap to a new shape, releasing tremendous energy as a flare or a coronal mass ejection (CME). This violent solar activity often occurs near sunspots, dark regions on the sun caused by concentrated magnetic fields.

Understanding plasma flows in the sun’s interior is essential to predicting the solar activity cycle. Plasma currents within the sun transport, concentrate, and help dissipate solar magnetic fields. “We understood these flows in a general way, but the details were unclear, so we could not use them to make predictions before,” Dikpati said. Her paper about this research was published in the March 3 online edition of Geophysical Research Letters.

The new technique of “helioseismology” revealed these details by allowing researchers to see inside the sun. Helioseismology traces sound waves reverberating inside the sun to build up a picture of the interior, similar to the way an ultrasound scan is used to create a picture of an unborn baby.

Two major plasma flows govern the cycle. The first acts like a conveyor belt. Deep beneath the surface, plasma flows from the poles to the equator. At the equator, the plasma rises and flows back to the poles, where it sinks and repeats. The second flow acts like a taffy pull. The surface layer of the sun rotates faster at the equator than it does near the poles. Since the large-scale solar magnetic field crosses the equator as it goes from pole to pole, it gets wrapped around the equator, over and over again, by the faster rotation there. This is what periodically concentrates the solar magnetic field, leading to peaks in solar storm activity.

“Precise helioseismic observations of the ‘conveyor belt’ flow speed by the Michelson Doppler Imager (MDI) instrument on board SOHO gave us a breakthrough,” Dikpati said. “We now know it takes two cycles to fill half the belt with magnetic field and another two cycles to fill the other half. Because of this, the next solar cycle depends on characteristics from as far back as 40 years previously – the sun has a magnetic ‘memory’.”

The magnetic data input comes from the SOHO/MDI instrument and historical records. Computer analysis of the past eight years’ magnetic data matched actual observations over the last 80 years. The team added magnetic data and ran the model ahead 10 years to get their prediction for the next cycle. The sun is in the quiet period for the current cycle (cycle 23).

The team predicts the next cycle will begin with an increase in solar activity in late 2007 or early 2008, and there will be 30 to 50 percent more sunspots, flares, and CMEs in cycle 24. This is about one year later than the prediction using previous methods, which rely on such statistics as the strength of the large-scale solar magnetic field and the number of sunspots to make estimates for the next cycle. This work will be advanced by more detail observations from the Solar Dynamics Observatory, scheduled to launch in August 2008.

SOHO is a project of international collaboration between NASA and the European Space Agency. For images explaining the data on the Web, visit:
http://www.nasa.gov/vision/universe/solarsystem/solar_cycle_graphics.html

Original Source: NASA News Release

Galactic Chimneys Rising Above NGC 2841

NGC 2841. Image credit: NASA. Click to enlargeThis photograph of spiral galaxy NGC 2841 was taken by the Chandra X-Ray observatory. It shows gasses millions of degrees hot rising above the disk of stars and cooler gas. This superheated gas is created by giant stars and supernovae explosions which blow huge bubbles of gas above the disk like smoke rising from chimneys.

This X-ray/optical composite image of the large spiral galaxy NGC 2841 shows multimillion degree gas (blue/X-ray) rising above the disk of stars and cooler gas (gray/optical).

The rapid outflows of gas from giant stars, and supernova explosions in the disk of a galaxy create huge shells or bubbles of hot gas that expand rapidly and rise above the disk like plumes of smoke from a chimney. Chandra’s image of NGC 2841 provides direct evidence for this process, which pumps energy into the thin gaseous halo that surrounds the galaxy. Galactic chimneys also spread hot, metal enriched gas away from the disk of the galaxy into the halo.

Chandra X-ray Observatory

Book Review: Parallel Worlds


Pandora had her box. Adam and Eve had their apple. Physicists have the expanding universe. Whether the universe expands forever into a deep freeze or eventually contracts back into a hellish speck containing all energy, the future looks grim. Michio Kaku in his book Parallel Worlds doesn’t let these portends cause any dismay as he provides plenty of ideas for dealing with and possibly escaping from a failing universe. For after all, opening a box wasn’t the end of the world, nor was eating an apple.

Nearly all cosmologists agree that our universe isn’t static. It’s apparently expanding at an accelerating rate. A long time from now, living beings, even ones adapted to a low density environment, will eventually be unable to process information, or anything else, and thus couldn’t live. This we deduce from many years research with telescopes, antennas and very fast computers. Step by step with the observations are the mathematical reasonings. The uncertainty principle, quantum mechanics, relativity, string theory all try to correlate the forces, fields and particles that constitute our existence. But, once entering into the realm of mathematics, the equations can lead to places that aren’t observable. Here, the fifth dimension is more than a musical group. String theory may need up to 11 dimensions for its resolution, but where are these dimensions located? Not much farther past this issue is the thought of many universes. Maybe the other dimensions are in other universes. In consequence, should our universe be no longer habitable, then perhaps we need just pop into another one and continue on.

This book on parallel worlds by Michio Kaku’s is a serious, science based review of alternate universes and their relevance to us. Using very little scientific jargon, Kaku takes the reader along the standard trail from Greek philosophers up to today’s cosmologists. Along the way, he includes notice of the works of Newton, Halley, Darwin, Einstein, Gamow and other luminaries. These references, however, don’t obscure the main thrust which is to enable understanding of our universe. Kaku explains why the night is black, how the uncertainty principle links to consciousness, and where quantum theory can lead to infinite realities. His main focus though is on the potential of string theory. He effectively argues that we need a theory of everything to deal with the expanding universe and, today, string theory is the best candidate. Kaku expects that one of the treats available with this theory is the ability to explore black holes and determine if they are a potential escape route to other universes.

As can probably be deduced from the previous paragraph, this book covers a lot of high-end physics in a very short time. But, as Kaku wanted, it can be read and grasped without any previous introduction to physics or cosmology. Given that the reader is expected to concur with the idea of future civilisations fabricating their own universe, there still remains a lot that remains a matter of faith. I compare this to the challenge of teaching a blind person about colour. Kaku easily passes this challenge. The book does draw on much at the forefront of today’s research in physics, but the reader isn’t left hanging.

As can be expected in a relatively small book that tackles a large topic, its pace is fast. By assuming no prior knowledge, Kaku needs to and does cover a lot before he gets to the life stages of universes. Universes and a unifying theory aren’t his sole objective as he considers today’s research into gravity waves and some attempts to discover the Higgs boson. He even contemplates research and engineering far into the future. For example, he sees the possibility for warp drive in the sense of a network of paths connecting people on disparate, distant planets. But the book’s focus is on a grand unifying theory and how its discovery could shape humanity’s future.

By using simple descriptions, Kaku shows off the works of today’s physicists so that anyone can understand and appreciate their work. He maintains a nice balance between detail and corollary. This, together with a copious glossary and a large ‘notes’ section, makes this book easily accessible to anyone. As can be expected, sometimes the topics drift especially to the philosophical side of things. However, given that the concept of the book is on alternate universes, this is fair game. Hence, whether to appreciate the complexity of our existence, have an exhilarating companion reader for Star Trek episodes, or simply to get hyped up on physics, this book works.

Our own world has more than enough challenges to keep us busy for eons. There may, however, come a time when we the Earth is a safe abode for us all. Then would be a good time to consider how we might survive the end of our universe. Michio Kaku in his book Parallel Worlds takes a step in this direction. Certainly we have many obstacles to overcome, but we are also showing the ability with which to overcome them.

Review by Mark Mortimer

Read more reviews online or purchase a copy from Amazon.com