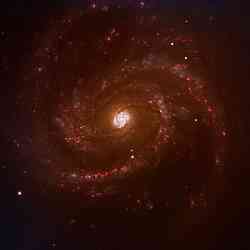
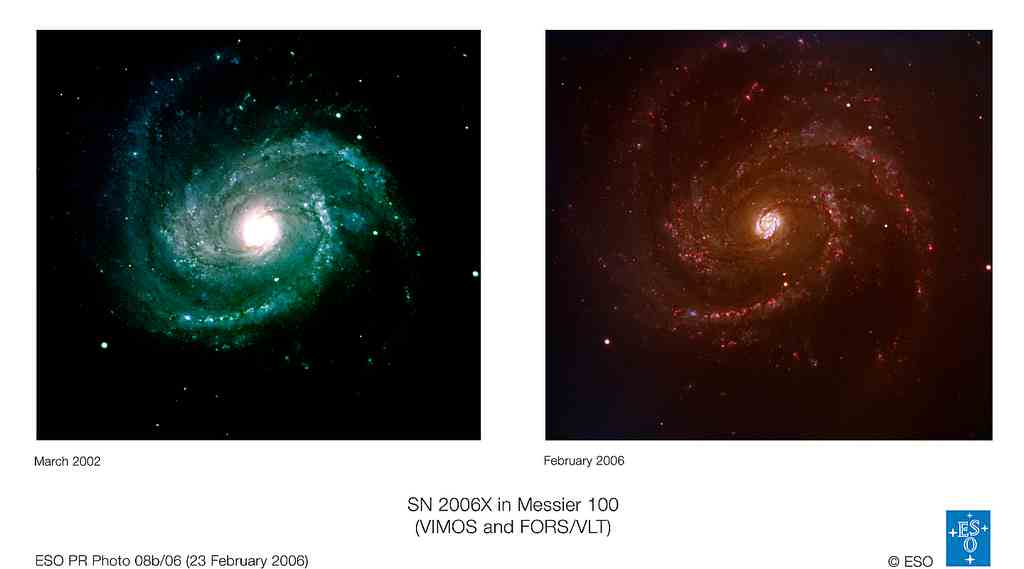
Early Earth Had Toxic Oceans

Rock formation in northern Australia. Image credit: Jochen J. Brocks. Click to enlarge.
NASA exobiology researchers confirmed Earth’s oceans were once rich in sulfides that would prevent advanced life forms, such as fish and mammals, from thriving. The research was funded in part by NASA’s exobiology program.

A team of scientists from the Massachusetts Institute of Technology and Harvard University, working with colleagues from Australia and the United Kingdom, analyzed the fossilized remains of photosynthetic pigments preserved in 1.6 billion-year-old rocks from the McArthur Basin in Northern Australia.

They found evidence of photosynthetic bacteria that require sulfides and sunlight to live. Known as purple and green sulfur bacteria because of their respective pigment colorations, these single-celled microbes can only live in environments where they simultaneously have access to sulfides and sunlight.

The researchers also found very low amounts of the fossilized remains of algae and oxygen-producing cyanobacteria. The relative scarcity of these organisms is due to poisoning by large amounts of sulfide.

“This work suggests Earth’s oceans may have been hostile to animal and plant life until relatively recently,” said Dr. Carl Pilcher, NASA’s senior scientist for astrobiology. “If so, this would have profound implications for the evolution of modern life.”

“The discovery of the fossilized pigments of purple sulfur bacteria is totally new and unexpected. Because they need fairly high intensity sunlight, it means the pink bacteria, along with their essential source of sulfide, close to the surface, perhaps as close as 20 to 40 meters,” said Roger Summons, Massachusetts Institute of Technology professor of geobiology. “The sulfide would have come from bacteria that reduces sulfate carried into the oceans by the weathering of rocks.”

“The McArthur Basin rocks were deposited over a very large area and over many millions of years, so it’s likely they formed under water that was intermittently connected to or actually part of an ocean. In turn, this implies the ocean had an abundant and continuous supply of hydrogen sulfide and must have been quite toxic to any oxygen-breathing organisms,” said team member Jochen Brocks. “In fact, for seven-eighths of Earth’s 4.5 billion-year history, there was probably little oxygen in the oceans and certainly not enough to support oxygen-breathing marine animals.”

This research continued the efforts of NASA and partner institutions to understand the early history of the Earth. Research results were published in the Oct. 6, 2005, edition of Nature magazine.

The research was conducted by a team working in Summons’ laboratory. Team members include Jochen Brocks, formerly of Harvard and now at Australian National University; Gordon Love, Massachusetts Institute of Technology; Stephen Bowden, University of Aberdeen, Scotland; Graham Logan, Geoscience Australia; and Andrew Knoll, Harvard.

Original Source: NASA News Release

ESA’s CryoSat is Ready for Launch

Artist’s illustration of Cryosat. Image credit: ESA. Click to enlarge.
The expectations of ice researchers across Europe are currently focused on a region of taiga woodland in Russia’s far north. Located in a forest clearing is Pad LC133 of Plesetsk Cosmodrome, where above the tree-line on a Rockot launcher stands ESA’s CryoSat satellite, due to start its flight into orbit this Saturday at 17:02 CEST.

The first of ESA’s Earth Explorer series – missions tailored to respond to particular needs of the Earth science community – CryoSat will use a specialised radar altimeter to measure changes in land and sea ice thickness over a three-year period, to provide a precise picture of how the Polar Regions are responding to climate change.

The generation of radar altimeters currently flying on satellites including ERS-2 and Envisat have made a large contribution to our knowledge of the mass balance of Greenland and Antarctic ice sheets, but they cannot return reliable data from the ice edge, where the rate of change is greatest. Similarly, over the ocean their resolution is insufficient to detect the majority of individual pack ice pieces. The design of CryoSat’s new SAR Interferometric Radar Altimeter (SIRAL) has been optimised to close these data gaps.

Many European ice specialists have played a part in the preparation for the mission, either through participation in the CryoSat Science Advisory Group, taking part in extensive in-situ calibration and validation activities in the Arctic and Antarctic, or preparing processing algorithms to turn raw altimetry results into usable information products. And whether or not they have made such direct contributions, researchers are eagerly awaiting the unique results CryoSat will return.

“Summer Arctic sea ice is shrinking ? but is it thinning?”
Dr Seymour Laxon of the Centre for Polar Modelling (CPOM) at University College London has been part of the mission with the start ? working closely with Lead Investigator Professor Duncan Wingham from the original mission proposal to ESA onwards.

“At that time we had just managed to extract the first plausible sea ice thickness maps from the radar altimeter on ESA’s ERS,” Dr. Laxon remembers. “Coupled with Duncan’s experience in mapping the ice sheets, ESA’s Earth Explorer Opportunity programme seemed like a great chance for us to build on what we had learned from the earlier ESA missions to design a mission that was really focused on altimetry over ice.”

A period of concentrated effort followed, as findings from past exploratory studies, and the latest results from ERS, were converted into a proposal for a new mission that could better those results.

“I vividly remember the selection procedure, with Duncan reporting back at each selection stage that CryoSat was still in the running,” Dr. Laxon adds. “I don’t think either of us were quite ready to hear the news that CryoSat was the first to be selected.

“At that point we both realised that the real work, to build a complete mission scenario from scratch, had started. Now everything is in place, the satellite sitting on top of its launcher, the processing system for the data, and plans for the post-launch validation campaign. Now we are just looking forward to seeing the very first data.”

In terms of his own area of interest, it is the sea ice data that Dr. Laxon is most looking forward to: “The most exciting thing for me is the prospect of seeing the first maps of sea ice thickness from CryoSat. We have not seen estimates of Arctic sea ice thickness around the North Pole since the last submarine data from 1999 were declassified.”

“Back then, analysis of this data suggested that a significant ? up to 40% – thinning had occurred since the 1960s, with the largest thinning around the pole. The big question is whether that thinning has reversed or continued as we have entered the new century.”

“That question has gained even more impetus since the news that the extent of summer ice in the Arctic has reached a record minimum this year. But has it also thinned? That’s the crucial question to which CryoSat will provide the answer.”

Opening a new window on the Poles
Professor Chris Rapley is Director of the Cambridge-based British Antarctic Survey and is also Chair of the Planning Group for the forthcoming International Polar Year, which will take place in 2007-8, during the time CryoSat will be carrying out its ice thickness survey. He has had a long involvement with radar altimetry over ice.

Prof. Rapley states: “I was deeply involved in the preparations for the ESA ERS and Envisat altimeters, and led or contributed to a substantial series of studies commissioned by ESA to explore the use of satellite radar altimeters over polar land ice and sea ice, and the technical advances required in instruments, data processing and analysis software to achieve useful scientific results.”

That activity included work on designing and implementing the UK-based ERS processing and archiving facility and the ESA altimeter data processing chain and associated software. Prof. Rapley also worked on design studies for more advanced altimeters along CryoSat’s lines.

A past member of ESA’s Earth Observation Advisory Committee (ESAC), Prof. Rapley was also involved in reviewing the CryoSat proposal and its adoption as an ESA Earth Explorer.

“What I am looking forward to is the best measure yet of the Antarctic and Greenland ice sheet mass balance,” Prof. Rapley adds. “CryoSat should also open a new window on the nature, geographic distribution and the seasonal/systematic behaviour of Antarctic and Arctic sea ice.”

“We can add ice thickness to our models”
Direct in-situ observations of land and sea ice have been necessary to establish that the CryoSat sensor will indeed ‘see’ as anticipated, and quantify residual geophysical uncertainties. As a member of ESA’s CryoSat Cal/Val Team, Dr. Christian Haas of the Alfred Wegener Institute in Bremerhaven coordinates German activities in this area.

“I lead the German CryoSat office,” says Dr. Haas. “It is the main interface between German users and scientists involved in Cryosat and ESA. We are also raising money in Germany for work with CryoSat.

“I am also coordinating the sea ice validation work in the Arctic and Antarctic. We at the Alfred Wegener Institute are the only group able to measure sea ice thickness directly, by helicopter-borne electromagnetic measurements with our EM-bird sensor. We have conducted the CryoVex (CryoSat Validation Exercise) campaign in 2003 and this year’s Bay of Bothnia campaign.”

As a geophysicist, Dr. Haas has been working with sophisticated software models of sea ice. Results from CryoSat will be used to first to check these models, then later be directly ingested within them to bring them closer to reality. The satellite’s ice thickness data in particular should literally add a new dimension to their representation of polar sea ice.

“As a scientist I am interested in using CryoSat data for validating our sea ice models, and combining the data with other met-ocean data to better understand the variability of sea ice thickness,” Haas explains. “We also want to assimilate sea ice thickness into our models.”

After CryoSat’s launch comes a further validation campaign, to compare the results from space to the reality on ground, as Haas adds: “I am looking forward to the validation of the satellite, and the opportunity of extending our airborne measurements laterally by means of the satellite.

Is Antarctic land ice growing or shrinking?
Other researchers, such as Dr. Massimo Frezzotti of Italy’s National Agency for New Technologies, Energy and the Environment (ENEA) in Rome hope to use the new satellite’s results to improve their knowledge of ice sheets on land.

Dr. Frezzotti has carried out in-situ studies of the Antarctic ice sheet between the Italian base of Terra Nova Bay on the shores of the Ross Sea and the new Franco-Italian Concordia base high on the Antarctic Plateau some 1200 kilometres inland. He also makes use of altimetry results in his research.

“I already use ERS altimeter data to study the influence of wind erosion on surface mass balance,” Dr. Frezzotti explains. “Previous altimeters are not able to provide a detailed model of the coastal areas, which are a very crucial area for mass balance studies. CryoSat will partially cover this gap.”

Satellite altimetry observations over the ocean have established a steady rise in global sea level of an average 0.3 millimetres a year. What is not known ? yet ? is how changes in polar ice thickness may be contributing to this trend.

“The Antarctic ice sheet contains sufficient ice to raise worldwide sea level by more than 60 metres if melted completely,” Dr. Frezzotti adds. “The amount of snow deposited annually on its surface is equivalent to five or six millimetres of global sea level. Thus the ice sheet could be a major source of water for the present-day rise in sea level, but the uncertainty is still large.

“Despite all available measurements of snow accumulation, ice velocity, surface and basal melting and iceberg discharge, it is still not known for certain even whether the ice sheet is growing or shrinking.” CryoSat should remedy this state of affairs.

Determining CryoSat’s orbit will improve its results
The Department of Earth Observation and Space Systems (DEOS) of the Delft University of Technology has an interest in the precise orbit determination (POD) of radar altimeter satellites. Because altimetry is based on the principle that time equals distance ? measuring how long it takes for a radar pulse to travel back from the Earth’s surface to the spacecraft – more exact knowledge of the satellite’s location at any one time greatly improves the quality and accuracy of the final data.

CryoSat has two onboard instruments for sharpening orbital estimates from a matter of metres down to a maximum three centimetres ? the Doppler Orbitography and Radiopositioning Integrated by Satellite (DORIS) radio receiver and a Laser Retro-reflector (LRR). Both these devices are found on a number of different satellites, and work based on global networks of radio transmitters and laser stations.

In addition a satellite trajectory prediction model will be created by DEOS to forecast how CryoSat’s orbit will be perturbed by the slight pressure of sunlight and the drag of the upper atmosphere as well as gravitational tugs from terrestrial gravity field anomalies as well as the influence of the tides, other planets and our Sun.

“We will determine CryoSat’s orbit, but in addition we will also perform cal/val activities for its SIRAL instrument, particularly in the Low-Rate Mode (LRM) over the open ocean and inland ice sheets,” said Dr. Ernst Schrama. “Comparing LRM sea surface results to in-situ buoys and tidal gauges should enable a means of externally validating LRM results.?

“We will also add CryoSat data to our Radar Altimeter Database System (RADS) compiled from other current as well as past altimeter missions. The database will be used to inter-compare the performance of SIRAL against other altimeters.”

Beyond improving the quality of CryoSat results, RADS also represents a scientific resource in its own right, which provides a continuous set of sea level measurements of constant quality. RADS can be used for scientific and operational oceanography as well as detecting slight variations in the Earth’s gravity field to infer its interior structure.

Original Source: ESA News Release

Large Craters on Dione

Large craters across the surface of Dione. Image credit: NASA/JPL/SSI. Click to enlarge.
When naming features on other worlds, scientists like to follow themes, and Dione is no exception. Dione possesses numerous features with names from Virgil’s “Aeneid.” The prominent crater showing a central peak below the center is Dido, a 118-kilometer-wide (73-mile) crater named after the supposed founder of Carthage. The crater just above Dido is Antenor, an 82-kilometer-wide (51-mile) impact crater named after the nephew of Priam who founded the Italian city of Padua. At the upper right is the 97-kilometer-wide (60-mile) impact crater Turnus, which lies at the western end of Carthage Linea, a region of bright, fractured terrain. Dione is 1,118 kilometers (695 miles) across.

The sunlit terrain seen here shows some of the wispy markings on the moon’s trailing hemisphere. Cassini revealed that these markings are actually a complex system of fractures.

North on Dione is up and rotated 25 degrees to the left.

The image was taken in visible light with the Cassini spacecraft narrow-angle camera on Aug. 25, 2005, at a distance of approximately 1.1 million kilometers (700,000 miles) from Dione and at a Sun-Dione-spacecraft, or phase, angle of 107 degrees. Resolution in the original image was 7 kilometers (4 miles) per pixel. The image has been magnified by a factor of two and contrast-enhanced to aid visibility.

The Cassini-Huygens mission is a cooperative project of NASA, the European Space Agency and the Italian Space Agency. The Jet Propulsion Laboratory, a division of the California Institute of Technology in Pasadena, manages the mission for NASA’s Science Mission Directorate, Washington, D.C. The Cassini orbiter and its two onboard cameras were designed, developed and assembled at JPL. The imaging operations center is based at the Space Science Institute in Boulder, Colo.

For more information about the Cassini-Huygens mission visit http://saturn.jpl.nasa.gov . The Cassini imaging team homepage is at http://ciclops.org .

Original Source: NASA/JPL/SSI News Release

What’s that Bright Spot on Titan?

Bright spot on Titan. Image credit: NASA/JPL/University of Arizona/Space Science Institute Click to enlarge.
A 300-mile-wide patch that outshines everything else on Titan at long infrared wavelengths appears not to be a mountain, a cloud or a geologically active hot spot, University of Arizona scientists and Cassini team members say.

“We must be looking at a difference in surface composition,” said Jason W. Barnes, a postdoctoral researcher at UA’s Lunar and Planetary Lab. “That’s exciting because this is the first evidence that says not all of the bright areas on Titan are the same. Now we have to figure out what those differences are, what might have caused them.”

When NASA’s Cassini spacecraft flew by Titan on March 31 and again on April 16, its visual and infrared mapping spectrometer saw a feature that was spectacularly bright at 5-micron wavelengths just southeast of the continent-sized region called Xanadu.

The bright spot occurs where Cassini’s visible-wavelength imaging cameras photographed a bright arc-shaped feature approximately the same size in December 2004 and February 2005.

Cassini’s radar instrument, operating in the “passive” mode that is sensitive to microwaves emitted from a planetary surface, saw no temperature difference between the bright spot and surrounding region. That rules out the possibility that the 5-micron bright spot is a hot spot, such as a geologically active ice volcano, Barnes said.

Cassini microwave radiometry also failed to detect a temperature drop that would show up if some two-mile high mountain rose from Titan’s surface, he said.

And if the 5-micron bright spot is a cloud, it’s a cloud that hasn’t moved or changed shape for three years, according to ground-based observations made at the Keck Telescope and with Cassini’s visual and infrared mapping spectrometer during five different flybys. “If this is a cloud,” Barnes said, “it would have to be a persistent ground fog, like San Francisco on steroids, always foggy, all the time.”

“The bright spot must be a patch of surface with a composition different from anything we’ve seen yet. Titan’s surface is primarily composed of ice. It could be that something is contaminating the ice here, but what this might be is not clear,” Barnes said.

“There’s a lot left to explore about Titan. It’s a very complex, exciting place. It’s not obvious how it works. It’s going to be a lot of fun over the next couple of years figuring out how Titan works,” he said.

Barnes and 34 other scientists report the research in the Oct. 7 issue of Science. Authors include UA Lunar and Planetary Laboratory scientists and Cassini team members Robert H. Brown, head of Cassini’s visual and infrared mapping spectrometer team; Elizabeth P. Turtle and Alfred S. McEwen of the Cassini imaging team; Ralph D. Lorenz of the Cassini radar team; Caitlin Griffith of the Cassini visual and infrared mapping team; and Jason Perry and Stephanie Fussner, who work with McEwen and Turtle on Cassini imaging.

The Cassini-Huygens mission is a cooperative project of NASA, the European Space Agency and the Italian Space Agency. The Jet Propulsion Laboratory, a division of the California Institute of Technology in Pasadena, Calif., manages the mission for NASA’s Science Mission Directorate, Washington, D.C. The Cassini orbiter and its two onboard cameras were designed, developed and assembled at JPL. The imaging team is based at the Space Science Institute in Boulder, Colo. The Visual and Infrared Mapping Spectrometer team is based at The University of Arizona in Tucson .

Original Source: UA News Release

Robot Plane Can Find Thermals to Stay Aloft

Unmanned prototype sailplane. Image credit: NASA. Click to enlarge.
With the graceful flight of hawks and eagles in mind, NASA aerospace engineer Michael Allen recently hand-launched a 15-pound motorized model sailplane over the Southern California desert. He was hoping it would catch plumes of rising air called thermals.

The sailplane did just that several times without human intervention during a series of research flights at NASA’s Dryden Flight Research Center, Calif. The tests validated Allen’s premise that using thermal lift could significantly extend the range and flight endurance of small unmanned air vehicles. Thermal lift increases vehicle endurance and saves fuel. This is significant, as small vehicle flight duration is often restricted by limited fuel capacity.

Allen and his team of engineers and technicians flew the remote-controlled RnR Products sailplane 17 times from July through mid-September. The sailplane was modified by Dryden aerospace technicians to incorporate a small electric motor and an autopilot programmed to detect thermals.

The 14-foot-wingspan model flew to an altitude of about 1,000 feet. The ground-based remote control pilot then handed off control to the sailplane’s onboard autopilot. The autopilot software flew the plane on a pre-determined course over the northern portion of Rogers Dry Lake at Edwards Air Force Base, Calif., until it detected an updraft. As the aircraft rose with the updraft, the engine automatically shut off. The aircraft circled to stay within the lift from the updraft.

Allen said the small sailplane added 60 minutes to its endurance by autonomous thermal soaring. The modified sailplane gained an average altitude in 23 updrafts of 565 feet, and in one strong thermal ascended 2,770 feet.

“The flights demonstrated a small unmanned vehicle can mimic birds and exploit the free energy that exists in the atmosphere,” Allen said. “We have been able to gather useful and unique data on updrafts and the response of the aircraft in updrafts. This will further the technology and refine the algorithms used.”

Small, portable, unpiloted, long-endurance vehicles could fulfill a number of observation roles including forest fire monitoring, traffic control, search and rescue.

For more information about flight research at Dryden on the Web visit:
http://www.nasa.gov/centers/dryden

For information about NASA and agency programs on the Web, visit:
http://www.nasa.gov/home

Original Source: NASA News Release

Gamma Ray Burst Mystery Solved

Artist illustraton of a black hole consuming a neutron star. Image credit: Dana Berry/NASA. Click to enlarge.
Scientists have solved a 35-year-old mystery of the origin of powerful, split-second flashes of light called short gamma-ray bursts. These flashes, brighter than a billion suns yet lasting only a few milliseconds, have been simply too fast to catch… until now.

If you guessed that a black hole is involved, you are at least half right. Short gamma-ray bursts arise from collisions between a black hole and a neutron star or between two neutron stars. In the first scenario, the black hole gulps down the neutron star and grows bigger. In the second scenario, the two neutron stars create a black hole.

Gamma-ray bursts, the most powerful explosions known, were first detected in the late 1960s. They are random, fleeting, and can occur from any region of the sky. Try finding the location of a camera flash somewhere in a vast sports stadium and you’ll have a sense of the challenge facing gamma-ray burst hunters. Solving this mystery took unprecedented coordination among scientists using a multitude of ground-based telescopes and NASA satellites.

Two years ago scientists discovered that longer bursts, lasting over two seconds, arise from the explosion of very massive stars. About 30 percent of bursts, however, are short and under two seconds.

Four short gamma-ray bursts have been detected since May. Two of these are featured in four papers in the October 6 issue of Nature. One burst from July provides the “smoking gun” evidence to support the collision theory. Another burst goes a step further by providing tantalizing, first-time evidence of a black hole eating a neutron star—first stretching the neutron star into a crescent, swallowing it, and then gulping up crumbs of the broken star in the minutes and hours that followed.

These discoveries might also aid in the direct detection of gravitational waves, never before seen. Such mergers create gravitational waves, or ripples in spacetime. Short gamma-ray bursts could tell scientists when and where to look for the ripples.

“Gamma-ray bursts in general are notoriously difficult to study, but the shortest ones have been next to impossible to pin down,” said Dr. Neil Gehrels of NASA Goddard Space Flight Center in Greenbelt, Md., principal investigator of NASA’s Swift satellite and lead author on one of the Nature reports. “All that has changed. We now have the tools in place to study these events.”

The Swift satellite detected a short burst on May 9, and NASA’s High-Energy Transient Explorer (HETE) detected another on July 9. These are the two bursts featured in Nature. Swift and HETE quickly and autonomously relayed the burst coordinates to scientists and observatories via cell phone, beepers and e-mail.

The May 9 event marked the first time scientists identified an afterglow for a short gamma-ray burst, something commonly seen after long bursts. That discovery was the subject of a May 11 NASA press release. The new results published in Nature represent thorough analyses of these two burst afterglows, which clinch the case for the origin of short bursts.

“We had a hunch that short gamma-ray bursts came from a neutron star crashing into a black hole or another neutron star, but these new detections leave no doubt,” said Dr. Derek Fox of Penn State, lead author on one Nature report detailing a multi-wavelength observation.

Fox’s team discovered the X-ray afterglow of the July 9 burst with NASA’s Chandra X-ray Observatory. A team led by Prof. Jens Hjorth of the University of Copenhagen then identified the optical afterglow using the Danish 1.5-meter telescope at the La Silla Observatory in Chile. Fox’s team then continued its studies of the afterglow with NASA’s Hubble Space Telescope; the du Pont and Swope telescopes at Las Campanas, Chile, funded by the Carnegie Institution; the Subaru telescope on Mauna Kea, Hawaii, operated by the National Astronomical Observatory of Japan; and the Very Large Array, a stretch of 27 radio telescopes near Socorro, N.M., operated by the National Radio Astronomy Observatory.

The multi-wavelength observation of the July 9 burst, called GRB 050709, provided all the pieces of the puzzle to solve the short burst mystery.

“Powerful telescopes detected no supernova as the gamma-ray burst faded, arguing against the explosion of a massive star,” said Dr. George Ricker of MIT, HETE Principal Investigator and co-author of another Nature article. “The July 9 burst was like the dog that didn’t bark.”

Ricker added that the July 9 burst and probably the May 9 burst are located in the outskirts of their host galaxies, where old merging binaries are expected to be. Short gamma-ray bursts are not expected in young, star-forming galaxies. It takes billions of years for two massive stars, coupled in a binary system, to first evolve to the black hole or neutron star phase and then to merge. The transition of a star to a black hole or neutron star involves an explosion (supernova) that can kick the binary system far from its origin and out towards the edge of its host galaxy.

This July 9 burst and a later one on July 24 showed unique signals that point to not just any old merger but, more specifically, a black hole – neutron star merger. Scientists saw spikes of X-ray light after the initial gamma-ray burst. The quick gamma-ray portion is likely a signal of the black hole swallowing most of the neutron star. The X-ray signals, in the minutes to hours that followed, could be crumbs of neutron star material falling into the black hole, a bit like dessert.

And there’s more. Mergers create gravitational waves, ripples in spacetime predicted by Einstein but never detected directly. The July 9 burst was about two billion light years away. A big merger closer to the Earth could be detected by the National Science Foundation’s Laser Interferometer Gravitational-Wave Observatory (LIGO). If Swift detects a nearby short burst, LIGO scientists could go back and check the data with a precise time and location in mind.

“This is good news for LIGO,” said Dr. Albert Lazzarini, of LIGO Laboratory at Caltech. “The connection between short bursts and mergers firms up projected rates for LIGO, and they appear to be at the high end of previous estimates. Also, observations provide tantalizing hints of black hole – neutron star mergers, which have not been detected before. During LIGO’s upcoming yearlong observation we may detect gravitational waves from such an event.”

A black hole – neutron star merger would generate stronger gravitational waves than two merging neutron stars. The question now is how common and how close these mergers are. Swift, launched in November 2004, can provide that answer.

Original Source: NASA News Release

Book Review: The Grand Tour

Our solar system rates little more than an acknowledgement from the average person. Simple rhymes from grade school help us memorize the planet names and their order from closest to the Sun to farthest out. As the solar system changes ever so slightly in the brevity of the average person’s life, this is reasonable. However, we have been lucky enough to have recently seen the bright comets Halley and Hale-Bopp trek by the sun. Then comet Shoemaker-Levy 9 disintegrated and slammed into Jupiter. In keeping with this awakening interest, we routinely scan the skies for asteroids that might impact our Earth. With all this activity, it becomes obvious our solar system is anything but routine. Hence, a travel guide is an excellent resource for learning more.

Miller and Hartmann’s tour book is a great complement for those wanting to know more about the worlds circling our Sun. Using the tools of artists, together with the concise detailing of science, the far away worlds come alive before our eyes. Distinct chapters highlight individual planets and the smaller worlds. The presentation stresses a view as if for a visitor rather than an occupant of Earth. In following this vein, the authors start with the largest planet, Jupiter. A fairly regular description then ensues. The atmosphere, its properties and constituent matter get appraised. The surface shape, colour, and any novel features characterize the world. Then last, the interior gets mentioned often as a tie-in to the formation process of the solar system. Understandably, the authors have to rely on knowledge gained from probes sent and surveys undertaken by humankind, so the details of Venus, Earth and Mars are lengthy while many others are quite short and rather impersonal. For instance, Asteroid 6178 gets a two page entry, principally due to it being a pure nickel-iron alloy. But it and manner others do get mentioned.

Setting this book apart from your garden variety tour guide are the graphics and images. Hundreds of large and small coloured plates place the reader directly at the subject’s location. There’s one as if the viewer is standing in the middle of Saturn’s ring watching hundreds of fellow ring objects dance along. Or picture yourself on one lobe of the compound asteroid 624 Hektor looking down at a strange connecting valley and on up to the next lobe. Many images are grand vistas where the viewer is on an orbiting world with a planet filling the distance. For example there’s the cliff of Miranda while the ring system of Uranus defines a blue back drop. With accurate angles and perspectives it is often difficult to separate the computer drawn images to real photographs. Nevertheless, with this book in hand, all you need is a vehicle and you’d be off wandering to your favourite.

The format of the book (long rather than tall) further enhances these images, as many two paged vistas are quite breathtaking. These and the complementary text keep the reader pressing forward to find more wondrous natural sights of space. Further, even though this is the third edition, the images and data aren’t dated, as much information is recent. And don’t let the 3D hologram on the front cover make you think this book is purely for children. The detail and presentation is much more apropos for secondary school students or the beginning space buff. However, given the strength of the artwork, I was disappointed at the brevity of the section for worlds Beyond Our Solar System. There would be little to lose and, I think, much to gain from letting learned imaginations fill wide vistas of planets in other solar systems.

Our solar system keeps our special planet Earth in just the right location to allow our own happy lives. This doesn’t, however, bind us to this paradise. Other exciting, unique and pictorially sensational worlds grace our passage about our Sun. So read Ron Miller and William K. Hartmann’s book The Grand Tour, A Traveler’s Guide to the Solar System and get acquainted or re-acquainted with the beauty and relevance of these other worlds that share our immediate space.

Review by Mark Mortimer

Read more reviews online, or purchase a copy from Amazon.com.

Afterglow of Supernova Remnant N132D

Supernova remnant N132D. Image credit: Hubble. Click to enlarge.
Intricate wisps of glowing gas float amid a myriad of stars in this image created by combining data from NASA’s Hubble Space Telescope and Chandra X-ray Observatory. The gas is a supernova remnant, cataloged as N132D, ejected from the explosion of a massive star that occurred some 3,000 years ago. This titanic explosion took place in the Large Magellanic Cloud, a nearby neighbor galaxy of our own Milky Way.

The complex structure of N132D is due to the expanding supersonic shock wave from the explosion impacting the interstellar gas of the LMC. Deep within the remnant, the Hubble visible light image reveals a crescent-shaped cloud of pink emission from hydrogen gas, and soft purple wisps that correspond to regions of glowing oxygen emission. A dense background of colorful stars in the LMC is also shown in the Hubble image.

The large horseshoe-shaped gas cloud on the left-hand side of the remnant is glowing in X-rays, as imaged by Chandra. In order to emit X-rays, the gas must have been heated to a temperature of about 18 million degrees Fahrenheit (10 million degrees Celsius). A supernova-generated shock wave traveling at a velocity of more than four million miles per hour (2,000 kilometers per second) is continuing to propagate through the low-density medium today. The shock front where the material from the supernova collides with ambient interstellar material in the LMC is responsible for these high temperatures.

It is estimated that the star that exploded as a supernova to produce the N132D remnant was 10 to 15 times more massive than our own Sun. As fast-moving ejecta from the explosion slam into the cool, dense interstellar clouds in the LMC, complex shock fronts are created.

A supernova remnant like N132D provides a rare opportunity for direct observation of stellar material, because it is made of gas that was recently hidden deep inside a star. Thus it provides information on stellar evolution and the creation of chemical elements such as oxygen through nuclear reactions in their cores. Such observations also help reveal how the interstellar medium (the gas that occupies the vast spaces between the stars) is enriched with chemical elements because of supernova explosions. Later on, these elements are incorporated into new generations of stars and their accompanying planets.

Visible only from Earth’s southern hemisphere, the LMC is an irregular galaxy lying about 160,000 light-years from the Milky Way. The supernova remnant appears to be about 3,000 years old, but since its light took 160,000 years to reach us, the explosion actually occurred some 163,000 years ago.

This composite image of N132D was created by the Hubble Heritage team from visible-light data taken in January 2004 with Hubble’s Advanced Camera for Surveys, and X-ray images obtained in July 2000 by Chandra’s Advanced CCD Imaging Spectrometer. This marks the first Hubble Heritage image that combines pictures taken by two separate space observatories. The Hubble data include color filters that sample starlight in the blue, green, and red portions of the spectrum, as well as the pink emission from glowing hydrogen gas. The Chandra data are assigned blue in the color composite, in accordance with the much higher energy of the X-rays, emitted from extremely hot gas. This gas does not emit a significant amount of optical light, and was only detected by Chandra.

Original Source: Hubble News Release