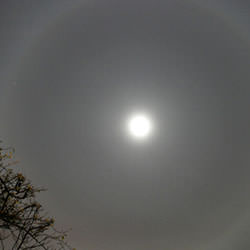
Lunar halo. Image credit: Steve Mandel. Click to enlarge.
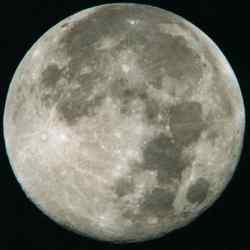
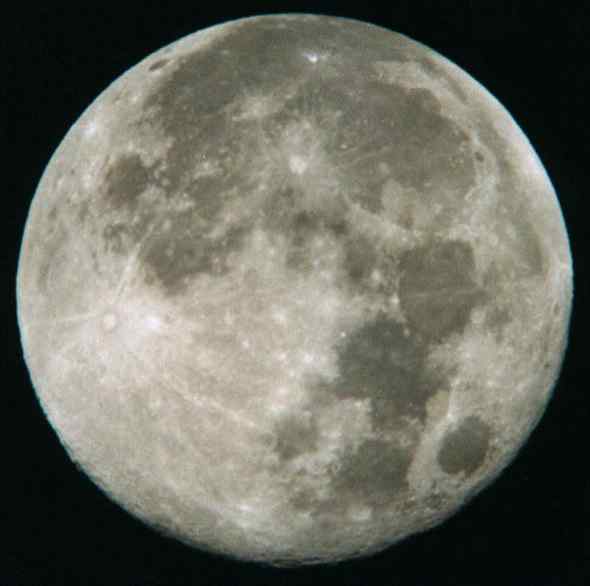
Monday, February 13 – Tonight is Full Moon. During the month of February the upper northern hemisphere is often heavy with snow. Native Indian tribes of the north and east called February’s Full Moon the Full Snow Moon. Some tribes also referred to this Moon as the Full Hunger Moon as artic weather conditions often made hunting and food gathering very unproductive.
Tonight let’s have a look at a pair of single stars that make up Gemini (the Twins): Castor and Pollux.
In Greek mythology, Castor and Pollux were fathered by the Greek god Zeus (Jupiter) who took the form of a swan and came upon a beautiful mortal woman. Pollux later grew up to become a skilled boxer and Castor, a master horseman. The two brothers were inseparable. It is said that they rescued the beautiful Helen from Troy, traveled with Jason and the Argonauts, and ultimately found themselves in a mortal battle with another pair of twin brothers over a beautiful woman. Pollux was so grief stricken at Castor’s death that he cried out to Zeus and offered up his own immortality in exchange for Castor’s life. Zeus took pity on the twins and placed them in the sky. You can see them tonight with your own eyes joined seemingly eternally together in Gemini.
As you observe this pair note that although Castor is almost half a magnitude fainter than Pollux, Bayer gave that star the title “Alpha Geminorum.” Which one do you think appears brighter? There’s more about both stars to come.
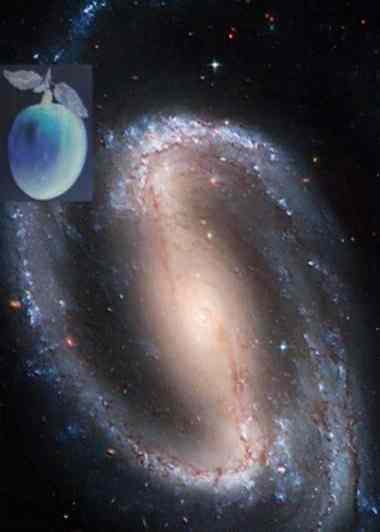
Tuesday, February 14 – Happy Valentine’s Day! Today is the birth date of Fritz Zwicky. Born in 1898, Zwicky was the first astronomer to identify supernovae as a separate class of objects. His insights also proposed the possibility of neutron stars. Among his many achievements, Zwicky catalogued galaxy clusters and designed jet engines. He also suggested the redshift displayed in the spectra of distant galaxies could be caused by something other than universal expansion.
Tonight’s lunar feature for telescopes and binoculars is crater Langrenus. Named for the Belgian engineer and mathematician Michel Florent van Langren, crater Langrenus is easily found along the terminator slightly south of central. At this time its 132 km expanse will appear shallow and display a luminous central peak.
Since you have your scope out, why not turn it towards one of the brightest double stars in the night sky – Alpha Geminorum. It’s true. One of the twins is a twin! Separated by a little more than 3 arc seconds, this true binary pair of 2nd magnitude stars make Castor a splendid study – even in the smallest scopes.
Wednesday, February 15 – Born on this day in 1564 was the man who “fathered” modern astronomy – Galileo Galilei. Almost 4 centuries ago, Galileo became the first scientist to use a telescope for astronomical purposes and his first study was the Moon. His words, “Most beautiful and admirable is it to see the Moon’s luminous form… At nearly thirty diameters – some 900 times greater in region – anyone can perceive that the Moon is not covered with a smooth and uniform surface but in fact reveals great mountainous shelves, deep cavities, and gorges just like those of the Earth,” still echo true today.
Tonight the tiny crater named for Galileo will be visible on the surface, but seeing it – even in a telescope – will be a challenge. Look to the fully illuminated western edge. Almost central and caught on the edge of Oceanus Procellarum, you will see a small, bright ring. This is crater Reiner. You will find Galileo just a short hop to the northwest as a tiny, washed out feature. What a shame the cartographers did not pick a more vivid feature to honor the great Galileo!
Galileo is noted for making many wondrous discoveries, but did you know that he may have been the first astronomer to see the Trapezium in M42? Galileo included three of the four stars in a sketch based on what is probably a low power (27x) view of the Great Nebula. Tonight celebrate that unheralded discovery by using the lowest possible magnification and the smallest telescope you can find to get the “Galileo-eye view” of the Trapezium.
Thursday, February 16 – Today celebrates the birth of Francois Arago. Born in 1786, Arago was an early and enthusiastic supporter of the wave theory of light. His scientific achievements were many – including the 1811 invention of the polariscope. Arago was also a practiced astronomer and wrote 4 volumes entitled Astronomie Populaire in the mid-1800s. Arago’s polariscope revealed that light could be organized in such a way as to cause photons to have a similar electromagnetic orientation. Polarized light viewed through his polariscope could come close to disappearing when the instrument was rotated. Many amateur astronomers use polarizing filters to reduce the amount of glare from the Moon, but did you know that even starlight can be polarized?
In celebration of Arago’s birth, why not go out and have a look at one such star – Merope in the Pleiades. As you observe Merope keep in mind that its light doesn’t begin polarized. In passing through the Merope Nebula, it becomes filtered. Try using a polarized filter and compare the view without.
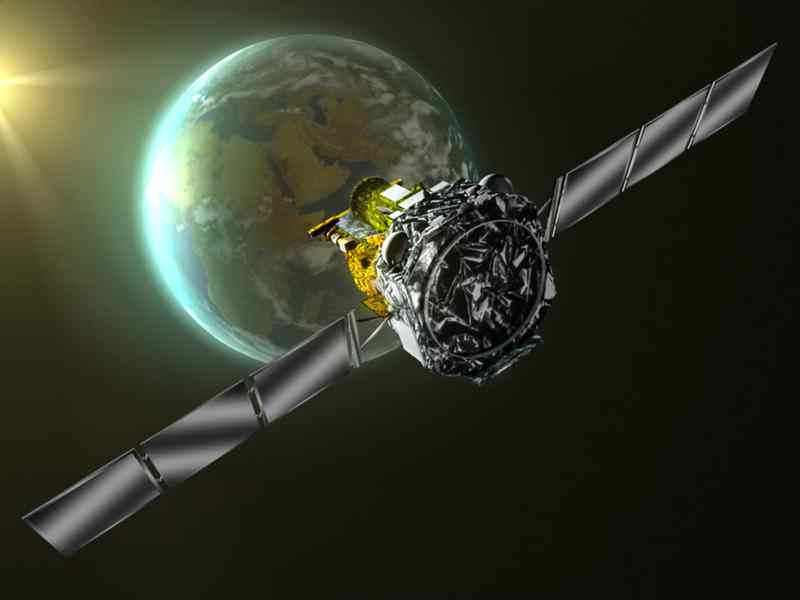
On this day in 1948, Gerard Kuiper was celebrating the discovery of Miranda – one of Uranus’ moons. At magnitude 16, few of us will ever see Kuiper’s discovery for ourselves. With Uranus now close to the Sun (near Lambda Aquarii), even it will be hard to see!
Friday, February 17 – For SkyWatchers this morning, many of you will have the opportunity to watch the Moon occult bright Spica – Alpha Virginis. Be sure to check with IOTA for times and locales.
Early evening means dark skies, so let’s take the opportunity to revisit two of the three Messier open clusters in Auriga and compare them with the similar, but fainter, NGC 1893.
NGC 1893 is similar to M36 in size, but four times fainter. On a good night, a small telescope can resolve more than a dozen faint stars in this 13,000 light-year distant open cluster. To find it, look around 3 degrees southwest of M38 and west of M36. The three clusters form an even triangle in the sky. In large binoculars or a rich-field telescope, the trio can be seen together as nebulous mists sprinkled with faint stars. Remember this cluster is also four times more distant than the Messier objects it shares Auriga with. It is estimated to be 10 million years old and it’s still in the process of giving birth to new stars. Reflection nebula IC 410 is also part of the NGC 1893. See if you can spot it!
Saturday, February 18 – On this day in 1930, a young man named Clyde Tombaugh was very busy with some photographic plates taken with the Lowell Observatory’s 13″ telescope. His reward? The discovery of Pluto!
Clyde discovered Pluto on a set of plates centered on the star Delta Geminorum – Wasat – a star lying very near the path the Sun takes across the sky. While we can’t see Pluto tonight, we can study this fine 3.5 magnitude star and its disparate companion.
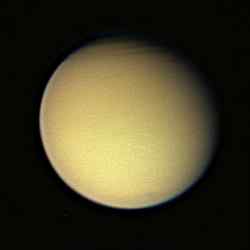
Once you’ve studied Wasat, you may notice Saturn gracing the early evening sky. As you observe Saturn’s magnificent ring system and four or five brightest moons, give some thought to distance and size. If our solar system was measured in units based on the Saturn-Sun distance – rather than Earth-Sun, Pluto would be 3.4 AUs from Sol. At 2274 kilometers in diameter, Pluto is less than half the size of Saturn’s largest satellite – Titan!
For deep sky, have a look at the rich open cluster NGC 2129. Located about a fingerwidth west of M35, at low power it may appear in the same field as Propus – 1 Geminorum. A rich-field scope or binoculars will frame M35 and NGC 2129 together.
Sunday, February 19 – Today is the birthday of Nicolas Copernicus. Born in 1473, Copernicus envisioned the modern solar system model which explained the retrograde motion of the outer planets. Considering this was well over 530 years ago, and in a rather unenlightened time, his revolutionary thinking is astounding. If you are up later, you can see the mighty crater named for Copernicus on the lunar surface almost central and west of the terminator.
But, before the Moon rises tonight, let’s turn our telescopes towards Saturn – one solar system body whose motion through the heavens exemplifies much of what Copernicus hoped his concept could explain! Among the “seven classical planets,” Saturn moves the slowest, taking almost two and a half years to move the thirty degrees related to each of the twelve “stations” planets pass through as they circle the ecliptic. Because of its slow pace, Saturn is often associated with “Chronos,” or Father Time, who wields his scythe and harvests a 30 year-long generation of humankind. Right now, Saturn is stationed in Cancer the Crab – one of the twelve “zodiacal,” or “animal signs” of the ecliptic. The Crab is joined with eleven other animals – preceded by neighboring Gemini, “the twin men,” and followed by Leo, “the solitary Lion.” By putting the Sun in the center of all this – rather than the Earth – Copernicus freed human thinking from the more ancient Ptolemaic system and allowed the solar Lion to stand at the center of things instead.
So, have another look at Saturn. Enjoy its low-contrast southern equatorial belt, subtly mottled blue polar region, and fine system of four easily seen satellites each moving much more rapidly around Saturn than the planet itself does around the Sun. Then think “Wow, that Copernicus guy would really have enjoyed seeing this!”
May all your journeys be at light speed… ~Tammy Plotner. Contibuting writer: Jeff Barbour @ astro.geekjoy.com

