Interesting Views from an Airplane

Subhorizon halos. Image credit: Don Davis. Click to enlarge
Thanksgiving is the biggest travel holiday of the year in the United States. Millions of people board airplanes and fly long hours to visit friends and family.

Do you dread the trip? Think of it as a sky watching opportunity. There are some things you can see only through the window of an airplane. Atmospheric optics expert Les Cowley lists a few of his favorites:

“Both sides of the aircraft have their own sights,” says Cowley. “On the side opposite the sun, the main thing to look for is the glory. Clouds below the aircraft are required. They are the canvas on which the glory is ‘painted.'”

“Look toward the antisolar point, the place in the clouds directly opposite the sun,” he instructs. “There, if the aircraft is low enough, you will find the shadow of the plane. Surrounding the shadow is the glory–a bright white glow surrounded by one or more shimmering rings of color.”

“These rings are formed when light is scattered backwards by individual water droplets in the cloud. The more uniform the size of the cloud droplets, the more rings you will see. They swell and contract as you travel over clouds with smaller or larger droplets.”

No clouds beneath you?

“In that case,” says Cowley, “another optical effect might be visible, especially over arid regions or pine forests. This is the opposition effect, a bright patch of light moving along the ground below you. The brightening, which is always directly opposite the sun, marks the point where the shadows of objects, like trees or soil granules, are hidden beneath those objects. The area consequently looks brighter, and slightly more yellow, than the surroundings.” (Click here to view an image of the opposition effect, photographed by Eva Seidenfaden flying over Uzbekstan.)

Turning to the sunward side of the aircraft…

“That is the realm of ice halos,” says Cowley. Ice halos are rings and arcs of light caused by ice crystals in high clouds. “They are often rainbow-colored,” he notes, “but they are not rainbows.”

From the ground you look up to see these halos. From an airplane you look down.

“You might be able to see subhorizon halos invisible from low ground,” says Cowley. “The brightest, sometimes blindingly bright, is the subsun. This is a direct reflection of the sun from millions of flat plate-shaped ice crystals floating in the clouds beneath you and acting together as a giant mirror. As the aircraft moves the subsun drifts along the clouds, sometimes growing, sometimes contracting, sometimes wobbling as crystals with different tilts are sampled. Sometimes a column of light will extend upward from the subsun toward the real sun–this is a lower sun pillar.”

“Sunrise and sunset from high altitudes are special,” Cowley adds. “The speed of the aircraft can make them faster or slower than usual. Furthermore, the sun is extra-flattened because its light is refracted almost twice the normal amount by its passage into the dense lower atmosphere and then out again to you. On a night flight, you might catch the moonrise; its distortions and flattening are greater for the same reason.”

“And if none of these things are visible on your particular flight, ignore fellow passengers and crane your head to see some of the sky above you. It is dark and a deep violet blue–darker than you will ever see on the ground. A large part of Earth’s atmosphere is beneath and there are far fewer molecules to scatter the sun’s light and turn the sky blue. You are not far from space.”

Happy Thanksgiving!

Original Source: NASA News Release

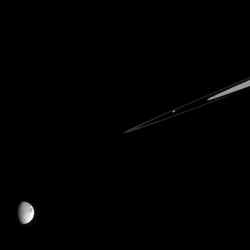
Wispy Terrain on Dione

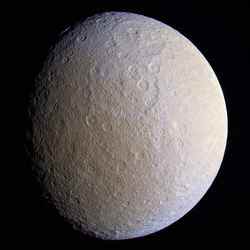
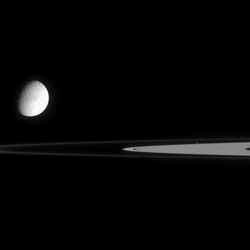
Saturn’s moon Dione. Image credit: NASA/JPL/SSI Click to enlarge
The soft appearance of Dione’s wispy terrains belies their true nature. They are, in fact, complex systems of crisp, braided fractures that cover the moon’s trailing hemisphere.

(See Dione’s Surprise for a closer view of the fractures.)

This view shows the western potion of the wispy terrain on Dione (1,126 kilometers, or 700 miles across). The craters Dido and Antenor can be seen near the terminator at lower left. In the rings above, the dark Cassini Division between the A and B rings is visible.

The image was taken in visible light with the Cassini narrow-angle camera on Oct. 9, 2005, at a distance of approximately 1.8 million kilometers (1.1 million miles) from Dione and at a Sun-Dione-spacecraft, or phase, angle of 52 degrees. The image scale is 11 kilometers (7 miles) per pixel.

The Cassini-Huygens mission is a cooperative project of NASA, the European Space Agency and the Italian Space Agency. The Jet Propulsion Laboratory, a division of the California Institute of Technology in Pasadena, manages the mission for NASA’s Science Mission Directorate, Washington, D.C.

The Cassini orbiter and its two onboard cameras were designed, developed and assembled at JPL. The imaging operations center is based at the Space Science Institute in Boulder, Colo. For more information about the Cassini-Huygens mission visit http://saturn.jpl.nasa.gov . The Cassini imaging team homepage is at http://ciclops.org .

Original Source: NASA/JPL/SSI News Release

Mars Reconnaissance Orbiter is Halfway to Mars

Artist’s concept of Mars Reconnaissance Orbiter. Image credit: NASA/JPL. Click to enlarge
NASA’s Mars Reconnaissance Orbiter successfully fired six engines for about 20 seconds today to adjust its flight path in advance of its March 10, 2006, arrival at the red planet.

Since its Aug. 12 launch, the multipurpose spacecraft has covered about 60 percent of the distance for its trip from Earth to Mars. It will fly about 40-million kilometers (25-million miles) farther before it enters orbit around Mars. It will spend half a year gradually adjusting the shape of its orbit, then begin its science phase. During that phase, it will return more data about Mars than all previous missions combined. The spacecraft has already set a record transmission rate for an interplanetary mission, successfully returning data at 6 megabits per second, fast enough to fill a CD-ROM every 16 minutes.

“Today’s maneuver mainly increases the speed to bring us to the target point at just the right moment,” said Tung-hanYou, chief of the Mars Reconnaissance Orbiter navigation team at NASA’s Jet Propulsion Laboratory, Pasadena, Calif. The intended nudge in velocity is 75 centimeters per second (less than 2 miles per hour). The spacecraft’s speed relative to the sun is about 27 kilometers per second (61,000 miles per hour).

Four opportunities for course adjustments were planned into the schedule before launch. Today’s, the second, used only the trajectory-correction engines. Each engine produces about 18 newtons (4 pounds) of thrust. The first course adjustment, on Aug. 27, doubled as a test of the six main engines, which produce nearly eight times as much thrust. Those main engines will have the big job of slowing the spacecraft enough to be captured into orbit when it reaches Mars. The next scheduled trajectory adjustment, on Feb. 1, 2006, and another one 10 days before arrival will be used, if necessary, for fine tuning, said JPL’s Allen Halsell, the mission’s deputy navigation chief.

The Mars Reconnaissance Orbiter mission will examine Mars in unprecedented detail from low orbit. Its instrument payload will study water distribution — including ice, vapor or liquid — as well as geologic features and minerals. The orbiter will also support future missions to Mars by examining potential landing sites and by providing a high-data-rate relay for communications back to Earth.

The mission is managed by JPL, a division of the California Institute of Technology, Pasadena, for the NASA Science Mission Directorate. Lockheed Martin Space Systems, Denver, is the prime contractor for the project and built the spacecraft.

For information about the Mars Reconnaissance Orbiter on the Web, visit http://www.nasa.gov/mro . For information about NASA and agency programs on the Web, visit http://www.nasa.gov/home/index.html .

Original Source: NASA News Release

Book Review: Empire of the Stars

Subrahmanyan Chandrasekhar, or Chandra, was a child prodigy in India. Straight from excelling at undergraduate school in the depths of India, he entered the cool, damp climes of Cambridge University. With few compatriots and little experience in the ways of English university rapport, he tried his best to add something useful. Excelling in mathematics and wanting to make a mark, he entered into the relatively new field of astrophysics. In particular, he established a mathematical basis for the degeneration of stars. The problem, of course, was that on the death of too large a star, the math showed that a death-knell implosion would lead to an infinite amount of mass in a negligible volume. As physicists had accepted that nature abhors vacuums and infinites, no one supported Chandra’s results, even though they agreed with the mathematics. Only 40 years later, with advances in knowledge together with the detection of the signatures of black holes in space, did Chandra get vindicated. Though he lived to see this result, given the initial umbrage, especially from Sir Arthur Eddington, Chandra was less than pleased.

Bringing the human dimension into scientific discovery can be fascinating. Arthur Miller depicts this well on delivering his review of the reception of Chandra’s calculations for the degeneration of white dwarfs. Chandra was a ‘wet behind the ears’ new graduate who believed in the scientific method for establishing or disproving theories. Implying this, Miller then shows that Chandra met formidable and conjectural resistance from the accepted world expert and fellow Cambridge astrophysicist Sir Arthur Eddington. Miller recovers details from original documentation showing how Chandra had the verbal support from most if not all the preeminent practitioners of the field like Bohr, Dirac, and Pauli. But none wrote any support for Chandra, for concern, as Miller put it, of crossing Eddington.

As evidenced by over 50 pages of referenced material, Miller provides credible details of the happenings of 70 years ago. He was hampered in that the estate of Sir Arthur Eddington had long ago destroyed almost all his personal papers. Further, Chandra usually worked solo, so few others could provide descriptions of his character. Because of this, Miller dedicates only one chapter to Chandra, describing his early years, while another describes Eddington’s. Thus, he makes up for a lack of personal information by providing details on the many other people who kept filling in the puzzle regarding black holes. Often a page or two will give personal experiences, like Karl Schwarzschild’s time in the front lines, or Yakov Zel’dovich playing catch with a medicine ball. Sometimes he goes far afield by including anecdotes of commuters who took the long way to Los Alamos via a bar in Mexico. However, these snippets add pleasant colour to this historical synopsis. As such, the centre of the book contains more a series of personalities and their contributions rather than relevance to Chandra and Eddington.

Because of this, Miller falls a bit flat on his original postulation that Eddington’s displeasure with Chandra’s presentation in 1935 held the field of astrophysics back for 40 years. Rather, Miller, in later chapters, indicates that Chandra maintained a voluminous production of highly regarded mathematics, garnering most of the top awards which cumulated in a Nobel prize. Further, Miller shows a steady progress in astrophysics. That is, though Chandra’s mathematical speculations weren’t accepted, experimenters kept advancing our understanding. It seems Miller joined two ideas into one book. One examines the interaction between Eddington and Chandra. The other reviews the chronological steps in astrophysics, particularly regarding star degeneration. The sum is a personable history of late twentieth century astrophysics with particular emphasis on two early contributors.

Some people naturally have gifts that lend themselves to scientific explanation. However, people come with a complete suite of less than stellar personalities. As such, theorists can have a really rough time until practitioners catch up. Arthur Miller in Empire of the Stars describes the trying time of Subrahmanyan Chandrasekhar who believed in black holes long before any evidence arose. But Miller shows how experimenters did catch up to this theorist who was looking so far ahead of most everyone else.

Review by Mark Mortimer

Read more reviews online, or purchase a copy from Amazon.com.

What’s Up This Week – November 21 – November 27, 2005

M2: Doug Williams – REU Program – NOAO/AURA/NSF
Monday, November 21 – Tonight let’s start with a wonderful globular cluster that gives the very best of all worlds – one that can be seen in even the smallest of binoculars and from both hemispheres! Your destination is about one-third the distance between Beta Aquarii and Epsilon Pegasi…

First recorded by Maraldi in 1746 and cataloged by Messier in 1760, the 6.0 magnitude M2 is one of the finest and brightest of Class II globular clusters. At 13 billion years old, this rich galactic globular is one of the oldest in our galaxy and its position in the halo puts it directly beneath the Milky Way’s southern pole. In excess of 100,000 faint stars form a well concentrated sphere which spans across 150 light-years – one that shows easily to any optical aid. While only larger scopes will begin resolution on this awesome cluster’s yellow and red giants, we’d do well to remember that our own Sun would be around the 21st magnitude if it were as distant as this ball of stars!

Tuesday, November 22 – With the Moon comfortably out of the way this evening, let’s head for the constellation of Cetus and a dual study as we conquer NGC 246 and NGC 255.

Located about four finger widths north of bright Beta Ceti – and triangulating south with Phi 1, 2 and 3 – is our first mark. NGC 246 is an 8.0 magnitude planetary nebula which will appear as a slightly out-of-focus star in binoculars, but a whole lot like a Messier object to a small scope. Here is the southern sky’s version of the “Ring Nebula.” While this one is actually a bit brighter than its M57 counterpart, larger scopes might find its 12.0 magnitude central star just a little bit easier to resolve.

If you are using large aperture, head just a breath northwest and see if you can capture small and faint galaxy NGC 255. This 12.8 magnitude spiral will show a very round signature with a gradual brightening towards the nucleus and a hint of outer spiral arms.

Wednesday, November 23 – Tonight in 1885, the very first photograph of a meteor shower was taken. Also, weather satellite Tiros II was launched on this day in 1960. Carried to orbit by a three-stage Delta rocket, the “Television Infrared Observation Satellite” was about the size of a barrel, testing experimental television techniques and infrared equipment. Operating for 376 days, Tiros II sent back thousands of pictures of Earth’s cloud cover and was successful in its experiments to control orientation of satellite spin and infrared sensors. Oddly enough, on this day in 1977 a similar mission – Meteosat 1- became the first satellite put into orbit by the European Space Agency. Where is all this leading? Why not try observing satellites on your own! Thanks to wonderful on-line tools like Heavens-Above, you’ll be “in the know” whenever a bright satellite makes a pass for your specific area. It’s fun!

Thursday, November 24 – Tonight let’s return to Cassiopeia and start first by exploring the central most bright star – Gamma. At approximately 100 light-years away, Gamma is very unusual. Once thought to be a variable, this particular star has been known to go through some very radical changes in its temperature, spectrum, magnitude, color and even diameter! Gamma is also a visual double star, but the 11th magnitude companion is highly difficult to perceive so close (2.3″) to the primary.

Four degrees southeast of Gamma is our marker for this starhop, Phi Cassiopeiae. By aiming binoculars or telescopes at this star, it is very easy to locate an interesting open cluster – NGC 457 – in the same field of view. This bright and splendid galactic cluster has received a variety of names over the years because of its uncanny resemblance to a figure.

Both Phi and HD 7902 may not be true members of the cluster. If magnitude 5 Phi were actually part of this grouping, it would have to have a distance of approximately 9300 light-years, making it the most luminous star in the sky! The fainter members of NGC 457 comprise a relatively “young” star cluster that spans about 30 light-years across. Most of the stars are only about 10 million years old, yet there is an 8.6 magnitude red supergiant in the center.

Friday, November 25 – If you live in the northeastern United States or Canada, it would be worth getting up early this morning as the Moon occults bright Sigma Leonis. Be sure to check IOTA for times and locations near you!

Tonight we’re heading south and our goal will be about two finger widths north-northwest of Alpha Phoenicis.

At magnitude 7.8, this huge member of the Sculptor Galaxy Group, known as NGC 55, will be a treat to both binoculars and telescopes. Somewhat similar to the large Magellanic Cloud in structure, those in the southern hemisphere will have an opportunity to see a galaxy very similar in appearance to M82 – but on a much grander scale! Larger scopes will show mottling in structure, resolution of individual stars and nebulous areas, as well as a very prominent central dark dust cloud. Like its northern counterpart, both the Ursa Major and Sculptor Group are around the same distance from our own Local Group.

Saturday, November 26 – This morning it is our Russian comrades’ turn as the Moon occults Beta Virginis. As always, times and locations can be found on the IOTA website! Today also marks the launch of the first French satellite – Asterix 1.

It’s time to head north again as we turn our eyes towards 1000 light-year distant Delta Cephei, one of the most famous of all variables. It is an example of a “pulsing variable” – one whose magnitude changes are not attributed to an eclipsing companion, but to the expansion and contraction of the star itself. For unaided observers, discover what John Goodricke did in 1784… You can follow its near one magnitude variability by comparing it to nearby Epsilon and Zeta. It rises to maximum in about a day and a half, yet the fall takes about four days.

Let’s travel about a finger width southeast of Delta Cephei for new open cluster NGC 7380. This large gathering of stars has a combined magnitude of 7.2. Like many young clusters, it is embroiled in faint nebulosity. Surrounded by a dispersed group of brighter stars, the cluster itself can be seen in binoculars and may resolve around three dozen faint members to mid-aperture.

Before you leave, return to Delta Cephei and take a closer look. It is also a well-known double star that was measured by F.G.W. Struve in 1835. Its 6.3 magnitude companion has not shown change in position or separation angle in the 171 years since Struve looked at it – and as we see it now. Chances are, this means the two are probably not a physical pair. S.W. Burnham discovered a third, 13th magnitude companion in 1878. Enjoy the color contrast between its members!

Sunday, November 27 – Tonight let’s use binoculars or small scopes to go northern and southern “cluster hunting.”

The first destination is NGC 7654, but you’ll find it more easily by its common name of M52. To find it with binoculars, draw a mental line between Alpha and Beta Cassiopeiae and extend it about the same distance along the same trajectory. This mixed magnitude cluster is bright and easy.

The next, NGC 129, is located almost directly between Gamma and Beta. This is also a large, bright cluster that resolves in a small scope but shows at least a dozen of its 35 members to binoculars. Near the cluster’s center and north of a pair of matched magnitude stars is Cepheid variable DI Cassiopeiae – which changes by about a magnitude in a period of a week.

Now head for northeastern Epsilon Cassiopeiae and hop about three finger widths to the east-southeast. Here you will find 3300 light-year distant NGC 1027. As an attractive “starry swatch” in binoculars, small scopes will have a wonderful time resolving its 40 or more faint members.
If you live south, have a look at open cluster IC 2602. This very bright, mixed magnitude cluster includes 3.0 magnitude Theta Carinae. Seen easily unaided, this awesome open cluster contains around 30 stars. Be sure to look on its southwest edge with binoculars or scopes for a smaller feature overshadowed by the grander companions. Tiny by comparison, Melotte 101 will appear like a misty patch of faint stars. Enjoy!

Until next week… May all your journeys be at light speed! ~Tammy Plotner

Why is Moondust So Clingy?

A single grain of moondust hangs suspended in Abba’s vacuum chamber. Image credit: NASA Click to enlarge
Each morning, Mian Abbas enters his laboratory and sits down to examine–a single mote of dust. Zen-like, he studies the same speck suspended inside a basketball-sized vacuum chamber for as long as 10 to 12 days.

The microscopic object of his rapt attention is not just any old dust particle. It’s moondust. One by one, Abbas is measuring properties of individual dust grains returned by Apollo 17 astronauts in 1972 and the Russian Luna-24 sample-return spacecraft that landed on the Moon in 1976.

“Experiments on single grains are helping us understand some of the strange and complex properties of moondust,” says Abbas. This knowledge is important. According to NASA’s Vision for Space Exploration, astronauts will be back on the moon by 2018–and they’ll have to deal with lots of moondust.

The dozen Apollo astronauts who walked on the moon between 1969 and 1972 were all surprised by how “sticky” moondust was. Dust got on everything, fouling tools and spacesuits. Equipment blackened by dust absorbed sunlight and tended to overheat. It was a real problem.

Many researchers believe that moondust has a severe case of static cling: it’s electrically charged. In the lunar daytime, intense ultraviolet (UV) light from the sun knocks electrons out of the powdery grit. Dust grains on the moon’s daylit surface thus become positively charged.

Eventually, the repulsive charges become so strong that grains are launched off the surface “like cannonballs,” says Abbas, arcing kilometers above the moon until gravity makes them fall back again to the ground. The moon may have a virtual atmosphere of this flying dust, sticking to astronauts from above and below.

Or so the theory goes.

But do grains of lunar dust truly become positively charged when illuminated by ultraviolet light? If so, which grains are most affected–big grains or little grains? And what does moondust do when it’s charged?

These are questions Abbas is investigating in his “Dusty Plasma Laboratory” at the National Space Science and Technology Center in Huntsville, Alabama. Along with colleagues Paul Craven and doctoral student Dragana Tankosic, Abbas injects a single grain of lunar dust into a chamber and “catches” it using electric force fields. (The injector gives the grain a slight charge, allowing it to be handled by electric fields.) With the grain held suspended literally in mid-air, they “pump the chamber down to 10-5 torr to simulate lunar vacuum.”

Next comes the mesmerizing part: Abbas shines a UV laser on the grain. As expected, the dust gets “charged up” and it starts to move. By adjusting the chamber’s electric fields with painstaking care, Abbas can keep the grain centered; he can measure its changing charge and explore its fascinating characteristics.

Like the Apollo astronauts, Abbas has already discovered some surprises–even though his experiment is not yet half done.

“We’ve found two things,” says Abbas. “First, ultraviolet light charges moondust 10 times more than theory predicts. Second, bigger grains (1 to 2 micrometers across) charge up more than smaller grains (0.5 micrometer), just the opposite of what theory predicts.”

Clearly, there’s much to learn. For instance, what happens at night, when the sun sets and the UV light goes away?

That’s the second half of Abbas’s experiment, which he hopes to run in early 2006. Instead of shining a UV laser onto an individual lunar particle, he plans to bombard dust with a beam of electrons from an electron gun. Why electrons? Theory predicts that lunar dust may acquire negative charge at night, because it is bombarded by free electrons in the solar wind–that is, particles streaming from the sun that curve around behind the moon and hit the night-dark soil.

When Apollo astronauts visited the Moon 30+ years ago, they landed in daylight and departed before sunset. They never stayed the night, so what happened to moondust after dark didn’t matter. This will change: The next generation of explorers will remain much longer than Apollo astronauts did, eventually setting up a permanant outpost. They’ll need to know, how does moondust behave around the clock?

Stay tuned for answers from the Dusty Plasma Lab.

Original Source: NASA News Release

Radiation Resistant Computers

EAFTC computers in a space-ready flight chassis. Image credit: NASA/Honeywell. Click to enlarge
Unfortunately, the radiation that pervades space can trigger such glitches. When high-speed particles, such as cosmic rays, collide with the microscopic circuitry of computer chips, they can cause chips to make errors. If those errors send the spacecraft flying off in the wrong direction or disrupt the life-support system, it could be bad news.

To ensure safety, most space missions use radiation hardened computer chips. “Rad-hard” chips are unlike ordinary chips in many ways. For example, they contain extra transistors that take more energy to switch on and off. Cosmic rays can’t trigger them so easily. Rad-hard chips continue to do accurate calculations when ordinary chips might “glitch.”

NASA relies almost exclusively on these extra-durable chips to make computers space-worthy. But these custom-made chips have some downsides: They’re expensive, power hungry, and slow — as much as 10 times slower than an equivalent CPU in a modern consumer desktop PC.

With NASA sending people back to the moon and on to Mars–see the Vision for Space Exploration–mission planners would love to give their spacecraft more computing horsepower.

Having more computing power onboard would help spacecraft conserve one of their most limited resources: bandwidth. The bandwidth available for beaming data back to Earth is often a bottleneck, with transmission speeds even slower than old dial-up modems. If the reams of raw data gathered by the spacecraft’s sensors could be “crunched” onboard, scientists could beam back just the results, which would take much less bandwidth.

On the surface of the moon or Mars, explorers could use fast computers to analyze their data right after collecting it, quickly identifying areas of high scientific interest and perhaps gathering more data before a fleeting opportunity passes. Rovers would benefit, too, from the extra intelligence of modern CPUs.

Using the same inexpensive, powerful Pentium and PowerPC chips found in consumer PCs would help tremendously, but to do so, the problem of radiation-induced errors must be solved.

This is where a NASA project called Environmentally Adaptive Fault-Tolerant Computing (EAFTC) comes in. Researchers working on the project are experimenting with ways to use consumer CPUs in space missions. They’re particularly interested in “single event upsets,” the most common kind of glitches caused by single particles of radiation barreling into chips.

Team member Raphael Some of JPL explains: “One way to use faster, consumer CPUs in space is simply to have three times as many CPUs as you need: The three CPUs perform the same calculation and vote on the result. If one of the CPUs makes a radiation-induced error, the other two will still agree, thus winning the vote and giving the correct result.”

This works, but often it’s overkill, wasting precious electricity and computing power to triple-check calculations that aren’t critical.

“To do this smarter and more efficiently, we’re developing software that weighs the importance of a calculation,” continues Some. “If it’s very important, like navigation, all three CPUs must vote. If it’s less important, like measuring the chemical makeup of a rock, only one or two CPUs might be involved.”

This is just one of dozens of error-correction techniques that EAFTC pulls together into a single package. The result is much better efficiency: Without the EAFTC software, a computer based on consumer CPUs needs 100-200% redundancy to protect against radiation-caused errors. (100% redundancy means 2 CPUs; 200% means 3 CPUs.) With EAFTC, only 15-20% redundancy is needed for the same degree of protection. All of that saved CPU time can be used productively instead.

“EAFTC is not going to replace rad-hard CPUs,” cautions Some. “Some tasks, such as life support, are so important we’ll always want radiation hardened chips to run them.” But, in due course, EAFTC algorithms might take some of the data-processing load off those chips, making vastly greater computer power available to future missions.

EAFTC’s first test will be onboard a satellite called Space Technology 8 (ST-8). Part of NASA’s New Millennium Program, ST-8 will flight-test new, experimental space technologies such as EAFTC, making it possible to use them in future missions with greater confidence.
The satellite, scheduled for a 2009 launch, will skim the Van Allen radiation belts during each of its elliptical orbits, testing EAFTC in this high-radiation environment similar to deep space.

If all goes well, space probes venturing across the solar system may soon be using the exact same chips found in your desktop PC — just without the glitches.

Original Source: NASA News Release

Early Earth Wasn’t So Hellish

The Earth. Image credit: NASA. Click to enlarge
New ANU research is set to radically overturn the conventional wisdom that early Earth was a hellish planet barren of continents.

An international research team led by Professor Mark Harrison of the Research School of Earth Sciences analysed unique 4 to 4.35 billion-year-old minerals from outback Australia and found evidence that a fringe theory detailing the development of continents during the first 500 million years of Earth history – the Hadean (“hellish”) Eon – is likely to be correct.

The research, published in the latest edition of Science, follows on from results by Professor Harrison and his colleagues published earlier this year that confirmed that our planet was also likely to have had oceans during most of the Hadean.

“A new picture of early Earth is emerging,” Professor Harrison said. “We have evidence that the Earth’s early surface supported water – the key ingredient in making our planet habitable. We have evidence that this water interacted with continent-forming magmas throughout the Hadean.

“And now we have evidence that massive amounts of continental crust were produced almost immediately upon Earth formation. The Hadean Earth may have looked much like it does today rather than our imagined view of a desiccated world devoid of continents.”

Professor Harrison and his team gathered their evidence from zircons, the oldest known minerals on Earth, called zircons. These ancient grains, typically about the width of a human hair, are found only in the Murchison region of Western Australia. The team analysed the isotopic properties of the element hafnium in about 100 tiny zircons that are as old as 4.35 billion years.

Conventionally, it has been believed that the Earth’s continents developed slowly over a long period of time beginning about 4 billion years ago – or 500 million years after the planet formed.

However, hafnium isotope variations produced by the radioactive decay of an isotope of lutetium indicate many of these ancient zircons formed in a continental setting within about 100 million years of Earth formation.

“The evidence points to almost immediate development of continent followed by its rapid recycling back into the mantle via a process akin to modern plate tectonics,” according to Professor Harrison.

The isotopic imprint left on the mantle by early melting shows up again in younger zircons – providing evidence that they have tapped the same source. This suggests that the amount of mantle processed to make continent must have been enormous.

“The results are consistent with the Earth hosting a similar mass of continental crust as the present day at 4.5-4.4 billion years.

“This is a radical departure from conventional wisdom regarding the Hadean Earth,” said Professor Harrison.

“But these ancient zircons represent the only geological record we have for that period of Earth history and thus the stories they tell take precedence over myths that arose in the absence of observational evidence.”

“The simplest explanation of all the evidence is that essentially from its formation, the planet fell into a dynamic regime that has persisted to the present day.”

Original Source: ANU News Release

More Einstein Rings Discovered

Einstein ring gravitational lens: SDSS J163028.15+452036.2. Image credit: Hubble. Click to enlarge
As Albert Einstein developed his theory of general relativity nearly a century ago, he proposed that the gravitational field from massive objects could dramatically warp space and deflect light.

The optical illusion created by this effect is called gravitational lensing. It is nature’s equivalent of having a giant magnifying lens in space that distorts and amplifies the light of more distant objects. Einstein described gravitational lensing in a paper published in 1936. But he thought the effect was unobservable because the optical distortions produced by foreground stars warping space would be too small to ever be measurable by the largest telescopes of his time.

Now, almost a century later, astronomers have combined two powerful astronomical assets, the Sloan Digital Sky Survey (SDSS) and NASA’s Hubble Space Telescope, to identify 19 new “gravitationally lensed” galaxies, adding significantly to the approximately 100 gravitational lenses previously known. Among these 19, they have found eight new so-called “Einstein rings”, which are perhaps the most elegant manifestation of the lensing phenomenon. Only three such rings had previously been seen in visible light.

In gravitational lensing, light from distant galaxies can be deflected on its way to Earth by the gravitational field of any massive object that lies in the way. Because of this, we see the galaxy distorted into an arc or multiple separate images. When both galaxies are exactly lined up, the light forms a bull’s-eye pattern, called an Einstein ring, around the foreground galaxy.

The newly discovered lenses come from an ongoing project called the Sloan Lens ACS Survey (SLACS). A team of astronomers, led by Adam Bolton of the Harvard-Smithsonian Center for Astrophysics in Cambridge, Mass., and Leon Koopmans of the Kapteyn Astronomical Institute in the Netherlands, selected the candidate lenses from among several hundred thousand optical spectra of elliptical galaxies in the Sloan Digital Sky Survey. They then used the sharp eyes of Hubble’s Advanced Camera for Surveys to make the confirmation.

“The massive scale of the SDSS, together with the imaging quality of the Hubble telescope, has opened up this unprecedented opportunity for the discovery of new gravitational lenses,” Bolton explained. “We’ve succeeded in identifying the one out of every 1,000 galaxies that show these signs of gravitational lensing of another galaxy.”

The SLACS team scanned the spectra of approximately 200,000 galaxies 2 to 4 billion light-years away. The team was looking for clear evidence of emission from galaxies twice as far from Earth and directly behind the closer galaxies. They then used Hubble’s Advanced Camera for Surveys to snap images of 28 of these candidate lensing galaxies. By studying the arcs and rings produced by 19 of these candidates, the astronomers can precisely measure the mass of the foreground galaxies.

Besides producing odd shapes, gravitational lensing gives astronomers the most direct probe of the distribution of dark matter in elliptical galaxies. Dark matter is an invisible and exotic form of matter that has not yet been directly observed. Astronomers infer its existence by measuring its gravitational influence. Dark matter is pervasive within galaxies and makes up most of the total mass of the universe. By searching for dark matter in galaxies, astronomers hope to gain insight into galaxy formation, which must have started around lumpy concentrations of dark matter in the early universe.

“Our results indicate that, on average, these ‘elliptical lensing galaxies’ have the same special mass-density structure as that observed in spiral galaxies,” Bolton continued. “This corresponds to an increase in the proportion of dark matter relative to stars as one moves away from the center of the lensing galaxy and into its fainter outskirts. And since these lensing gelaxies are relatively bright, we can solidify this result with further ground-based spectroscopic observations of the stellar motions in the lenses.”

“Being able to study these and other gravitational lenses as far back in time as several billion years allows us to see directly whether the distribution of dark [invisible] and visible mass changes with cosmic time,” Dr. Koopmans added. “With this information, we can test the commonly held idea that galaxies form from collision and mergers of smaller galaxies.”

The Sloan Digital Sky Survey, from which the SLACS lens-candidate sample was selected, was begun in 1998 with a custom-built ground-based telescope to measure the colors and brightnesses of more than 100 million objects over a quarter of the sky and map the distances to a million galaxies and quasars. “This type of gravitational-lens survey was not an original goal of the SDSS, but was made possible by the excellent quality of the SDSS data,” said Scott Burles of the Massachusetts Institute of Technology in Cambridge, Mass., a SLACS team member and one of the creators of the SDSS.

“An additional bonus of the large size of the SDSS database is that we can design our search criteria so as to find the lenses that are most suitable for specific science goals,” said SLACS team member Tommaso Treu of the University of California, Santa Barbara. “Whereas until now we have selected the largest galaxies as our targets, in the next stages of the survey we are targeting smaller lens galaxies. There have been suggestions that the structure of galaxies changes with galaxy size. By identifying these rare objects ‘on demand,’ we will soon be able for the first time to test whether this is true.”

Added SLACS team member Leonidas Moustakas of the NASA Jet Propulsion Laboratory and the California Institute of Technology in Pasadena, Calif.: “These Einstein rings also give an unrivaled magnified view of the lensed galaxies, allowing us to study the stars and the formation histories of these distant galaxies.”

The SLACS Survey is continuing, and so far the team has used Hubble to study almost 50 of their candidate lensing galaxies. The eventual total is expected to be more than 100, with many more new lenses among them. The initial findings of the survey will appear in the February 2006 issue of the Astrophysical Journal and in two other papers that have been submitted to that journal.

Original Source: Hubblesite News Release

Mars Express Radar Data is Coming In

Artist’s impression of MARSIS deployment complete. Image credit: ESA. Click to enlarge
The Mars Express radar, MARSIS, has now been deployed for more than four months. Here we report on the activities so far.

For the operational period up to now, Mars Express has been making its closest approaches to Mars predominantly in the daytime portion of its orbit. The MARSIS radar’s scientists are mainly collecting data about the upper layers of the Martian atmosphere, or “ionosphere”, which is the highly electrically conducting layer that is maintained by sunlight.

They are also continuing the laborious analysis of all data gathered during the first night-time observations last summer, especially in the search for and interpretation of possible signals from subsurface layers. This includes the search for a possible signature of underground water, in frozen or liquid state.

Radar science is a complex business – it is based on the detection of radio waves reflected by boundaries between different materials. By analysis of these “echoes”, it is possible to deduce information about the kind of material causing the reflection, such as estimates of its composition and physical state.

Different materials are characterised by their “dielectric constant”, that is the specific way they interact with electromagnetic radiation, such as radio waves. When a radio wave crosses the boundary of different layers of “material”, an echo is generated and carries a sort of “fingerprint” from the specific materials.

From the time delay for an echo to be received by the radar instrument, the distance or the depth of the layers of material producing the echo can be deduced.

While the Mars Express point closest approach is in daylight, MARSIS is only operating at higher frequencies within its capability because the lower-frequency radio signals get disturbed. With these higher frequencies, MARSIS can study the ionosphere and the surface, while some shallow subsurface sounding can still be attempted.

During night-time observations, like those performed briefly last summer immediately after deployment, it is possible for MARSIS to use all frequencies for scientific measurements, including the lowest ones, suitable for penetrating under the soil of Mars.

Tuning to different frequencies for different targets in different conditions is not the only secret of MARSIS. The instrument, responding to signals reflected from any direction, requires scientists also do a huge amount of analysis work to remove these interfering signals from the echoes.

A typical example of what they look for is “clutter backscattering”, which are reflections apparently coming from the subsurface, but actually produced by irregularities in the surface terrain that delay the return of the echo. For this “cleaning” work, the team also makes use of “surface echo simulator” computer programs.

In the first months of operations, MARSIS performed its first ionospheric sounding. The data are converted into typical plots, called “ionograms”, where the altitude at which the echo was generated, deduced by the echo time delay, is given for each transmitted frequency. The intensity of the various echo signals detected is indicated in different colours.

In parallel to the analysis of surface and subsurface signals, the scientists are studying all ionograms to draw the first conclusions on the nature and behaviour of the ionosphere of Mars, and of its interaction with the planet and the surrounding environment.

Original Source: ESA Portal