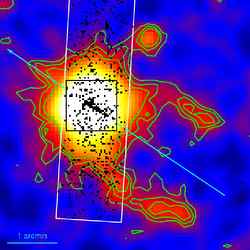
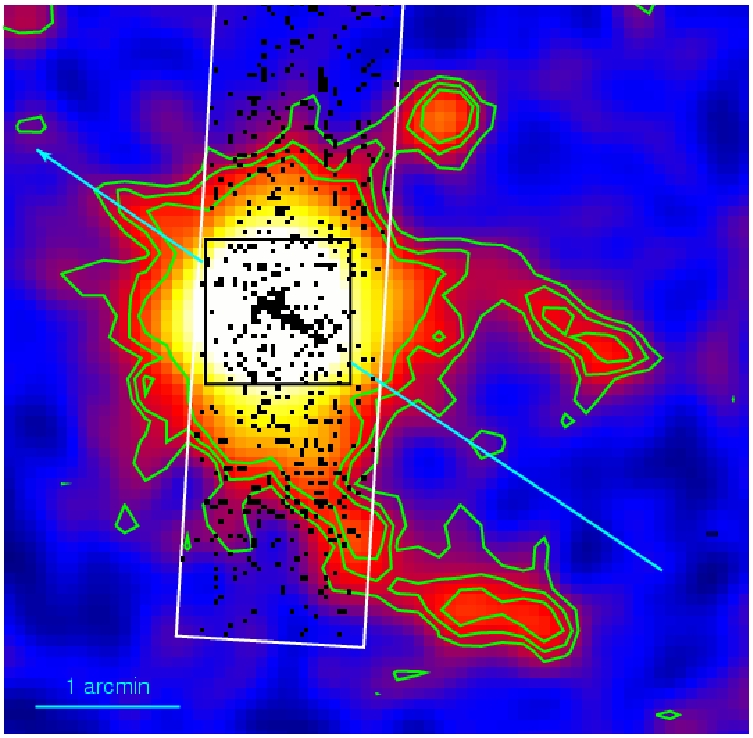
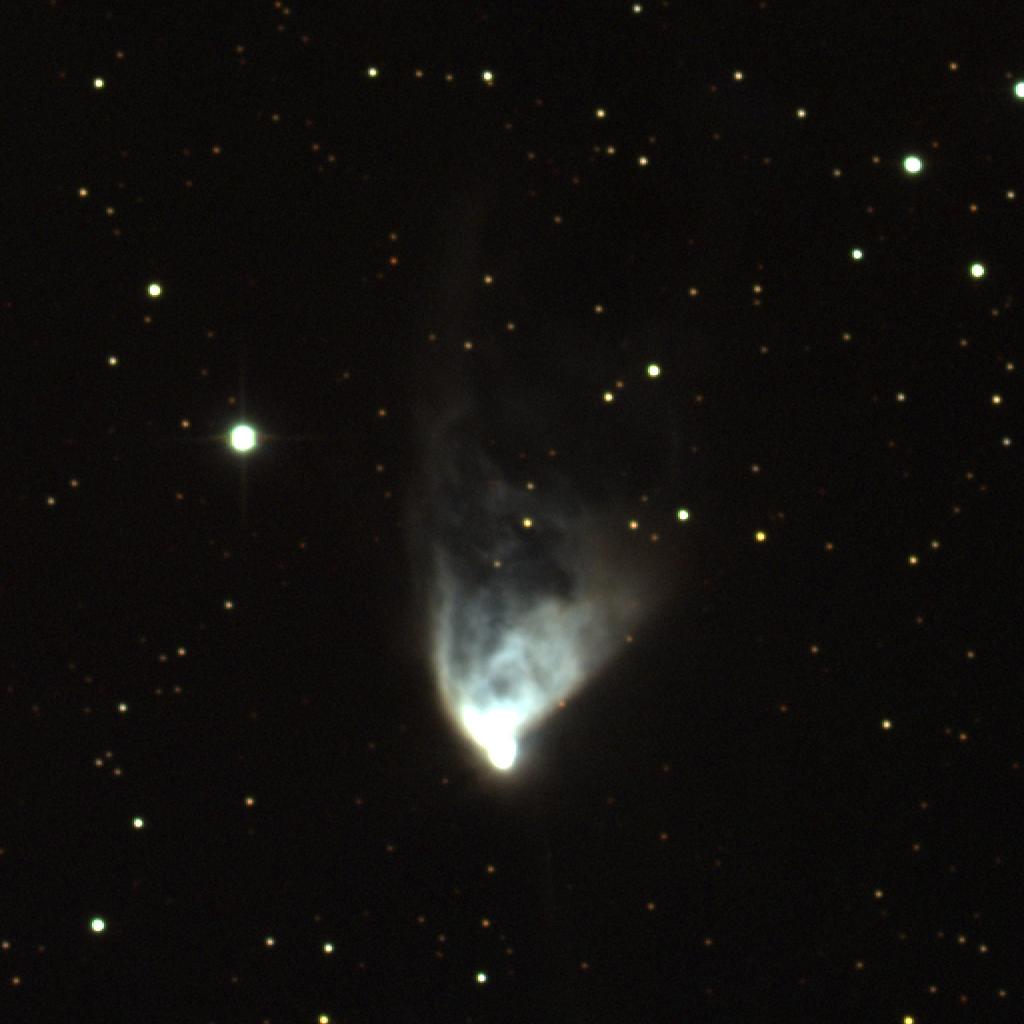
Saturn’s Rings Have an Atmosphere of their Own

Spectrum indicating atmosphere over rings. Image credit: NASA/JPL/SSI/SWRI/UCL Click to enlarge
Data from the NASA/ESA/ASI Cassini spacecraft indicate that Saturn’s majestic ring system has its own atmosphere – separate from that of the planet itself.

During its close fly-bys of the ring system, instruments on Cassini have been able to determine that the environment around the rings is like an atmosphere, composed principally of molecular oxygen.
This atmosphere is very similar to that of Jupiter’s moons Europa and Ganymede.

The finding was made by two instruments on Cassini, both of which have European involvement: the Ion and Neutral Mass Spectrometer (INMS) has co-investigators from USA and Germany, and the Cassini Plasma Spectrometer (CAPS) instrument has co-investigators from US, Finland, Hungary, France, Norway and UK.

Saturn’s rings consist largely of water ice mixed with smaller amounts of dust and rocky matter. They are extraordinarily thin: though they are 250 000 kilometres or more in diameter they are no more than 1.5 kilometres thick.

Despite their impressive appearance, there is very little material in the rings – if the rings were compressed into a single body it would be no more than 100 kilometres across.

The origin of the rings is unknown. Scientists once thought that the rings were formed at the same time as the planets, coalescing out of swirling clouds of interstellar gas 4000 million years ago. However, the rings now appear to be young, perhaps only hundreds of millions of years old.

Another theory suggests that a comet flew too close to Saturn and was broken up by tidal forces. Possibly one of Saturn’s moons was struck by an asteroid smashing it to pieces that now form the rings.

Though Saturn may have had rings since it formed, the ring system is not stable and must be regenerated by ongoing processes, probably the break-up of larger satellites.

Water molecules are first driven off the ring particles by solar ultraviolet light. They are then split into hydrogen, and molecular and atomic oxygen, by photodissocation. The hydrogen gas is lost to space, the atomic oxygen and any remaining water are frozen back into the ring material due to the low temperatures, and this leaves behind a concentration of oxygen molecules.

Dr Andrew Coates, co-investigator for CAPS, from the Mullard Space Science Laboratory (MSSL) at University College London, said: “As water comes off the rings, it is split by sunlight; the resulting hydrogen and atomic oxygen are then lost, leaving molecular oxygen.

“The INMS sees the neutral oxygen gas, CAPS sees molecular oxygen ions and an ?electron view? of the rings. These represent the ionised products of that oxygen and some additional electrons driven off the rings by sunlight.”

Dr Coates said the ring atmosphere was probably kept in check by gravitational forces and a balance between loss of material from the ring system and a re-supply of material from the ring particles.

Last month, Cassini-Huygens mission scientists celebrated the spacecraft’s first year in orbit around Saturn. Cassini performed its Saturn Orbit Insertion (SOI) on 1 July 2004 after its six-year journey to the ringed planet, travelling over three thousand million kilometres.

The Cassini-Huygens mission is a co-operative project of NASA, ESA and ASI, the Italian space agency.

Original Source: ESA Science

Predicting Times for Clear Space Weather

Biggest solar flare recorded by SOHO. Image credit: SOHO Click to enlarge
Scientists funded by NASA have made big strides in learning how to forecast “all clear” periods, when severe space weather is unlikely. The forecasts are important because radiation from particles from the sun associated with large solar flares can be hazardous to unprotected astronauts, airplane occupants and satellites.

“We have a much better insight into what causes the strongest, most dangerous solar flares, and how to develop forecasts that can predict an ‘all clear’ for significant space weather, for longer periods,” said Dr. Karel Schrijver of the Lockheed Martin Advanced Technology Center (ATC), Palo Alto, Calif. He is lead author of a paper about the research published in the Astrophysical Journal.

Solar flares are violent explosions in the atmosphere of the sun caused by the sudden release of magnetic energy. Like a rubber band twisted too tightly, stressed magnetic fields in the sun?s atmosphere (corona) can suddenly snap to a new shape. They can release as much energy as one, 10 billion megaton nuclear bomb.

Predicting space weather is a complicated problem. Solar forecasters focus principally on the complexity of solar magnetic field patterns to predict solar storms. This method is not always reliable, because solar storms require additional ingredients to occur. It has long been known large electrical currents must be present to power flares.

Insight into the causes of the largest solar flares came in two steps. “First, we discovered characteristic patterns of magnetic field evolution associated with strong electrical currents in the solar atmosphere,” said ATC’s Dr. Marc DeRosa, co-author of the paper. “It is these strong electrical currents that drive solar flares.”

Subsequently, the authors discovered the regions most likely to flare had new magnetic fields merge into them that were clearly out of alignment with the existing field. This emerging field from the solar interior appears to induce even more current as it interacts with the existing field.

The team also found flares do not necessarily occur immediately upon the emergence of a new magnetic field. Apparently the electrical currents must build up over several hours before the fireworks start. Predicting exactly when a flare will happen is like studying avalanches. They occur only after enough snow built up. Once the threshold is reached, the avalanche can happen anytime by processes not yet completely understood.

“We found the current-carrying regions flare two to three times more often than the regions without large currents,” Schrijver said. “Also, the average flare magnitude is three times greater for the group of active regions with large current systems than for the other group.”

The researchers made the discovery by comparing data about magnetic fields on the sun?s surface to the sharpest extreme-ultraviolet images of the solar corona. The magnetic maps were from the Michelson Doppler Imager (MDI) instrument on board Solar and Heliospheric Observatory (SOHO) spacecraft. SOHO is operated under a cooperative mission between the European Space Agency and NASA.

The corona images were from the NASA Transition Region and Coronal Explorer spacecraft (TRACE). The team also used computer models of a three-dimensional solar magnetic field without electrical currents based on SOHO images. Differences between images and models indicated the presence of large electrical currents.

“This is a result that is more than the sum of two individual missions,” said Dr. Dick Fisher, Director of NASA’s Sun-Solar System Connection Division. “It’s not only interesting scientifically, but has broad implications for society.”

For imagery about the research on the Web, visit: NASA News Release

Rhea’s Southern Pole

Southern polar region of Rhea. Image credit: NASA/JPL/SSI Click to enlarge
Like the rest of Rhea’s surface, the southern polar region of this Saturn moon has been extensively re-worked by cratering over the eons. This close-up shows that most sizeable craters have smaller, younger impact sites within them. Near the left lies an intriguing gash.
The largest well-defined crater visible here is an oval-shaped impact toward the upper right. The crater is 115 by 91 kilometers (71 by 57 miles) in size.

Cassini acquired this view during a distant flyby of Rhea (1,528 kilometers, or 949 miles across) on July 14, 2005.

The image was taken in visible light with the Cassini spacecraft narrow-angle camera at a distance of approximately 239,000 kilometers (149,000 miles) from Rhea and at a Sun-Rhea-spacecraft, or phase, angle of 56 degrees. The image was obtained using a filter sensitive to wavelengths of infrared light centered at 930 nanometers. The image scale is about 1 kilometer (0.6 miles) per pixel.

The Cassini-Huygens mission is a cooperative project of NASA, the European Space Agency and the Italian Space Agency. The Jet Propulsion Laboratory, a division of the California Institute of Technology in Pasadena, manages the mission for NASA’s Science Mission Directorate, Washington, D.C. The Cassini orbiter and its two onboard cameras were designed, developed and assembled at JPL. The imaging operations center is based at the Space Science Institute in Boulder, Colo.

For more information about the Cassini-Huygens mission visit http://saturn.jpl.nasa.gov . The Cassini imaging team homepage is at http://ciclops.org .

Original Source: NASA/JPL/SSI News Release

Sea Ice May Be Increasing in the Antarctic

Antarctic Snow Depth on Sea Ice. Image credit: NASA Click to enlarge
A new NASA-funded study finds that predicted increases in precipitation due to warmer air temperatures from greenhouse gas emissions may actually increase sea ice volume in the Antarctic?s Southern Ocean. This adds new evidence of potential asymmetry between the two poles, and may be an indication that climate change processes may have different impact on different areas of the globe.

“Most people have heard of climate change and how rising air temperatures are melting glaciers and sea ice in the Arctic,” said Dylan C. Powell, co-author of the paper and a doctoral candidate at the University of Maryland-Baltimore County. “However, findings from our simulations suggest a counterintuitive phenomenon. Some of the melt in the Arctic may be offset by increases in sea ice volume in the Antarctic.”

The researchers used satellite observations for the first time, specifically from the Special Sensor Microwave/Imager, to assess snow depth on sea ice, and included the satellite observations in their model. As a result, they improved prediction of precipitation rates. By incorporating satellite observations into this new method, the researchers achieved more stable and realistic precipitation data than the typically variable data found in the polar regions. The paper was published in the June issue of the American Geophysical Union’s Journal of Geophysical Research.

“On any given day, sea ice cover in the oceans of the polar regions is about the size of the U.S.,” said Thorsten Markus, co-author of the paper and a research scientist at NASA?s Goddard Space Flight Center, Greenbelt, Md. “Far-flung locations like the Arctic and Antarctic actually impact our temperature and climate where we live and work on a daily basis.”

According to Markus, the impact of the northernmost and southernmost parts on Earth on climate in other parts of the globe can be explained by thermal haline (or saline) circulation. Through this process, ocean circulation acts like a heat pump and determines our climate to a great extent. The deep and bottom water masses of the oceans make contact with the atmosphere only at high latitudes near or at the poles. In the polar regions, the water cools down and releases its salt upon freezing, a process that also makes the water heavier. The cooler, salty, water then sinks down and cycles back towards the equator. The water is then replaced by warmer water from low and moderate latitudes, and the process then begins again.

Typically, warming of the climate leads to increased melting rates of sea ice cover and increased precipitation rates. However, in the Southern Ocean, with increased precipitation rates and deeper snow, the additional load of snow becomes so heavy that it pushes the Antarctic sea ice below sea level. This results in even more and even thicker sea ice when the snow refreezes as more ice. Therefore, the paper indicates that some climate processes, like warmer air temperatures increasing the amount of sea ice, may go against what we would normally believe would occur.

“We used computer-generated simulations to get this research result. I hope that in the future we?ll be able to verify this result with real data through a long-term ice thickness measurement campaign,” said Powell. “Our goal as scientists is to collect hard data to verify what the computer model is telling us. It will be critical to know for certain whether average sea ice thickness is indeed increasing in the Antarctic as our model indicates, and to determine what environmental factors are spurring this apparent phenomenon.”

Achim Stossel of the Department of Oceanography at Texas A&M University, College Station, Tex., a third co-author on this paper, advises that “while numerical models have improved considerably over the last two decades, seemingly minor processes like the snow-to-ice conversion still need to be better incorporated in models as they can have a significant impact on the results and therefore on climate predictions.”

Original Source: NASA News Release

New Look for the Milky Way

Artist’s impression of the Milky Way. Image credit: NASA/JPL-Caltech/R Click to enlarge
With the help of NASA’s Spitzer Space Telescope, astronomers have conducted the most comprehensive structural analysis of our galaxy and have found tantalizing new evidence that the Milky Way is much different from your ordinary spiral galaxy.

The survey using the orbiting infrared telescope provides the fine details of a long central bar feature that distinguishes the Milky Way from more pedestrian spiral galaxies.

“This is the best evidence ever for this long central bar in our galaxy,” says Ed Churchwell, a UW-Madison professor of astronomy and a senior author of a paper describing the new work in an upcoming edition of Astrophysical Journal Letters, a leading astronomy journal.

Using the orbiting infrared telescope, the group of astronomers surveyed some 30 million stars in the plane of the galaxy in an effort to build a detailed portrait of the inner regions of the Milky Way. The task, according to Churchwell, is like trying to describe the boundaries of a forest from a vantage point deep within the woods: “This is hard to do from within the galaxy.”

Spitzer’s capabilities, however, helped the astronomers cut through obscuring clouds of interstellar dust to gather infrared starlight from tens of millions of stars at the center of the galaxy. The new survey gives the most detailed picture to date of the inner regions of the Milky Way.

“We’re observing at wavelengths where the galaxy is more transparent, and we’re bringing tens of millions of objects into the equation,” says Robert Benjamin, the lead author of the new study and a professor of physics at the University of Wisconsin-Whitewater.

The possibility that the Milky Way Galaxy has a long stellar bar through its center has long been considered by astronomers, and such phenomena are not unheard of in galactic taxonomy. They are clearly evident in other galaxies, and it is a structural characteristic that adds definition beyond the swirling arms of typical spiral galaxies.

The new study provides the best estimates for the size and orientation of the bar, which are far different from previous estimates.

It shows a bar, consisting of relatively old and red stars, spanning the center of the galaxy roughly 27,000 light years in length – 7,000 light years longer than previously believed. It also shows that the bar is oriented at about a 45-degree angle relative to a line joining the sun and the center of the galaxy.

Previously, astronomers debated whether a presumed central feature of the galaxy would be a bar structure or a central ellipse – or both. The new research, the Wisconsin astronomers say, clearly shows a bar-like structure.

“To date, this is the best evidence for a long bar in our galaxy,” Benjamin asserts. “It’s hard to argue with this data.”

The Spitzer Space Telescope was lofted into orbit in August of 2003. It consists of a telescope and three science instruments, including the Infrared Array Camera, the primary instrument used for the new survey, known as GLIMPSE for Galactic Legacy Mid-Plane Survey Extraordinaire.

NASA’s Jet Propulsion Laboratory (JPL), Pasadena, Calif., manages the Spitzer Space Telescope mission for NASA’s Science Mission Directorate, Washington, D.C. Science operations are conducted at the Spitzer Science Center in Pasadena. JPL is a division of the California Institute of Technology.

Original Source: UW-Madison News Release

Xanadu on Titan

Saturn’s largest moon Titan. Image credit: NASA/JPL/SSI Click to enlarge
Titan’s equatorial latitudes are distinctly different in character from its south polar region, as this image shows.
The dark terrain, presumably lowland, seen here does not extend much farther south than about 30 degrees South. The successful Huygens probe landed in such a region. The Huygens probe is rotating into the light here, seeing the dawn of a new day.

The bright region toward the right side of Titan’s disk is Xanadu. This area is thought to consist of upland terrain that is relatively uncontaminated by the dark material that fills the lowland regions.

Near the moon’s south pole, and just eastward of the terminator, is the dark feature identified by imaging scientists as the best candidate (so far) for a past or present hydrocarbon lake on Titan (see Clouds in the Distance). Farther east of the lake-like feature, bright clouds arc around the pole. These clouds occupy a latitude range that is consistent with previously-seen convective cloud activity on Titan.

Titan is Saturn’s largest moon, at 5,150 kilometers (3,200 miles) across.

The image was taken with the Cassini spacecraft narrow angle camera on July 7, 2005, at a distance of approximately 1.3 million kilometers (800,000 miles) from Titan and at a Sun-Titan-spacecraft, or phase, angle of 60 degrees. The image was obtained using a filter sensitive to wavelengths of infrared light centered at 938 nanometers. The image scale is 7 kilometers (5 miles) per pixel.

The Cassini-Huygens mission is a cooperative project of NASA, the European Space Agency and the Italian Space Agency. The Jet Propulsion Laboratory, a division of the California Institute of Technology in Pasadena, manages the mission for NASA’s Science Mission Directorate, Washington, D.C. The Cassini orbiter and its two onboard cameras were designed, developed and assembled at JPL. The imaging operations center is based at the Space Science Institute in Boulder, Colo.

For more information about the Cassini-Huygens mission visit http://saturn.jpl.nasa.gov . The Cassini imaging team homepage is at http://ciclops.org .

Original Source: NASA/JPL/SSI News Release

Mineral Mapper Traveling to Mars

CRISM. Image credit: NASA Click to enlarge
With today?s launch of NASA?s Mars Reconnaissance Orbiter spacecraft from Cape Canaveral Air Force Station, Fla., the Compact Reconnaissance Imaging Spectrometer for Mars ? or CRISM ? joins the set of high-tech detectives seeking traces of water on the red planet.

Built by the Johns Hopkins University Applied Physics Laboratory (APL) in Laurel, Md., CRISM is the first visible-infrared spectrometer to fly on a NASA Mars mission. Its primary job: look for the residue of minerals that form in the presence of water, the ?fingerprints? left by evaporated hot springs, thermal vents, lakes or ponds on Mars when water could have existed on the surface.

With unprecedented clarity, CRISM will map areas on the martian surface down to house-sized scales ? as small as 60 feet (about 18 meters) across ? when the spacecraft is in its average orbit altitude of about 190 miles (more than 300 kilometers).

?CRISM plays a very important role in Mars exploration,? says APL?s Dr. Scott Murchie, the instrument?s principal investigator. ?Our data will identify sites most likely to have contained water, and which would make the best potential landing sites for future missions seeking fossils or even traces of life on Mars.?

Though certain landforms provide evidence that water may once have flowed on Mars, Murchie says scientists have little evidence of sites containing mineral deposits created by long-term interaction between water and rock. The NASA Rover Opportunity found evidence for liquid water in Meridian Planum ? a large plain near Mars? equator ? but that is only one of many hundreds of sites where future spacecraft could land.

Peering through a telescope with a 4-inch (10-centimeter) aperture, and with a greater capability to map spectral variations than any similar instrument sent to another planet, CRISM will read 544 ?colors? in reflected sunlight to detect minerals in the surface. Its highest resolution is about 20 times sharper than any previous look at Mars in infrared wavelengths.

?At infrared wavelengths, rocks that look absolutely the same to human eyes become very different,? Murchie says. ?CRISM has the capability to take images in which different rocks will ?light up? in different colors.?

CRISM is mounted on a gimbal, allowing it to follow targets on the surface as the orbiter passes overhead. CRISM will spend the first half of a two-year orbit mission mapping Mars at 650-foot (200-meter) scales, searching for potential study areas. Several thousand promising sites will then be measured in detail at CRISM?s highest spatial and spectral resolution. CRISM will also monitor seasonal variations in dust and ice particles in the atmosphere, supplementing data gathered by the orbiter?s other instruments and providing new clues about the Martian climate.

?CRISM will improve significantly on the mapping technology currently orbiting Mars,? says CRISM Project Manager Peter Bedini, of APL. ?We?ll not only look for future landing sites, but we?ll be able to provide details on information the Mars Exploration Rovers are gathering now. There is a lot more to learn, and after CRISM and the Mars Reconnaissance Orbiter there will still be more to learn. But with this mission we?re taking a big step in exploring and understanding Mars.?

As the Mars Reconnaissance Orbiter cruises to its destination, the CRISM operations team continues to fine-tune the software and systems it will use to command the instrument and receive, read, process, and store a wealth of data from orbit ? more than 10 terabytes when processed back on Earth, enough to fill more than 15,000 compact discs. The spacecraft is set to reach Mars next March, use aerobraking to circularize its orbit, and settle into its science orbit by November 2006.

APL, which has built more than 150 spacecraft instruments over the past four decades, led the effort to develop, integrate and test CRISM. CRISM?s co-investigators are top planetary scientists from Brown University, the Jet Propulsion Laboratory, Northwestern University, Space Science Institute, Washington University in St. Louis, University of Paris, the Applied Coherent Technology Corporation, and NASA?s Goddard Space Flight Center, Ames Research Center and Johnson Space Center.

The Jet Propulsion Laboratory, a division of the California Institute of Technology, Pasadena, manages the Mars Reconnaissance Orbiter mission for NASA’s Science Mission Directorate.

For more information on CRISM and the Mars Reconnaissance Orbiter, including instrument images, visit: http://crism.jhuapl.edu

Original Source: APL News Release