Don’t Breathe the Moon Dust

This is a true story.

In 1972, Apollo astronaut Harrison Schmidt sniffed the air in his Lunar Module, the Challenger. “[It] smells like gunpowder in here,” he said. His commander Gene Cernan agreed. “Oh, it does, doesn’t it?”

The two astronauts had just returned from a long moonwalk around the Taurus-Littrow valley, near the Sea of Serenity. Dusty footprints marked their entry into the spaceship. That dust became airborne–and smelly.

Later, Schmidt felt congested and complained of “lunar dust hay fever.” His symptoms went away the next day; no harm done. He soon returned to Earth and the anecdote faded into history.

But Russell Kerschmann never forgot. He’s a pathologist at the NASA Ames Research Center studying the effects of mineral dust on human health. NASA is now planning to send people back to the Moon and on to Mars. Both are dusty worlds, extremely dusty. Inhaling that dust, says Kerschmann, could be bad for astronauts.

“The real problem is the lungs,” he explains. “In some ways, lunar dust resembles the silica dust on Earth that causes silicosis, a serious disease.” Silicosis, which used to be called “stone-grinder’s disease,” first came to widespread public attention during the Great Depression when hundreds of miners drilling the Hawk’s Nest Tunnel through Gauley Mountain in West Virginia died within half a decade of breathing fine quartz dust kicked into the air by dry drilling–even though they had been exposed for only a few months. “It was one of the biggest occupational-health disasters in U.S. history,” Kerschmann says.

This won’t necessarily happen to astronauts, he assures, but it’s a problem we need to be aware of–and to guard against.

Quartz, the main cause of silicosis, is not chemically poisonous: “You could eat it and not get sick,” he continues. “But when quartz is freshly ground into dust particles smaller than 10 microns (for comparison, a human hair is 50+ microns wide) and breathed into the lungs, they can embed themselves deeply into the tiny alveolar sacs and ducts where oxygen and carbon dioxide gases are exchanged.” There, the lungs cannot clear out the dust by mucous or coughing. Moreover, the immune system’s white blood cells commit suicide when they try to engulf the sharp-edged particles to carry them away in the bloodstream. In the acute form of silicosis, the lungs can fill with proteins from the blood, “and it’s as if the victim slowly suffocates” from a pneumonia-like condition.

Lunar dust, being a compound of silicon as is quartz, is (to our current knowledge) also not poisonous. But like the quartz dust in the Hawk’s Nest Tunnel, it is extremely fine and abrasive, almost like powdered glass. Astronauts on several Apollo missions found that it clung to everything and was almost impossible to remove; once tracked inside the Lunar Module, some of it easily became airborne, irritating lungs and eyes.

Martian dust could be even worse. It’s not only a mechanical irritant but also perhaps a chemical poison. Mars is red because its surface is largely composed of iron oxide (rust) and oxides of other minerals. Some scientists suspect that the dusty soil on Mars may be such a strong oxidizer that it burns any organic compound such as plastics, rubber or human skin as viciously as undiluted lye or laundry bleach.

“If you get Martian soil on your skin, it will leave burn marks,” believes University of Colorado engineering professor Stein Sture, who studies granular materials like Moon- and Mars-dirt for NASA. Because no soil samples have ever been returned from Mars, “we don’t know for sure how strong it is, but it could be pretty vicious.”

Moreover, according to data from the Pathfinder mission, Martian dust may also contain trace amounts of toxic metals, including arsenic and hexavalent chromium–a carcinogenic toxic waste featured in the docudrama movie Erin Brockovich (Universal Studios, 2000). That was a surprising finding of a 2002 National Research Council report called Safe on Mars: Precursor Measurements Necessary to Support Human Operations on the Martian Surface.

The dust challenge would be especially acute during windstorms that occasionally envelop Mars from poles to equator. Dust whips through the air, scouring every exposed surface and sifting into every crevice. There’s no place to hide.

To find ways of mitigating these hazards, NASA is soon to begin funding Project Dust, a four-year study headed by Masami Nakagawa, associate professor in the mining engineering department of the Colorado School of Mines. Project Dust will study such technologies as thin-film coatings that repel dust from tools and other surfaces, and electrostatic techniques for shaking or otherwise removing dust from spacesuits.

These technologies, so crucial on the Moon and Mars, might help on Earth, too, by protecting people from sharp-edged or toxic dust on our own planet. Examples include alkaline dust blown from dry lakes in North American deserts, wood dust from sawmills and logging operations, and, of course, abrasive quartz dust in mines.

The road to the stars is surprisingly dusty. But, says Kerschmann, “I strongly believe it’s a problem that can be controlled.”

Original Source: Science@NASA Story

Solar Wind Flows From Magnetic Funnels on the Sun

A Chinese-German team of scientists have identified the magnetic structures in the solar corona where the fast solar wind originates. Using images and Doppler maps from the Solar Ultraviolet Measurements of Emitted Radiation (SUMER) spectrometer and magnetograms delivered by the Michelson Doppler Imager (MDI) on the space-based Solar and Heliospheric Observatory (SOHO) of ESA and NASA, they observed solar wind flowing from funnel-shaped magnetic fields which are anchored in the lanes of the magnetic network near the surface of the Sun. These observations are presented in the April 22 issue of Science magazine. The research leads to a better understanding of the magnetic nature of the sources of the solar wind, a stream of tenuous and hot plasma (electrically conductive gas) that affects the Earth’s space environment.

The solar wind consists of protons, alpha particles (two-fold ionized helium), heavy ions and electrons flowing from the surface of the Sun with speeds ranging from 300 to 800 km/s. The heavy ions in the coronal source regions emit radiation at certain ultraviolet wavelengths. When they flow towards Earth, as they do when tracing the nascent solar wind, the wavelengths of the ultraviolet emission become shorter, a phenomenon called the Doppler effect, which is well known in its acoustic variant, for example, from the change in tone of the horn of a police car while approaching to or receding from the listener. In the solar case, plasma motion towards us, which means away from the solar surface, is detected as blue shift in the ultraviolet spectrum, and thus can be used to identify the beginning of the solar wind outflow.

A SUMER ultraviolet spectrum is similar to what is seen when a prism separates white light into a rainbow of distinct colors. The ultraviolet radiation is however invisible to the human eye and cannot penetrate the Earth’s atmosphere. By analyzing ultraviolet emission obtained by SUMER on the space observatory SOHO from space, solar physicists can learn a great deal about the Sun and infer the gas temperature, chemical composition, and motion in the various atmospheric layers.

“The fine magnetic structure of the source region of solar wind has remained elusive” said first author Prof. Chuanyi Tu, from the Department of Geophysics of the Peking University in Beijing, China. “For many years, solar and space physicists have observed fast solar wind streams coming from coronal regions with open magnetic field lines and low light intensity, the so called coronal holes. However, only by combining complex observations from SOHO in a novel way have we been able to infer the properties of the sources inside coronal holes. The fast solar wind seems to originate in coronal funnels with a speed of about 10 km/s at a height of 20,000 kilometers above the photosphere”.

“The fast solar wind starts to flow out from the top of funnels in coronal holes with a flow speed of about 10 km/s”, states Prof. Tu. “This outflow is seen as large patches in Doppler blue shift (hatched areas in the above figure) of a spectral line emitted by Ne+7 ions at a temperature of 600,000 Kelvin, which can be used as a good tracer for the hot plasma flow. Through a comparison with the magnetic field, as extrapolated from the photosphere by means of the MDI magnetic data, we found that the blue-shift pattern of this line correlates best with the open field structures at 20,000 km.”

The SUMER spectrometer scrutinized the sources of the solar wind by observing ultraviolet radiation coming from a large area of the northern polar region of the Sun. “The clear identification of the detailed magnetic structure of the source, now being revealed as coronal funnels, and the determination of the release height and initial speed of the solar wind are important steps in solving the problems of mass supply and basic acceleration. We can now focus our attention on studying further plasma conditions and physical processes that occur in the expanding coronal funnels and in their narrow necks anchored in the magnetic network”, says Prof. Eckart Marsch, co-author of the Science paper.

Solving the nature and origin of the solar wind is one of the main goals for which SOHO was designed. It has long been known to the astronomical community that the fast solar wind comes from coronal holes. What is new here is the discovery that these flows start in coronal funnels, which have their source located at the edges of the magnetic network. Just below the surface of the Sun there are large convection cells. Each cell has magnetic fields associated with it, which are concentrated in the network lanes by magneto-convection, where the funnel necks are anchored. The plasma, while still being confined in small loops, is brought by convection to the funnels and then released there, like a bucket of water is emptied into an open water channel.

“Previously it was believed that the fast solar wind originates on any given open field line in the ionization layer of the hydrogen atom slightly above the photosphere”, says Prof. Marsch, “However, the low Doppler shift of an emission line from carbon ions shows that bulk outflow has not yet occurred at a height of 5,000 km. The solar wind plasma is now considered to be supplied by plasma stemming from the many small magnetic loops, with only a few thousand kilometers in height, crowding the funnel. Through magnetic reconnection plasma is fed from all sides to the funnel, where it may be accelerated and finally form the solar wind.”

The SUMER instrument was built under the leadership of Dr. Klaus Wilhelm, who is also a co-author of the paper, at the Max Planck Institute for Solar System Research (formerly Max Planck Institute for Aeronomy) in Lindau, Germany, with key contributions from the Institut d’Astrophysique Spatiale in Orsay, France, the NASA Goddard Space Flight Center in Greenbelt, Maryland,the University of California in Berkeley, and with financial support from German, French, USA and Swiss national agencies. SOHO has been operating for almost ten years at a special vantage point in space 1.5 milion kilometers from the Earth, on the sunward side of the Earth. SOHO is a project of international collaboration between the European Space Agency and NASA. It was launched on an Atlas II-AS rocket from NASA’s Kennedy Space Center, Florida, in December 1995 and is operated from the Goddard Space Flight Center.

Original Source: Max Planck Society News Release

Nebula N214C

The nebula N214 [1] is a large region of gas and dust located in a remote part of our neighbouring galaxy, the Large Magellanic Cloud. N214 is a quite remarkable site where massive stars are forming. In particular, its main component, N214C (also named NGC 2103 or DEM 293), is of special interest since it hosts a very rare massive star, known as Sk-71 51 [2] and belonging to a peculiar class with only a dozen known members in the whole sky. N214C thus provides an excellent opportunity for studying the formation site of such stars.

Using ESO’s 3.5-m New Technology telescope (NTT) located at La Silla (Chile) and the SuSI2 and EMMI instruments, astronomers from France and the USA [3] studied in great depth this unusual region by taking the highest resolution images so far as well as a series of spectra of the most prominent objects present.

N214C is a complex of ionised hot gas, a so-called H II region [4], spreading over 170 by 125 light-years (see ESO PR Photo 12b/05). At the centre of the nebula lies Sk-71 51, the region’s brightest and hottest star. At a distance of ~12 light-years north of Sk-71 51 runs a long arc of highly compressed gas created by the strong stellar wind of the star. There are a dozen less bright stars scattered across the nebula and mainly around Sk-71 51. Moreover, several fine, filamentary structures and fine pillars are visible.

The green colour in the composite image, which covers the bulk of the N214C region, comes from doubly ionised oxygen atoms [5] and indicates that the nebula must be extremely hot over a very large extent.

The Star Sk-71 51 decomposed
The central and brightest object in ESO PR Photo 12b/05 is not a single star but a small, compact cluster of stars. In order to study this very tight cluster in great detail, the astronomers used sophisticated image-sharpening software to produce high-resolution images on which precise brightness and positional measurements could then be performed (see ESO PR Photo 12c/05). This so-called “deconvolution” technique makes it possible to visualize this complex system much better, leading to the conclusion that the tight core of the Sk-71 51 cluster, covering a ~ 4 arc seconds area, is made up of at least 6 components.

From additional spectra taken with EMMI (ESO Multi-Mode Instrument), the brightest component is found to belong to the rare class of very massive stars of spectral type O2 V((f*)). The astronomers derive a mass of ~80 solar masses for this object but it might well be that this is a multiple system, in which case, each component would be less massive.

Stellar populations
From the unique images obtained and reproduced as ESO PR Photo 12b/05, the astronomers could study in great depth the properties of the 2341 stars lying towards the N214C region. This was done by putting them in a so-called colour-magnitude diagram, where the abscissa is the colour (representative of the temperature of the object) and the ordinate the magnitude (related to the intrinsic brightness). Plotting the temperature of stars against their intrinsic brightness reveals a typical distribution that reflects their different evolutionary stages.

Two main stellar populations show up in this particular diagram (ESO PR Photo 12d/05): a main sequence, that is, stars that like the Sun are still centrally burning their hydrogen, and an evolved population. The main sequence is made up of stars with initial masses from roughly 2-4 to about 80 solar masses. The stars that follow the red line on ESO PR Photo 12d/05 are main sequence stars still very young, with an estimated age of about 1 million years only. The evolved population is mainly composed of much older and lower mass stars, having an age of 1,000 million years.

From their work, the astronomers classified several massive O and B stars, which are associated with the H II region and therefore contribute to its ionisation.

A Blob of Ionised Gas
A remarkable feature of N214C is the presence of a globular blob of hot and ionised gas at ~ 60 arc seconds (~ 50 light-years in projection) north of Sk-71 51. It appears as a sphere about four light-years across, split into two lobes by a dust lane which runs along an almost north-south direction (ESO PR Photo 12d/05). The blob seems to be placed on a ridge of ionised gas that follows the structure of the blob, implying a possible interaction.

The H II blob coincides with a strong infrared source, 05423-7120, which was detected with the IRAS satellite. The observations indicate the presence of a massive heat source, 200,000 times more luminous than the Sun. This is more probably due to an O7 V star of about 40 solar masses embedded in an infrared cluster. Alternatively, it might well be that the heating arises from a very massive star of about 100 solar masses still in the process of being formed.

“It is possible that the blob resulted from massive star formation following the collapse of a thin shell of neutral matter accumulated through the effect of strong irradiation and heating of the star Sk-71 51”, says Mohammad Heydari-Malayeri from the Observatoire de Paris (France) and member of the team.”Such a “sequential star formation” has probably occurred also toward the southern ridge of N214C”.

Newcomer to the Family
The compact H II region discovered in N214C may be a newcomer to the family of HEBs (“High Excitation Blobs”) in the Magellanic Clouds, the first member of which was detected in LMC N159 at ESO. In contrast to the typical H II regions of the Magellanic Clouds, which are extended structures spanning more than 150 light years and are powered by a large number of hot stars, HEBs are dense, small regions usually “only” 4 to 9 light-years wide. Moreover, they often form adjacent to or apparently inside the typical giant H II regions, and rarely in isolation.

“The formation mechanisms of these objects are not yet fully understood but it seems however sure that they represent the youngest massive stars of their OB associations”, explains Frederic Meynadier, another member of the team from the Observatoire de Paris. “So far only a half-dozen of them have been detected and studied using the ESO telescopes as well as the Hubble Space Telescope. But the stars responsible for the excitation of the tightest or youngest members of the family still remain to be detected.”

More information
The research made on N214C has been presented in a paper accepted for publication by the leading professional journal, Astronomy and Astrophysics (“The LMC H II Region N214C and its peculiar nebular blob”, by F. Meynadier, M. Heydari-Malayeri and Nolan R. Walborn). The full text is freely accessible as a PDF file from the A&A web site.

Notes
[1]: The letter “N” (for “Nebula”) in the designation of these objects indicates that they were included in the “Catalogue of H-alpha emission stars and nebulae in the Magellanic Clouds” compiled and published in 1956 by American astronomer-astronaut Karl Henize (1926 – 1993).

[2]: The name Sk-71 51, is the abbreviation of Sanduleak -71 51. The American astronomer Nicholas Sanduleak, while working at the Cerro Tololo Observatory, published in 1970 an important list of objects (stars and nebulae showing emission-lines in their spectra) in the Magellanic Clouds. The “-71” in the star’s name is the declination of the object, while the “51” is the entry number in the catalogue.

[3]: The team of astronomers consists of Frederic Meynadier and Mohammad Heydari-Malayeri (LERMA, Paris Observatory, France), and Nolan R. Walborn (Space Telescope Science Institute, USA).

[4]: A gas is said to be ionised when its atoms have lost one or more electrons – in this case by the action of energetic ultraviolet radiation emitted by very hot and luminous stars close by. The heated gas shines mostly in the light of ionized hydrogen (H) atoms, leading to an emission nebula. Such nebulae are referred to as “H II regions”. The well-known Orion Nebula is an outstanding example of that type of nebula, cf. ESO PR Photos 03a-c/01 and ESO PR Photo 20/04.

[5]: The hotter the central object of an emission nebula, the hotter and more excited will be the surrounding nebula. The word “excitation” refers to the degree of ionization of the nebular gas. The more energetic the impinging particles and radiation, the more electrons will be lost and higher is the degree of excitation. In N214C, the central cluster of stars is so hot that the oxygen atoms are twice ionized, i.e. they have lost two electrons.

Original Source: ESO News Release

Aureum Chaos Region on Mars

This image, taken by the High Resolution Stereo Camera (HRSC) on board ESA?s Mars Express spacecraft, shows the ‘chaotic’ terrain of the Aureum Chaos region on Mars.

The HRSC obtained this image during orbit 456 with a resolution of approximately 25 metres per pixel. The scene shows an area located at about 3? South and 335? East.

Aureum Chaos is located in the eastern part of Valles Marineris, south-west of the 280 kilometre-wide impact crater Aram Chaos. Like this impact basin, both regions are two examples of the chaotic terrain contained in this part of the Valles Marineris.

As the name ?chaos? suggests, this terrain is characterised by randomly oriented, large-scale mesas and knobs that are heavily eroded and dominate the area. As seen in the main colour image, these mesas range from a few kilometres to tens of kilometres wide.

In the north (right-hand side) of this image, a well-defined scarp extends in an east-west direction.

?Slump and collapse? blocks can be distinguished at the base of this scarp, as highlighted in this close-up perspective view.

Near the southern border (middle left-hand side) of the colour image, a roughly five kilometre-wide region of bright material is observed. This material appears to form distinct layers that may have been created by the evaporation of fluids or by hydrothermal activity (see lower right-hand corner of the perspective view below).

Another interesting region of bright material also extends north to south in the centre of the colour image and is also visible along the left side of this perspective view.

The history of Aureum Chaos is complex. It appears that this basin was filled with sediment and then experienced the formation of chaotic terrain. It is thought that this extremely rough terrain is caused by collapse of the surface due to the removal of subsurface ice, magma or water.

By supplying new image data for Aureum Chaos, the HRSC allows scientists to improve their understanding of Mars. In particular, the colour and stereo capability of the HRSC allows improved studies of the planet?s morphology (the evolution of rocks and landforms). By analysing reflected light at different wavelengths, we can determine minerals that make up the various geological features within the scene.

Data from the HRSC, coupled with information from the other instruments on ESA?s Mars Express and other missions, will provide new insights into the geological evolution of the Red Planet and also pave the way for future missions.

Original Source: ESA News Release

Shuttle Return Pushed Back a Week

Mission controllers have decided to give technicians an extra week to get the Space Shuttle Discovery ready for its return to flight. Originally schedule to lift off on May 15, Discovery is now tentatively set to return to orbit on May 22. One reason for the delay is to give technicians more time to test an extension to the Canadarm which will let astronauts examine the shuttle for damage while in orbit. Its launch window closes on June 3, and doesn’t open up again until mid-July when Atlantis is expected to launch.

Glimpse at the Envelope of a Young Star

Detailed new images of the starbirth nursery in the Omega Nebula (M17) have revealed a multi component structure in the envelope of dust and gas surrounding a very young star. The stellar newborn, called M17-SO1, has a flaring torus of gas and dust, and thin conical shells of material above and below the torus. Shigeyuki Sako from University of Tokyo and a team of astronomers from the National Astronomical Observatory of Japan, the Japan Aeorospace Exploration Agency, Ibaraki University, the Purple Mountain Observatory of the Chinese Academy of Sciences, and Chiba University obtained these images and analyzed them in infrared wavelengths in order to understand the mechanics of protoplanetary disk formation around young stars. Their work is described in a detailed article in the April 21, 2005 edition of Nature.

The research team wanted to find a young star located in front of a bright background nebula and use near-infrared observations to image the surrounding envelope in silhouette, in a way comparable to how dentists use X-rays to take images of teeth. Using the Infrared Camera and Spectrograph with Adaptive Optics on the Subaru telescope, the astronomers looked for candidates in and around the Omega Nebula, which lies about 5,000 light-years away in the constellation Sagittarius. They found a large butterfly-shaped near-infrared silhouette of an envelope about 150 times the size of our solar system surrounding a very young star. They made follow-up observations of the region using the Cooled Mid-Infrared Camera and Spectrograph on the Subaru telescope and the Nobeyama Millimeter Array at the Nobeyama Radio Observatory. By combining the results from the near-infrared, mid-infrared, and millimeter wave radio observations, the researchers determined that the M17-SO1 is a protostar about 2.5 to 8 times the mass of the Sun, and that the butterfly-like silhouette reveals an edge-on view of the envelope.

The near-infrared observations reveal the structure of the surrounding envelope with unprecedented levels of detail. In particular, observations using the 2.166 emission line of hydrogen (called the Brackett gamma (Br ?) line) show that the envelope has multiple components instead of one simple structure. Around the equator of the protostar, the torus of dust and gas increases in thickness farther way from the star. Thin cone-shaped shells of material extend away from both poles of the star.

The discovery of the multi-component structure puts new constraints on how an envelope feeds material to a protostellar disk forming within its boundaries. “It’s quite likely that our own solar system looked like M17-SO1 when it was beginning to form,” said Sako. “We hope to confirm the relevance of our discovery for understanding the mechanism of protoplanetary disk formation by using the Subaru telescope to take infrared images with high resolution and high sensitivity of many more young stars.?

Original Source: NOAJ News Release

Genesis Recovery Proceeding Well

Scientists have closely examined four Genesis spacecraft collectors, vital to the mission’s top science objective, and found them in excellent shape, despite the spacecraft’s hard landing last year.

Scientists at NASA’s Johnson Space Center (JSC) in Houston removed the four solar-wind collectors from an instrument called the concentrator. The concentrator targets collected solar-oxygen ions during the Genesis mission. Scientists will analyze them to measure solar-oxygen isotopic composition, the highest-priority measurement objective for Genesis. The data may hold clues to increase understanding about how the solar system formed.

“Taking these concentrator targets out of their flight holders and getting our first visual inspection of them is very important,” said Karen McNamara, Genesis curation recovery lead. “This step is critical to moving forward with the primary science Genesis was intended to achieve. All indications are the targets are in excellent condition. Now we will have the opportunity to show that quantitatively. The preliminary assessment of these materials is the first step to their allocation and measurement of the composition of the solar wind,” she said.

The targets were removed at JSC by a team from Los Alamos National Laboratory, Los Alamos, N.M., where the concentrator was designed and built.

“Finding these concentrator targets in excellent condition after the Genesis crash was a real miracle,” said Roger Wiens, principal investigator for the Los Alamos instruments. “It raised our spirits a huge amount the day after the impact. With the removal of the concentrator targets this week, we are getting closer to learning what these targets will tell us about the sun and our solar system,” he added.

The Los Alamos team was assisted by JSC curators and Quality Assurance personnel from NASA’s Jet Propulsion Laboratory in Pasadena, Calif. Curators at JSC will examine the targets and prepare a detailed report about their condition, so scientists can properly analyze the collectors. The targets will be imaged in detail and then stored under nitrogen in the Genesis clean room.

Genesis was launched Aug. 8, 2001, from Cape Canaveral Air Force Station, Fla., on a mission to collect solar wind particles. Sample collection began Dec. 5, 2001, and was completed April 1, 2004. After an extensive recovery effort, following its Sept. 8, 2004, impact at a Utah landing site, the first scientific samples from Genesis arrived at JSC Oct. 4, 2004.

Original Source: NASA News Release

Audio: Alpha, Still Constant After All These Years

Image credit: SDSS
Listen to the interview: Alpha, Still Constant After All These Years (3.3 MB)

Or subscribe to the Podcast: universetoday.com/audio.xml

Fraser Cain: Can you give me the primer on Alpha?

Jeffery Newman: So Alpha is one of the constants that describes the strength of a fundamental force; there are 4 fundamental forces: electromagnetism, the weak force, the strong force and gravity and Alpha basically determines the strength of the electromagnetic force compared to the other 4. As such, it’s a very basic part of the quantum theory of how these forces work and how they scale with energy (and) how they scale with time in the universe.

Fraser: What in the universe depends on it; how would the universe be different if Alpha was different?

Newman: Because Alpha determines how strong the electromagnetic force is; that’s the force that holds atoms together; that’s the force that causes things to interact with light, so if the force (Alpha) had different strength, atoms wouldn’t hold together, as well or they might hold together too strongly to allow chemical interactions. As well, if light and atoms didn’t interact very well, it would be very hard to see for instance, as we do. It is essential to our life. Because it’s so fundamental, it has ramifications all over the place that you wouldn’t even expect that can have affects on almost every interaction an atom undergoes or how an atom is structured.

Fraser: Where did the prediction come from that Alpha should remain constant since the Big Bang? Why was this even open to speculation?

Newman: It was generally expected that it was a universal constant of the universe. There were predictions in fact, that it was not just a constant, but a very simple constant that would be an integer; whatever 136 or whatever 137. For a while it was thought to be the value; not a 137.1, but a 137 even. That turned out to be numerology; it didn’t hold true, but it’s a value that comes out of nowhere, but is a fundamental part of the standard model of particle physics and all the other standard values of particle physics are things like the mass of an electron, the very basic thing. We would expect that there would be numbers that would describe the universe as a whole and if they describe the universe as a whole, they should describe they should describe it at any time or any place. Only in the last 20 or so years, when there have been unification theories, that predict many extra dimensions; there are theories that also predict that the constants of the universe as we perceive them are influenced by the presence of these extra dimensions and over time or over space, the values of these constants could actually change because of the extra degrees of freedom provided by these dimensions. Dark energy theories today also can predict changes in Alpha over time.

Fraser: Now I had reported a week before your story had come out that some Australian researchers had found that Alpha had been changing which I guess was a pretty big announcement. Do you know what research they had done to determine that it had changed?

Newman: So they’re using ? again an astrophysical method; trying to look at observations of very distant objects, deep in the past; in the distant universe, and tried to use those observations to look at quantities that should depend on Alpha; in their case, they’re looking at the wavelengths of light that are absorbed by gasses between us and quasars that are very bright objects, very far away. They have a method that tried to use many different kinds of elements counterbalancing each other trying to get as much sensitivity to Alpha as possible, but because it’s a complicated method, it requires a lot of complicated calculations. It’s certainly a more complicated method than the one we’ve tried. We’ve tried to keep things simple. So there are actually some groups who have used the same method and some of them have found changes in Alpha and some of them have found no change in Alpha with the method the Australian group is using.

Fraser: What was the method that you had used?

Newman: We are looking, not at quasars, not at the very brightest objects, but rather at galaxies which are more abundant. So we can look at greater numbers of objects. And it turns out that we are looking at a particular simple set of measurements, set of wavelengths; transitions in atoms that we can use to measure Alpha. It depends in a very straightforward way on the value of Alpha over time, so by making a pretty simple measurement, we were able to set a constraint on how Alpha could evolve without having to worry about lots of atomic physics and nuclear physics, but just the simplest thing we can do. Alpha is called the Fine Structure Constant, and we were actually measuring the strength of a Fine Structure transition in oxygen atoms.

Fraser: How precise is the calculations that you’re coming up with?

Newman: The precision is mostly limited by the just the number of objects we have in the DEEPTWO Redshift Survey; the dataset we’ve used to do this. Now, out of 50,000 objects in the survey, we have about 500 we can use for this test. That gives us a precision of about a part in 30,000 on the value of Alpha.

Fraser: Because I recall the Australians, it (Alpha) had changed in 1 in 100,000 or something like that?

Newman: Yes, so we can’t yet rule out their measurement. It’s modestly discrepant at this point. No scientist would look at these values and say one rules out the other because their nominal precision is high. The question is could there be something systematically wrong with the measurement; could there be something that goes wrong with that technique? Given that different groups have gotten different values it’s likely that something is wrong with one of the groups or the other; either the group that defines a change in Alpha or the group that doesn’t. We can’t yet rule that out, but with a larger sample, using our simple method, we can make a determination.

Fraser: What would it take then for you to be able to come to a conclusive answer that both you; the changers and the static people come to an agreement?

Newman: I think that more data coming from us would certainly help because currently we are able to show that we are not limited by any sort of systematic error or systematic uncertainty in what we’re doing. We are limited just by random errors and random errors, you can make better if you have a larger sample. The other techniques, the other groups are also trying to get more data to reduce their errors and to try to do measurements of a couple of different types to see if they can get consistent answers, not just with this more complex version of the method of looking at quasars, but now they are taking a step back and trying to use a slightly simpler method of that as well. So, hopefully these will converge and try to come to a common answer once their data sets come in.

Fraser: Right. Let’s say that you are wrong and it (Alpha) has been changing over time, what could that mean for the future of the universe? If it keeps going.

Newman: So the changes that are found are relatively slow; even the groups that do find significant changes and the changes that are found would be expected to get slower and slower as time goes on. Most predictions are that if Alpha does change, that it’s mostly changing in the first seconds of the universe. It just gets slower and slower and slower after that. So a secondary effect in the end, if it’s very slowly changing, the stars will burn out before it changes enough to affect the chemistry and interactions of atoms.

Penumbral Lunar Eclipse, April 24

Image credit: NASA
NASA is planning to send people back to the Moon. Target date: 2015 or so. Too bad they won’t be there this Sunday because, on April 24th, there’s going to be a solar eclipse, and you can only see it from the Moon.

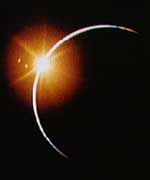
On Earth, solar eclipses happen when the Moon covers the Sun. On the Moon, the roles are reversed. It’s Earth that covers the Sun. Such an eclipse is “a marvelous sight,” according to Apollo 12 astronaut Alan Bean, who saw one in 1969. He was flying home from the Moon along with crewmates Pete Conrad and Dick Gordon when their spaceship flew through Earth’s shadow. “Our home planet [eclipsed] our own star.”

No one will see the April 24th eclipse, but we can imagine what it would be like:

You’re standing on the Moon. It’s broad daylight, almost high noon. The Sun is creeping slowly across the sky. How slowly? A lunar day is about 29.5 Earth-days long. So the Sun moves 29.5 times slower than our Earth-sense tells us it should. At that leisurely pace, the Sun approaches a dark but faintly-glowing disk three times its own size.

The disk is Earth with its nightside facing the Moon. You can see moonlit clouds floating over Earth’s dark oceans and continents. You can also see a faintly glowing ring of light around the planet–that’s Earth’s atmosphere with sunlight trickling through it. A telescope would show you Earth’s city lights, too. Beautiful.

Then the eclipse begins.

Looking through dark-filtered glasses, you watch the Sun slip behind Earth. Earth’s atmosphere, lit from behind, glows red, then redder, a ring of fire the color of sunset, interrupted here and there by the tops of the highest clouds.

Ninety minutes later–patience is required!–only a little bit of the Sun remains poking out over the edge of the planet. Arranged just so, the pair remind you of a giant sparkling diamond ring.

The Sun never completely vanishes because this eclipse is partial, not total. During a total eclipse, Earth would hide the Sun completely, which has the odd effect of turning the Moon blood red. But that’s another story.

Partial eclipses, while not as eerie or dramatic as total eclipses, are still good. In fact, future space tourists will probably rocket to the Moon to see them. It’ll be an exclusive club, people who’ve witnessed Earth taking a bite out of the Sun. The membership in 2005 is only two: Alan Bean and Dick Gordon, the surviving crew of Apollo 12.

Stuck on Earth, what can you do? As a matter of fact, it is possible to observe this Sunday’s solar eclipse from Earth in a roundabout way:

During the eclipse, Earth’s shadow will fall across the Moon and we can see that happen. Our planet’s shadow has two parts, a dark inner core called the umbra and a pale outer fringe called the penumbra. (Aside: Step outside on a sunny day and look at your own shadow. It’s dark in the middle and pale-fuzzy around the edges. You have your own umbra and penumbra.) The Moon on April 24th will glide through Earth’s penumbra, producing what astronomers call a “penumbral lunar eclipse.”

Penumbral eclipses are not easy to see because the penumbra is so pale. If you’re enthusiastic about such things, however, it’s worth a look. A subtle but distinct shading should be visible across northern parts of the Moon during greatest eclipse around 09:55 UT on Sunday morning, April 24th. That’s 02:55 a.m. PDT or 05:55 a.m. EDT in North America. The best place to be is the Hawaiian Islands where the eclipse happens only 5 minutes before local midnight on Saturday, April 23rd. The Moon will be high in the sky, ideally placed.

Even in Hawaii the experience is subtle. Not impressed? You’re just on the wrong world.

Original Source: Science@NASA

Solar Nebula Lasted 2 Million Years

Image credit: William K. Hartmann/PSI
The oxygen and magnesium content of some of the oldest objects in the universe are giving clues to the lifetime of the solar nebula, the mass of dust and gas that eventually led to the formation of our solar system.
Specimen from the Allende Meteorite

By looking at the content of chondrules and calcium aluminum-rich inclusions (CAIs), both components of the primitive meteorite Allende, Lab physicist Ian Hutcheon, with colleagues from the University of Hawaii at Manoa, the Tokyo Institute of Technology and the Smithsonian Institution, found that the age difference between the two fragments points directly to the lifetime of the solar nebula.

CAIs were formed in an oxygen-rich environment and date to 4.567 billion years old, while chondrules were formed in an oxygen setting much like that on Earth and date to 4.565 billion, or less, years old.

?Over this span of about two million years, the oxygen in the solar nebula changed substantially in its isotopic makeup,? Hutcheon said. ?This is telling us that oxygen was evolving fairly rapidly.?

The research appears in the April 21 edition of the journal Nature.

One of the signatures of CAIs is an enrichment of the isotope Oxygen 16 (O-16). An isotope is a variation of an element that is heavier or lighter than the standard form of the element because each atom has more or fewer neutrons in its nucleus. The CAIs in this study are enriched with an amount of O-16 4 percent more than that found on Earth. And, while 4 percent may not sound like much, this O-16 enrichment is an indelible signature of the oldest solar system objects, like CAIs. CAIs and chondrules are tens of millions of years older than more modern objects in the solar system, such as planets, which formed about 4.5 billion years ago.

?By the time chondrules formed, the O-16 content changed to resemble what we have on Earth today,? Hutcheon said.

In the past, the estimated lifetime of the solar nebula ranged from less than a million years to ten million years. However, through analysis of the mineral composition and oxygen and magnesium isotope content of CAIs and chondrules, the team was able to refine that lifespan to roughly two million years.

?In the past the age difference between CAIs and chondrules was not well-defined,? Hutcheon said. ?Refining the lifetime of the solar nebula is quite significant in terms of understanding how our solar system formed.?

Founded in 1952, Lawrence Livermore National Laboratory has a mission to ensure national security and apply science and technology to the important issues of our time. Lawrence Livermore National Laboratory is managed by the University of California for the U.S. Department of Energy’s National Nuclear Security Administration.

Original Source: LLNL News Release