Coprates Chasma on Mars

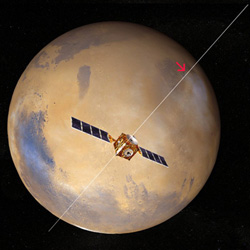
Perspective view of Coprates Chasma and Catena. Image credit: ESA. Click to enlarge.
This image, taken by the High Resolution Stereo Camera (HRSC) on board ESA?s Mars Express spacecraft, shows Coprates Chasma, a major trough in the Valles Marineris canyon system.

The HRSC obtained this image during orbit 449 with a ground resolution of approximately 48 metres per pixel.

The scene shows the region containing the sections of Coprates Chasma and Coprates Catena, over an area centred at about 13.5? South and 300? East, roughly in the centre of the Valles Marineris canyon system.

The trough of Coprates Chasma appears in the north, and ranges from approximately 60 km to 100 km wide and extends 8-9 km below the surrounding plains.

Coprates Catena lies parallel to Coprates Chasma and can be seen in the south as three troughs, ranging from a few kilometres to 22 km wide and up to 5 km deep. These troughs have been modified by erosion, as indicated by the linear features extending from the upper edge of the trough walls.

In contrast to the relatively sharp appearance of the upper regions of the trough walls, the lower slopes and the floors of the troughs have a softer appearance, which is probably the result of atmospheric dust.

Linear features, prevalent throughout the image and running generally parallel to the major troughs, may be faults.

Scientists are unsure of the mechanism responsible for the creation of the Valles Marineris canyon system. Some suggest that the formation of the Tharsis uplift, located west of the canyon system, caused tension and fracturing of the Martian crust.

Other researchers believe that water may have removed rock material from the subsurface, which caused the surface to collapse. A related theory suggests that large quantities of subsurface ice melted, causing surface collapse. Possibly all of these processes together were active in forming the structure.

Valles Marineris provides scientists with a window into the depths of Mars and enables them to study the complex geological and climatic history of the Red Planet.

By supplying new data for Valles Marineris, including colour and stereo images, the Mars Express HRSC camera aids scientists in this endeavour, ultimately improving our understanding of this fascinating planet.

Original Source: ESA News Release

Capturing the Fastest Events in the Universe

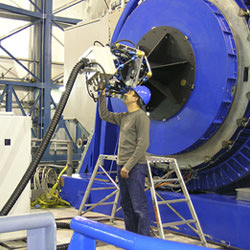
ULTRACAM instrument mounted on the Very Large Telescope. Image credit: ESO. Click to enlarge.
British scientists have opened a new window on the Universe with the recent commissioning of the Visitor Instrument ULTRACAM on the European Southern Observatory’s (ESO) Very Large Telescope (VLT) in Chile.

ULTRACAM is an ultra fast camera capable of capturing some of the most rapid astronomical events. It can take up to 500 pictures a second in three different colours simultaneously. It has been designed and built by scientists from the Universities of Sheffield and Warwick (United Kingdom), in collaboration with the UK Astronomy Technology Centre in Edinburgh.

ULTRACAM employs the latest in charged coupled device (CCD) detector technology in order to take, store and analyse data at the required sensitivities and speeds. CCD detectors can be found in digital cameras and camcorders, but the devices used in ULTRACAM are special because they are larger, faster and most importantly, much more sensitive to light than the detectors used in today’s consumer electronics products.

In May 2002, the instrument saw “first light” on the 4.2-m William Herschel Telescope (WHT) on La Palma. Since then the instrument has been awarded a total of 75 nights of time on the WHT to study any object in the Universe which eclipses, transits, occults, flickers, flares, pulsates, oscillates, outbursts or explodes.

These observations have produced a bonanza of new and exciting results, leading to already 11 scientific publications published or in press.

To study the very faintest stars at the very highest speeds, however, it is necessary to use the largest telescopes. Thus, work began 2 years ago preparing ULTRACAM for use on the VLT.

“Astronomers using the VLT now have an instrument specifically designed for the study of high-speed phenomena”, said Vik Dhillon, from the University of Sheffield (UK) and the ULTRACAM project scientist. “Using ULTRACAM in conjunction with the current generation of large telescopes makes it now possible to study high-speed celestial phenomena such as eclipses, oscillations and occultations in stars which are millions of times too faint to see with the unaided eye.”

Observing Black Holes
The instrument saw first light on the VLT on May 4, 2005, and was then used for 17 consecutive nights on the telescope to study extrasolar planets, black-hole binary systems, pulsars, white dwarfs, asteroseismology, cataclysmic variables, brown dwarfs, gamma-ray bursts, active-galactic nuclei and Kuiper-belt objects.

One of the faint objects studied with ULTRACAM on the VLT is GU Muscae. This object consists of a black hole in a 10-hour orbit with a normal, solar-like star. The black hole is surrounded by a disc of material transferred from the normal star. As this material falls onto the black hole, energy is released, producing large-amplitude flares visible in the light curve. This object has magnitude 21.4, that is, it is one million times fainter than what can be seen with the unaided eye. Yet, to study it in detail and detect the shortest possible pulses, it is necessary to use exposure times as short as 5 seconds. This is possible with the large aperture and great efficiency of the VLT.

These unique observations have revealed a series of sharp spikes, separated by approximately 7 minutes. Such a stable signal must be tied to a relatively stable structure in the disc of matter surrounding the black hole. The astronomers are now in the process of analysing these results in great details in order to understand the origin of this structure.

Another series of observations were dedicated to the study of extrasolar planets, more particularly those that transit in front of their host star. ULTRACAM observations have allowed the astronomers to obtain simultaneous light curves, in several colour-bands, of four known transiting exoplanets discovered by the OGLE survey, and this with a precision of a tenth of a percent and with a 4 second time resolution. This is a factor ten better than previous measurements and will provide very accurate masses and radii for these so-called “hot-Jupiters”. Because ULTRACAM makes observations in three different wavebands, such observations will also allow astronomers to establish whether the radius of the exoplanet is different at different wavelengths. This could provide crucial information on the possible exoplanets’ atmosphere.

The camera is the first instrument to make use of the Visitor Focus on Melipal (UT3), and the first UK-built instrument to be mounted at the VLT. The Visitor Focus allows innovative technologies and instrumentation to be added to the telescope for short periods of time, permitting studies to take place that are not available with the current suite of instruments.

“These few nights with ULTRACAM on the VLT have demonstrated the unique discoveries that can be made by combining an innovative technology with one of the best astronomical facilities in the world,” said Tom Marsh of the University of Warwick and member of the team. “We hope that ULTRACAM will now become a regular visitor at the VLT, giving European astronomers access to a unique new tool with which to study the Universe.”

More information
The ULTRACAM team is composed of Vik Dhillon, Stuart Littlefair, and Paul Kerry (Sheffield, UK), Tom Marsh (Warwick, UK), Andy Vick and Dave Atkinson (UKATC, Edinburgh, UK). For the installation on the VLT, they received support from Kieran O’Brien and Pascal Robert (ESO, Chile). The ULTRACAM project page can be found at http://www.shef.ac.uk/~phys/people/vdhillon/ultracam.

Original Source: ESO News Release

First Aurora Seen on Mars

Terra Cimmeria region of Mars where the aurora was detected. Image credit: ESA. Click to enlarge.
ESA?s Mars Express spacecraft has for the first time ever detected an aurora on Mars. This aurora is of a type never previously observed in the Solar System.

Observations by the SPICAM instrument (SPectroscopy for the Investigations and the Characteristics of the Atmosphere on Mars) taken on 11 August 2004, revealed light emissions now interpreted as an aurora.

Aurorae are spectacular displays often seen at the highest latitudes on Earth. On our planet, as well as on the giant planets Jupiter, Saturn, Uranus and Neptune, they lie at the foot of the planetary magnetic field lines near the Poles, and are produced by charged particles ? electrons, protons or ions ? precipitating along these lines.

Aurorae have also been observed on the night side of Venus, a planet with no intrinsic (planetary) magnetic field. Unlike Earth and the giant planets, venusian aurorae appear as bright and diffuse patches of varying shape and intensity, sometimes distributed across the full planetary disc. Venusian aurorae are produced by the impact of electrons originating from the solar wind and precipitating in the night-side atmosphere.

Like Venus, Mars is a planet with no intrinsic magnetic field. A few years ago it was suggested that auroral phenomena could exist on Mars too. This hypothesis was reinforced by the recent Mars Global Surveyor discovery of crustal magnetic anomalies, most likely the remnants of an old planetary magnetic field.

SPICAM detected light emissions in the Southern hemisphere on Mars, during night time observations. The total size of the emission region is about 30 kilometres across, possibly about 8 kilometres high. Whilst the detected emission is typical for day-time, it must indicate the excitation of the upper atmosphere by fluxes of charged particles ? probably electrons ? if observed during night-time.

By analysing the map of crustal magnetic anomalies compiled with Mars Global Surveyor?s data, scientists observed that the region of the emissions corresponds to the area where the strongest magnetic field is localised. This correlation indicates that the origin of the light emission actually is a flux of electrons moving along the crust magnetic lines and exciting the upper atmosphere of Mars.

SPICAM observations provide for the first time a key insight into the role of the martian crustal magnetic field in producing original cusp-like magnetic structures. Such structures concentrate fluxes of electrons into small regions of the martian atmosphere. Eventually, they induce the formation of highly concentrated aurorae whose formation mechanism ? a localised emission controlled by anomalies in the crust?s magnetic field ? is unique in the Solar System.

Original Source: ESA News Release

Possible Methane Volcano Discovered on Titan

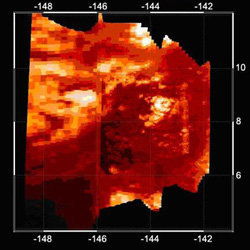
Infrared image of Titan taken by Cassini during its Oct. 26, 2004 flyby. Image credit: NASA/JPL/SSI. Click to enlarge.
A recent flyby of Saturn’s hazy moon Titan by the Cassini spacecraft has revealed evidence of a possible volcano, which could be a source of methane in Titan’s atmosphere.

Images taken in infrared light show a circular feature roughly 30 kilometers (19 miles) in diameter that does not resemble any features seen on Saturn’s other icy moons. Scientists interpret the feature as an “ice volcano,” a dome formed by upwelling icy plumes that release methane into Titan’s atmosphere. The findings appear in the June 9 issue of Nature.

“Before Cassini-Huygens, the most widely accepted explanation for the presence of methane in Titan’s atmosphere was the presence of a methane-rich hydrocarbon ocean,” said Dr. Christophe Sotin, distinguished visiting scientist at NASA’s Jet Propulsion Laboratory, Pasadena, Calif.

“The suite of instruments onboard Cassini and the observations at the Huygens landing site reveal that a global ocean is not present,” said Sotin, a team member of the Cassini visual and infrared mapping spectrometer instrument and professor at the Universit? de Nantes, France.

“Interpreting this feature as a cryovolcano provides an alternative explanation for the presence of methane in Titan’s atmosphere. Such an interpretation is supported by models of Titan’s evolution,” Sotin said.

Titan, Saturn’s largest moon, is the only known moon to have a significant atmosphere, composed primarily of nitrogen, with 2 to 3 percent methane. One goal of the Cassini mission is to find an explanation for what is replenishing and maintaining this atmosphere. This dense atmosphere makes the surface very difficult to study with visible-light cameras, but infrared instruments like the visual and infrared mapping spectrometer can peer through the haze. Infrared images provide information about both the composition and the shape of the area studied.

The highest resolution image obtained by the visual and infrared mapping spectrometer instrument covers an area 150 kilometers square (90 miles) that includes a bright circular feature about 30 kilometers (19 miles) in diameter, with two elongated wings extending westward. This structure resembles volcanoes on Earth and Venus, with overlapping layers of material from a series of flows. “We all thought volcanoes had to exist on Titan, and now we’ve found the most convincing evidence to date. This is exactly what we’ve been looking for,” said Dr. Bonnie Buratti, team member of the Cassini visual and infrared mapping spectrometer at JPL.

In the center of the area, scientists clearly see a dark feature that resembles a caldera, a bowl-shaped structure formed above chambers of molten material. The material erupting from the volcano might be a methane-water ice mixture combined with other ices and hydrocarbons. Energy from an internal heat source may cause these materials to upwell and vaporize as they reach the surface. Future Titan flybys will help determine whether tidal forces can generate enough heat to drive the volcano, or whether some other energy source must be present. Black channels seen by the European Space Agency’s Huygens probe, which piggybacked on Cassini and landed on Titan’s surface in January 2005, could have been formed by erosion from liquid methane rains following the eruptions.

Scientists have considered other explanations. They say the feature cannot be a cloud because it does not appear to move and it is the wrong composition. Another alternative is that an accumulation of solid particles was transported by gas or liquid, similar to sand dunes on Earth. But the shape and wind patterns don’t match those normally seen in sand dunes.

The data for these findings are from Cassini’s first targeted flyby of Titan on Oct. 26, 2004, at a distance of 1,200 kilometers (750 miles) from the moon’s surface.

The visual and infrared mapping spectrometer instrument can detect 352 wavelengths of light from 0.35 to 5.1 micrometers. It measures the intensities of individual wavelengths and uses the data to infer the composition and other properties of the object that emitted the light; each chemical has a unique spectral signature that can be identified.

Forty-five flybys of Titan are planned during Cassini’s four-year prime mission. The next one is Aug. 22, 2005. Radar data of the same sites observed by the visual and infrared mapping spectrometer may provide additional information.

For more information about the Cassini-Huygens mission visit http://saturn.jpl.nasa.gov and http://www.nasa.gov/cassini . The visual and infrared mapping spectrometer page is at http://wwwvims.lpl.arizona.edu .

The Cassini-Huygens mission is a cooperative project of NASA, the European Space Agency and the Italian Space Agency. The Jet Propulsion Laboratory, a division of the California Institute of Technology in Pasadena, manages the mission for NASA’s Science Mission Directorate, Washington, D.C. The Cassini orbiter was designed, developed and assembled at JPL. The visual and infrared mapping spectrometer team is based at the University of Arizona.

Original Source: NASA/JPL/SSI News Release

SMART-1 Finds Calcium on the Moon

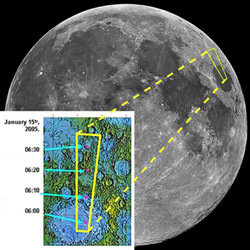
SMART-1’s detection of calcium, iron and other elements on the Moon. Image credit: ESA. Click to enlarge.
Thanks to measurements by the D-CIXS X-ray spectrometer, ESA?s SMART-1 spacecraft has made the first ever unambiguous remote-sensing detection of calcium on the Moon.

SMART-1 is currently performing the verification and calibration of its instruments, while it runs along its science orbit, reaching 450 kilometres from the Moon at its closest distance. During this calibration phase, which precedes the actual science observations phase, the SMART-1 scientists are getting acquainted with the delicate operations and the performance of their instruments in the warm environment of the lunar orbit.

Although it is still preparing for full lunar operations, D-CIXS has started already sending back high-quality data. D-CIXS is designed to measure the global composition of the Moon by observing how it glows in X-rays when the Sun shines on it. In fact, different chemical elements provide their ‘fingerprinting’, each glowing in a unique way.

On 15 January 2005, between 07:00 and about 09:00 Central European Time, a solar flare occurred, blasting a quantity of radiation that flooded the Solar System and the Moon. “The Sun was kind to us”, said Prof Manuel Grande of the Rutherford Appleton Laboratory, leader of the D-CIXS instrument team. “It set off a large X-ray flare just as we took our first look downwards at the lunar surface”.

The lunar surface reacts to the incoming solar radiation by glowing in different X-ray wavelengths. This enabled D-CIXS, , to distinguish the presence of chemical elements – including calcium, aluminium, silicon and iron – in Mare Crisium, the area of the lunar surface being observed at that moment. “It is the first time ever that calcium has been unambiguously detected on the Moon by remote-sensing instrumentation”, added Prof. Grande. Calcium is an important rock-forming element on the Moon.

“Even before our scientists have finished setting up the instruments, SMART-1 is already producing brand new lunar science”, said Bernard Foing, SMART-1 Project Scientist. “When we get D-CIXS and the other instruments fully tuned, with scientific data rolling in routinely, we should have a truly ground-breaking mission”.

Original Source: ESA News Release

The Search for Positronium

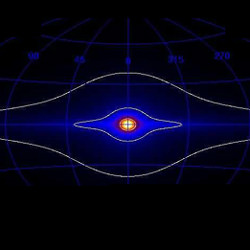
All-sky map of the best fitting ‘halo+disk’ model of 511 keV gamma-ray line emission. Image credit: INTEGRAL. Click to enlarge.
The positron, the anti-matter counterpart to the electron, was predicted by Paul Dirac’s – at the time revolutionary – quantum wave equation for the electron. A few years later, in 1932, Carl Anderson discovered the positron in cosmic rays, and Dirac got the Nobel Prize in 1933 and Anderson in 1936.

When a positron meets an electron, they annihilate, producing two gamma rays. Sometimes however, the annihilation is preceded by the formation of positronium, which is like a hydrogen atom with the proton replaced by a positron (positronium has its own symbol, Ps). Positronium comes in two forms, is unstable, and decays into either two gammas (within about 0.1 nanoseconds) or three (within about 100 nanoseconds).

Astronomers have known since the 1970s that there must be a lot of positrons in the universe. Why? Because when a positron and electron annihilate to give two gammas, both have the same wavelength, about 0.024 Å, or 0.0024 nm (astronomers, like particle physicists, don’t talk about the wavelengths of gamma rays, they talk about their energy; 511 keV in this case). So, if you look at the sky with gamma-ray vision – from above the atmosphere of course! – you know there was lots of positrons because you can see lots of gammas of a single ‘colour’, 511 keV (it’s similar to concluding there’s lots of hydrogen in the universe by noticing lots of the red (1.9 eV) H alpha in the night sky).

From the spectrum of the three-gamma decay of positronium, compared with the 511 keV line intensity, astronomers four years ago worked out that about 93% of positrons whose annihilation we see form positronium before they decay.

How much positronium? In the Milky Way bulge, about 15 billion (thousand million) tons of positrons are annihilated every second. That’s as much mass as the electrons in tens of trillions of tons of stuff we’re used to, like rocks or water; about as much as in a mid-sized asteroid, 40 km across.

By analyzing the publicly released INTEGRAL data (about one year’s worth), J?rgen Kn?dlseder and his colleagues found that:

  • the positrons which are being annihilated in the Milky Way disk most likely come from the beta+ (i.e. positron) decay of the isotopes Aluminium-26 and Titanium-44, which themselves were produced in recent supernovae (remember, astronomers call even 10 million years ago ‘recent’)
  • however, there are more positrons being annihilated in the Milky Way bulge than in the disk, by a factor of five
  • there don’t seem to be any ‘point’ sources.

Of course, to an INTEGRAL scientist, a ‘point’ source doesn’t have quite the same meaning as it does to an amateur astronomer! Gamma-ray vision in the positronium line is incredibly blurry, an object six Moons across (3?) would look like a ‘point’! Nonetheless, Kn?dlseder and his team of astrophysics sleuths are able to say that “none of the sources we searched for showed a significant 511 keV flux”; these 40 ‘usual suspects’ include pulsars, quasars, black holes, supernovae remnants, star-forming regions, rich galaxy clusters, satellite galaxies, and blazars. But, they’re still looking, “We have indeed [planned,] dedicated INTEGRAL observations of the usual suspects, such as Type Ia supernovae (SN1006, Tycho), and LMXB (Cen X-4) which might help to solve this problem.”

So, where do the 15 billion tons of positrons being annihilated every second in the bulge come from? “For me the most important thing about the positron annihilation is that the principal source is still a mystery,” says Kn?dlseder. “We can explain the faint emission from the disk by Aluminium-26 decay, but the bulk of positrons are situated in the bulge region of the Galaxy, and we have no source that can easily explain all observational characteristics. In particular, if you compare the 511 keV sky to the sky observed at other wavelengths you recognise that the 511 keV sky is unique! There is no other sky that resembles to what we observe.”

The INTEGRAL team feel they can rule out massive stars, collapsars, pulsars, or cosmic ray interactions, for if these were the source of the bulge positrons, then the disk would be much brighter in 511 keV light.

The bulge positrons may come from low-mass X-ray binaries, classical novae, or Type 1a supernovae, through a variety of processes. The challenge in each case is to understand how sufficient positrons created by these could survive long enough afterwards and diffuse far enough from their birthplaces.

What about cosmic strings? While the recent Tanmay Vachaspati paper proposing these as a possible source of the bulge positrons came out too recently for Kn?dlseder et al. to consider for their paper, “Yet for me it is not obvious that we have enough observational constraints to state that cosmic strings make the 511 keV; we don’t even know if cosmic strings exist. One would need a unique characteristic of cosmic strings that exclude all other sources, and today I think we are far from this.”

Perhaps most excitingly, the positrons may come from the annihilation of a low-mass dark matter particle and its anti-particle, or as Kn?dlseder et al. put it “Light dark matter (1-100 MeV) annihilation, as suggested recently by Boehm et al. (2004), is probably the most exotic but also the most exciting candidate source of galactic positrons.” Dark matter is even more exotic than positronium; dark matter is not anti-matter, and no one has been able to capture it, let alone study it in a lab. Astronomers accept that it is ubiquitous and tracking down its nature is one of the hottest topics in both astrophysics and particle physics. If the billions of tons per second of positrons that are annihilated in the Milky Way bulge cannot have come from classical novae or thermonuclear supernovae, then perhaps good old dark matter is to blame.

Afterlife of a Supernova

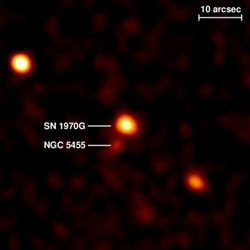
Chandra image of SN1970G. Image credit: NASA. Click to enlarge.
As astronomers look out over the Universe, one principle stands out in bas relief above the vast welter of data and information captured by their instruments – the Universe is a work in progress. From hydrogen atom to galaxy cluster, things undergo change in surprisingly similar ways. A principle of growth, maturation, death, and rebirth is at play in the Universe. Nowhere is that principle more fully embodied than in the primary sources of light we see through our instruments – the stars.

On June 1 2005, a pair of investigators (Stefan Immler of NASA’s Goddard Space Flight Center and K.D. Kuntz of John Hopkins University) published X-ray data collected from a variety of space-borne instruments. The data reveals how one massive star passing within a nearby galaxy (M101) can help us understand the relatively short period between a star’s death and the transformation of its luminous wreath of gas into a supernova remnant. That star – supernova SN 1970G – has now experienced some 35 years of a visible “afterlife” in the form of a rapidly spinning neutronic core within an expansive circumstellar aura of gas and dust (the CSM or circumstellar matter). Even now (from our perception) heavy metals race outward at a speed of thousands of kilometers per second – potentially planting seeds of organic matter within the Interstellar Medium (ISM) of a 27 million light year distant galaxy – one easily visible in the smallest of instruments within the spring constellation of Ursa Majoris. Only when the energy within that matter reaches the ISM, will 1970G have completed its cycle of birth and potential rebirth to take form in new stars and planets.

The destiny of a star is primarily determined by its mass. Surviving for as little as 50,000 years, the most massive stars (as great as 150 suns) condense out of vast concentrations of cold gas and dust to eventually live very fast lives. In youth, such stars exult as brilliant blue giants radiating near-ultraviolet light from a photosphere whose temperature may be five times greater than that of our own Sun. Within such stars nuclear furnaces rapidly accumulate giving off prodigious amounts of extremely intense radiation. Pressure from this radiation propels the star’s outer shroud outward many times over even as a howling gale of highly charged particles boils off its surface to become the stars CSM. Due to pressure exerted by its rapidly expanding core, such a star’s nuclear engine eventually becomes starved for fuel. The subsequent collapse is marked by a brilliant light show – one that can potentially outshine an entire galaxy. At magnitude 12.1, type II supernova 1970G never became bright enough to overcome its 8th magnitude host. But for some 30,000 years prior to its efflorescence, 1970G boiled off copious quantities of hydrogen and helium gas in the form of a powerful solar wind. Later, that same diaphanous aura of matter took the brunt of 1970G’s outburst shocking it into X-ray excitation. And it is that period of expanding shockwaves that has dominated the energy signature or “flux” of 1970G over the past 35 years of observation.

According to a paper entitled “Discovery of X-Ray Emission from Supernova 1970G with Chandra” Immler and Kuntz report that, “As the oldest SN detected in X-rays, SN 1970G allows, for the first time, direct observation of the transition from a SN to its supernova remnant (SNR) phase.”

Although the report cites X-ray data from a variety of X-ray satellites, the bulk of the information comes out of a series of five sessions using the NASA’s Chandra X-Ray Observatory during the period July 5-11, 2004. During those sessions a total of almost 40 hours of soft X-rays were collected. Chandra’s superior spatial resolution and the sensitivity gained from long-term observation allowed astronomers to fully resolve the supernova’s X-ray lightcurve from that of a nearby HII region within the galaxy – a region bright enough in visible light to have been included in J.L.E Dreyer’s New General Catalog compiled during the late 19th century – NGC 5455.

Results from this – and a handful of other observations of supernova afterglow using NASA’s Chandra and ESA’s XMM-Newton – have confirmed one of the leading theories of post-supernova X-ray lightcurves. From the paper: “high-quality X-ray spectra have confirmed the validity of the circumstellar interaction models which predict a hard spectral component for the forward shock emission during the early epoch (less than 100 days) and a soft thermal component for the reverse shock emission after the expanding shell has become optically thin.”

For tens of thousands of years before going supernova, the star that became SN 1970G quietly boiled away matter into space. This created an expansive extrastellar aura of hydrogen and helium in the form of a CSM. When it went supernova, a massive flux of hot matter shot into space as SN 1970G’s mantle rebounded after collapse onto its superheated core. For roughly 100 days, the density of this matter remained exceedingly high and – as it smacked into the CSM – hard X-rays dominated the output of the noval flux. These hard X-rays contain ten to twenty times as much energy as those to follow.

Later as this highly energized matter expanded enough to become optically transparent, a new period supervened – X-ray flux from the CSM itself caused a reverse flood of lower-energy “soft” X-rays. That period is expected to continue until the CSM expands to the point of fusion with Interstellar Matter (the ISM). At that time the supernova remnant will form and thermal energy within the CSM will ionize the ISM itself. Out of this will come the characteristically “blue-green” glow visible in such supernovae remnants as the Cygnus Loop when seen through even modest amateur instruments and appropriate filters.

Has SN 1970G evolved into a supernova remnant yet?

One important clue to solving this question is seen in the mass-loss rate of the supernova before eruption. According to Immler and Kuntz: “The measured mass-loss rate for SN 1970G is similar to those inferred for other Type II SNe, which typically range from 10-5 to 10-4 solar masses per year. This is indicative that the X-ray emission arises from shock-heated CSM deposited by the progenitor rather than shock-heated ISM, even at this late epoch after the outburst.”

According to Stefan Immler, “Supernovae usually fade away quickly in the near aftermath of their explosion as the shock wave reaches the outer boundaries of the stellar wind, which becomes thinner and thinner. A few hundred years later, however, the shock runs into the interstellar medium, and produces copious X-ray emission due to the high densities of the ISM. Measurements of the densities at the shock front of 1970G showed that they are characteristic of stellar winds, which are more than an order of magnitude smaller than the densities of the ISM.”

Because of the low levels of X-ray output, the authors have concluded that 1970G has yet to reach the supernova remnant phase – even at an age of 35 years after the explosion. Based on studies associated with supernova remnants such as the Cygnus Loop we know that once remnants are formed, they can persist for tens of thousands of years as superheated matter fuses with the ISM. Later, after the shock-heated ISM has finally cooled off, new stars and planets may form enriched by heavy atoms such as carbon, oxygen, and nitrogen along with even heavier elements (such as iron) produced during the brief moment of the actual supernova explosion – the stuff of life.

Clearly SN 1970G has a great deal more to teach us about the afterlife of massive stars and its march toward supernova remnant status will continue to be carefully monitored well into the future.

Written by Jeff Barbour

Podcast: Homing Beacon for an Asteroid

Asteroids have been roughing up the Earth since it formed 4.6 billion years ago. Hundreds of thousands of potentially devastating asteroids are still out there, and whizzing past our planet all the time. Eventually, inevitably, one is going to score a direct hit and cause catastrophic damage. But what if we could get a better idea of where all these asteroids are or even learn to shift their orbits? Dr Edward Lu is a NASA astronaut, and a member of the B612 Foundation – an organization raising awareness about the threat of these asteroids and some potential solutions.
Continue reading “Podcast: Homing Beacon for an Asteroid”

Second Boom Set to Deploy

Mars Express and its 20-metre radar booms. Image credit: ESA. Click to enlarge.
Following in-depth analyses performed after the deployment of the first MARSIS antenna boom on board Mars Express, ESA has decided to proceed with the deployment of the second 20-metre antenna boom.

The full operation will be performed during a time frame starting 13 June and nominally ending on 21 June.

A delay in the execution of the second boom deployment was necessary, due to problems encountered with the first deployment in early May this year. During the deployment, one of the antenna hinges (the tenth) got stuck in an unlocked position. Analysis of data obtained from earlier ground testing suggested a potential solution.

The Mars Express spacecraft control team at ESA?s Spacecraft Operations Centre (ESOC) succeeded in unblocking the hinge by exposing the cold side of the boom to the Sun. This warmed the hinges and the boom quickly became unstuck. In the end, the first boom deployment was completed on 10 May.

The lessons learnt during the first boom deployment were used to run new simulations and determine a new deployment scenario for the second boom. This scenario contains an additional sun-heating phase, to get the best possible thermal conditions for all hinges.

The deployment of the third (7-metre) third MARSIS boom is not considered critical. It will be commanded only once the ESA ground control team have re-acquired signal from the spacecraft, and made sure with a sequence of tests that the second boom is correctly locked into position and the spacecraft is well under control.

After this event MARSIS, the Mars Express Sub-Surface Radar Altimeter, will enter into a commissioning phase for the next few weeks, before starting to look at Mars?s ionosphere during martian daylight, and to probe down below the Martian surface during the martian night.

Original Source: ESA News Release

Audio: Homing Beacon for an Asteroid

NASA Astronaut B612 Foundation director Dr. Edward Lu. Image credit: NASA
Listen to the interview: Homing Beacon for an Asteroid (6.2 mb)

Or subscribe to the Podcast: universetoday.com/audio.xml

Fraser Cain: Can you give me some background on the development of the B612 Foundation?

Dr. Edward Lu: It all started a few years back with a couple of different conversations I had with Piet Hut at the Institute for Advanced Studies, and a former astronaut called Rusty Schweickart. We were discussing the advances in high specific impulse propulsion, in other words ion propulsion or plasma propulsion, which is currently being worked on at NASA. We wondered, what could you use this for? One of the things that I’d been thinking about and discussed with various other people was the idea of pushing on an asteroid to demonstrate how this would work; to actually have a mission that would need this technology and would therefore drive you to complete the technology. Having a direct goal is the best way to get you to actually build something. The idea of moving an asteroid that something we’re eventually going to need to do, which is something that’s not possible using current chemical rockets. So we talked about that, and eventually we organized a meeting here at NASA of folks who work in the area of asteroids or working on spacecraft development. That was about 3-4 years ago. Everyone came down to NASA in Houston, and we talked about the idea and what it would take; how much thrust you would need, how much power you would need, how you could do such a thing. Our little foundation was an outgrowth of that meeting.

Fraser: You’ve set your sights on an asteroid that’s going to be swinging past the Earth in a couple of decades.

Lu: This is a proposal that’s been put forth by Rusty. This is an asteroid called 2004 MN4, which is going to make a very close flyby of the Earth in the year 2029 – it’s actually going to be about 4 Earth radii away, below the altitude of our geosynchronous satellites. It’s going to pass so close to the Earth that it’s going to take a pretty sharp bend in its trajectory. The problem is that where it goes after this flyby is really critically dependant on how close it comes to the Earth. It’s like a banked billiard shot. If you make a small error in a banked shot and you can have a big error where the ball goes after bouncing off of another ball. And that’s exactly what’s going on here. It turns out that our best guess at where it’s going to be when it comes by the Earth means that if there is a chance that 6-7 years later – either 2035 or 2036 – this thing could come back and actually hit the Earth. Now the chances are really small because we don’t have very good information on how close it’s going to be to the Earth. We only know its distance, how close it’s going to come to the Earth, by a factor of some thousands of miles. In order to know whether it’s going to come back and hit the Earth, you need to know accurately how close it’s going to come to the Earth to withing a factor of a few hundred metres, less than a kilometre. That’s why the best we can say is, oh, there’s some chance that it could hit us, but we just can’t simply say any better. What Rusty pointed out is that as the years go by, running up to 2029, this asteroid is going to go basically on the other side of the Sun. Its orbit is going to be on the other side of the Sun for some period of time. We’re going to lose track of it here in the next year or so. In which case, we won’t be able to pick it up again for another 6-7 years when it’s no longer orbiting the Sun, but on the other side of it. Its orbit will bring it back around our side of the Sun and we’ll pick it up again, and by then we’ll be able to determine its orbit more accurately, but the question is, will it be accurate enough to determine whether or not – after this slingshot when it comes by the Earth in 2029 – it will come hit us later.

Fraser: And you’re hoping if you can put some kind of tracking on the asteroid, then you’d be able to get it down within that few hundred metres distance.

Lu: Exactly, and the reason Rusty pointed out that’s it’s important to do it early is because, what if you find out that it is going to come back and hit us? If you’re going to do something about it, you would need to do something about it before 2029, before the close pass. And the reason is, again going back to a billiard shot, let’s say you’re taking a cue ball and trying to shoot it straight into a corner pocket. You can be a bit off in your aim and you can still hit that pocket pretty well. But not if you’re trying to hit another ball into the corner or do a bank shot where the cue ball bounces off something and then goes into the corner. Even a small error can mean you’re going to miss. So that’s both good and bad. If this thing is on a collision course, before 2029 you can upset it and keep it from going on a collision course by a very small change in its velocity. After 2029, it becomes very hard, in fact, more than likely not possible.

Fraser: I guess that’s one of my concerns in general about this whole process of detecting asteroids is that it’s all a world of probabilities. It’s not like it’s absolutely going to hit us on this date or anything. These are the chances of this asteroid, and those are the chances of that asteroid, and I wonder…

Lu: Well, it’s not really a matter of probability, that’s kind of a misnomer. Each one of these things either is going to hit us or it won’t. The reason you call it probability is because we can’t measure its exact trajectory well enough to say yes or no. That’s why we list it as probability. In the same way as: will it rain tomorrow. They say 30% chance of precipitation. It either is or isn’t going to rain, it’s just that we can’t tell you. In essence it’s like a weather forecast. And the accuracy with which you can measure the orbit, or the accuracy you can tell the weather, tells you how accurate your forecast is going to be. The forecast probability has nothing to do with the asteroid itself, it’s solely a matter of our telescopes.

Fraser: Right, and our techniques. What kind of mission would be involved to actually reach out and tap the asteroid?

Lu: First off, what’s actually been proposed is not to actually move it yet because the chances are that you won’t have to do it. What he’s actually proposing is that you put something on it that just simply measures where it is so you can tell for sure whether or not it’s going to hit or not. You want to know that early enough so that if it actually was coming, then you could do something about it. That’s what’s behind the idea of putting a transponder; all that is is a radio transmitter that you can measure exactly where it is. If you had to move it, that’s a whole other issue. But, the first thing is to know whether or not it’s even an issue or not.

Fraser: And so, what kind of mission would be involved to actually put the transmitter on the asteroid?

Lu: That’s something that would be a relatively simple mission, meaning all you have to do is get into the vicinity of it. You don’t even have to put down on it. Although, if you’re already going there, you might as well make this thing a very productive scientific mission because there’s plenty of things we can learn about asteroids. We’ve never visited a small asteroid. We’ve sent probes to much larger asteroids, hundreds of miles across, versus this one which is actually very small compared to those other ones – just a little over 300 metres across. Never having seen one of these things up close, obviously it could be a great scientific mission. What Rusty’s pointed out is that you kind of get two things here: number one, in the very unlikely case that this thing is going to hit us, this’ll tell you whether or not it will (more than likely not); but, if in fact it is not going to hit us, you have still put a very scientifically interesting mission out there. You can see what this thing is made of, what its surface structure is like, what it might be like to land on one of these things later, if you have to move another one. It tells you a lot about the properties of asteroids, so this thing doesn’t go to waste if you find, as it likely, that it’s not going to hit you.

Fraser: And what kind of time frame would you want to be able to launch it by?

Lu: You’d want to put it up something around the 2012/2013 time frame. And the reason is, again, you need lead time. Let’s say you put it up there in 2012 or 2013 and it takes a year or so to get there, and then you know within a year or so after that it is or isn’t going to hit you. Let’s say that you found out that it was going to hit you; well now it’s like 2015 at this point, and that gives you substantial 14 years to do something about it, before the close approach in 2029. Now you’re talking a much more ambitious mission, you’re talking a mission where you’re actually going to go push on this thing. That’s why you need the lead time. Something like that has never been tried before. It’s not something you can have an off the shelf spacecraft and say, well, we’ll just go ahead and launch it. It’s going to take some years to prepare the spacecraft, get it ready to launch, test it, and then fly it.

Visit the B612 Foundation Website