Low Oxygen Accelerated the Great Dying

The biggest mass extinction in Earth history some 251 million years ago was preceded by elevated extinction rates before the main event and was followed by a delayed recovery that lasted for millions of years. New research by two University of Washington scientists suggests that a sharp decline in atmospheric oxygen levels was likely a major reason for both the elevated extinction rates and the very slow recovery.

Earth’s land at the time was still massed in a supercontinent called Pangea, and most of the land above sea level became uninhabitable because low oxygen made breathing too difficult for most organisms to survive, said Raymond Huey, a UW biology professor.

What’s more, in many cases nearby populations of the same species were cut off from each other because even low-altitude passes had insufficient oxygen to allow animals to cross from one valley to the next. That population fragmentation likely increased the extinction rate and slowed recovery following the mass extinction, Huey said.

“Biologists have previously thought about the physiological consequences of low oxygen levels during the late Permian period, but not about these biogeographical ones,” he said.

Atmospheric oxygen content, about 21 percent today, was a very rich 30 percent in the early Permian period. However, previous carbon-cycle modeling by Robert Berner at Yale University has calculated that atmospheric oxygen began plummeting soon after, reaching about 16 percent at the end of the Permian and bottoming out at less than 12 percent about 10 million years into the Triassic period.

“Oxygen dropped from its highest level to its lowest level ever in only 20 million years, which is quite rapid, and animals that once were able to cross mountain passes quite easily suddenly had their movements severely restricted,” Huey said.

He calculated that when the oxygen level hit 16 percent, breathing at sea level would have been like trying to breathe at the summit of a 9,200-foot mountain today. By the early Triassic period, sea-level oxygen content of less than 12 percent would have been the same as it is today in the thin air at 17,400 feet, higher than any permanent human habitation. That means even animals at sea level would have been oxygen challenged.

Huey and UW paleontologist Peter Ward are authors of a paper detailing the work, published in the April 15 edition of the journal Science. The work was supported by grants from the National Science Foundation and the National Aeronautics and Space Administration’s Astrobiology Institute.

Not only was atmospheric oxygen content dropping at the end of the Permian, the scientists said, but carbon dioxide levels were rising, leading to global climate warming.

“Declining oxygen and warming temperatures would have been doubly stressful for late Permian animals,” Huey said. “As the climate warms, body temperatures and metabolic rates go up. That means oxygen demand is going up, so animals would face an increased oxygen demand and a reduced supply. It would be like forcing athletes to exercise more but giving them less food. They’d be in trouble.”

Ward was lead author of a paper published in Science earlier this year presenting evidence that extinction rates of land vertebrates were elevated throughout the late Permian, likely because of climate change, and culminated in a mass extinction at the end of the Permian. The event, often called “the Great Dying,” was the greatest mass extinction in Earth’s history, killing 90 percent of all marine life and nearly three-quarters of land plants and animals.

Ward said paleontologists had previously assumed that Pangea was not just a supercontinent but also a “superhighway” on which species would have encountered few roadblocks while moving from one place to another.

However, it appears the greatly reduced oxygen actually created impassable barriers that affected the ability of animals to move and survive, he said.

“If this is true, then I think we have to go back and look at oxygen and its role in evolution and how different species developed,” Ward said. “You can go without food for a couple of weeks. You can go without water for a few days. How long can you go without oxygen, a couple of minutes? There’s nothing with a greater evolutionary effect than oxygen.”

Original Source: UW News Release

The Search for the Mountain of Eternal Sunlight

ESA?s SMART-1 mission to the Moon has been monitoring the illumination of lunar poles since the beginning of 2005, about two months before arriving at its final science orbit.

Ever since, the AMIE on-board camera has been taking images which are even able to show polar areas in low illumination conditions. Images like these will help identify if peaks of eternal light exist at the poles.

SMART-1 took views of the North Polar Region from a distance of 5000 km during a pause in the spiralling descent to the science orbit. One can see highland terrains, very highly cratered due to their old age. The rims of the large craters project very long shadows even on surrounding features. SMART-1 is monitoring the polar shadows cast during the Moon rotation, and their seasonal variations, to look for places with long-lasting illumination.

The image shows a 275 km area close to the North pole (upper left corner) observed by SMART-1 on 29 December 2004 from a distance of 5500 km. This shows a heavily cratered highland terrain, and is used to monitor illumination of polar areas, and long shadows cast by large crater rims.

SMART-1 also observated a North polar area 250 km wide on 19 January 2005 (close to North winter solstice) from a distance of 5000 km. The illuminated part of crater rim is very close to the North pole and is a candidate for a peak of eternal sunlight.

?This shows the ability of SMART-1 and its camera to image even for low light levels at the poles and prospect for sites for future exploration?, says AMIE camera Principal Investigator Jean-Luc Josset, (SPACE-X, Switzerland).

?If we can confirm peaks of eternal light?, adds Bernard Foing, SMART-1 Project Scientist, ?these could be a key locations for possible future lunar outposts?.

The existence of peaks of eternal light at the poles, that is areas that remain eternally illuminated regardless of seasonal variations, was first predicted in the second half of the nineteenth century by the astronomer Camille Flammarion. Even if for most of the Moon the length of the day does not vary perceptibly during the course of seasons, this is not the case over the poles, where illumination can vary extensively during the course of the year. The less favourable illumination conditions occur around the northern winter solstice, around 24 January. There are areas at the bottom of near-polar craters that do not see direct sunshine, where ice might potentially be trapped. Also there are areas at higher elevation on the rim of polar craters that see the Sun more than half of the time. Eventually, there may be areas that are always illuminated by sunlight.

Original Source: ESA News Release

Problem with Opportunity’s Front Wheel

The terrain that Opportunity is crossing has been steadily getting more wavy. After a long drive southward from “Voyager” crater, Opportunity’s right-front steering motor stalled out on sol 433 during an end-of-drive turn. While performing tests to help the team diagnose the condition of that motor, the rover also continued to make remote-sensing observations. Testing in sol 435 did show motion in the steering motor, but analysis is still underway. The rover resumed normal science and driving operations on sol 436, but with restrictions on use of the right-front steering motor. It drove 30 meters on sol 437. Opportunity and Spirit are capable of driving with one or more steering motors disabled, though turns would be less precise. The latest revision in flight software on both rovers, uploaded in February, gives them improved capabilities for dealing with exactly this type of condition. It gives them upgraded ability to repeatedly evaluate how well they are following the intended course during a drive, and to adjust the steering autonomously if appropriate.

Original Source: NASA/JPL News Release

Ghostly Supernova Remnant

This image, made by combining 150 hours of archived Chandra data, shows the remnant of a supernova explosion. The central bright cloud of high-energy electrons is surrounded by a distinctive shell of hot gas.

The shell is due to a shock wave generated as the material ejected by the supernova plows into interstellar matter. The shock wave heats gas to millions of degrees, producing X-rays in the process.

Although many supernovas leave behind bright shells, others do not. This supernova remnant, identified as G21.5-0.9 by radio astronomers 30 years ago, was considered to be one that had no shell until it was revealed by Chandra.

The absence of a detectable shell around this and similar supernova remnants had led astronomers to speculate that another, weaker type of explosion had occurred. Now this hypothesis seems unlikely, and it is probable that the explosion of every massive star sends a strong shock wave rumbling through interstellar space.

Some supernova shells are faint because of the lack of material around the star before it explodes. Rapid mass loss from the star before the explosion could have cleared out the region.

By examining the properties of the shell with an X-ray telescope, astronomers can work back to deduce the age (a few thousand years), and energy of the explosion, as well as information about the state of the star a million years before it exploded. The star that produced this supernova shell is thought to have been at least 10 times as massive as the Sun.

Original Source: Chandra News Release

Ancient Impact Craters Reveal Mars’ First Equator

Since the time billions of years ago when Mars was formed, it has never been a spherically symmetric planet, nor is it composed of similar materials throughout, say scientists who have studied the planet. Since its formation, it has changed its shape, for example, through the development of the Tharsis bulge, an eight kilometer [five mile] high feature that covers one-sixth of the Martian surface, and through volcanic activity. As a result of these and other factors, its polar axis has not been stable relative to surface features and is known to have wandered through the eons as Mars rotated around it and revolved around the Sun.

Now, a Canadian researcher has calculated the location of Mars’ ancient poles, based upon the location of five giant impact basins on the planet’s surface. Jafar Arkani-Hamed of McGill University in Montreal, Quebec, has determined that these five basins, named Argyre, Hellas, Isidis, Thaumasia, and Utopia, all lie along the arc of a great circle. This suggests that the projectiles that caused the basins originated with a single source and that the impacts trace the Martian equator at the time of impact, which was prior to the development of the Tharsis bulge, he says.

Writing in the Journal of Geophysical Research (Planets), Arkani-Hamed calculates that the source of the five projectiles was an asteroid that had been circling the Sun in the same plane as Mars and most of the other planets. At one point, it passed close to the planet, until the force of Martian gravity surpassed the tensile strength of the asteroid, at which point it fragmented. The five large fragments would have remained in the same plane, that of Mars’ then-equator. They hit in different spots around the Martian globe, due to Mars’ rotation on its then-axis and the differing lengths of time the fragments took before impacting on Mars.

Arkani-Hamed describes the locations of the resulting basins, only three of which are well preserved. The two others have been detected by analysis of Martian gravitational anomalies. The great circle they describe on the Martian surface has its center at latitude -30 and longitude 175. By realigning the map of Mars with that spot as the south pole, the great circle marks the ancient equator.

Arkani-Hamed estimates that the mass of the asteroid captured by Mars was about one percent of that of Earth’s Moon. Its diameter was in the range of 800 to 1,000 kilometers [500 to 600 miles], depending upon its density, which cannot be determined.

The significance of Arkani-Hamed’s findings, if borne out by further research, is that the extent of presumed underground water on Mars would have to be reassessed. “The region near the present equator was at the pole when running water most likely existed,” he said in a statement. “As surface water diminished, the polar caps remained the main source of water that most likely penetrated to deeper strata and has remained as permafrost, underlain by a thick groundwater reservoir. This is important for future manned missions to Mars.”

Original Source: AGU News Release

Fundamental Aspect of the Universe has Remained Unchanged

A fundamental number that affects the color of light emitted by atoms as well as all chemical interactions has not changed in more than 7 billion years, according to observations by a team of astronomers charting the evolution of galaxies and the universe.

The results are being reported today (Monday, April 18) at the annual meeting of the American Physical Society (APS) by astronomer Jeffrey Newman, a Hubble Fellow at Lawrence Berkeley National Laboratory representing DEEP2, a collaboration led by the University of California, Berkeley, and UC Santa Cruz. Newman is presenting the data and an update on the DEEP2 project at a 1 p.m. EDT press conference at the Marriott Waterside Hotel in Tampa, Fla.

The fine structure constant, one of a handful of pure numbers that occupy a central role in physics, pops up in nearly all equations involving electricity and magnetism, including those describing the emission of electromagnetic waves – light – by atoms. Despite its fundamental nature, however, some theorists have suggested that it changes subtly as the universe ages, reflecting a change in the attraction between the atomic nucleus and the electrons buzzing around it.

Over the past few years, a group of Australian astronomers has reported that the constant has increased over the lifetime of the universe by about one part in 100,000, based on its measurements of the absorption of light from distant quasars as the light passes through galaxies closer to us. Other astronomers, however, have found no such change using the same technique.

The new observations by the DEEP2 survey team use a more direct method to provide an independent measure of the constant, and show no change within one part in 30,000.

“The fine structure constant sets the strength of the electromagnetic force, which affects how atoms hold together and the energy levels within an atom. At some level, it is helping set the scale of all ordinary matter made up of atoms,” Newman said. “This null result means theorists don’t need to find an explanation for why it would change so much.”

The fine structure constant, designated by the Greek letter alpha, is a ratio of other “constants” of nature that, in some theories, could change over cosmic time. Equal to the square of the charge of the electron divided by the speed of light times Planck’s constant, alpha would change, according to one recent theory, only if the speed of light changed over time. Some theories of dark energy or grand unification, in particular those that involve many extra dimensions beyond the four of space and time with which we are familiar, predict a gradual evolution of the fine structure constant, Newman said.

DEEP2 is a five-year survey of galaxies more than 7-to-8-billion-light years distant whose light has been stretched out or redshifted to nearly double its original wavelength by the expansion of the universe. Though the collaborative project, supported by the National Science Foundation, was not designed to look for variation in the fine structure constant, it became clear that a subset of the 40,000 galaxies so far observed would serve that purpose.

“In this gigantic survey, it turns out that a small fraction of the data seems to be perfect for answering the question Jeff’s asking,” said DEEP2 principal investigator Marc Davis, professor of astronomy and of physics at UC Berkeley. “This survey is really general purpose and will serve a million uses.”

Several years ago, astronomer John Bahcall of the Institute for Advanced Study pointed out that, in the search for variations in the fine structure constant, measuring emission lines from distant galaxies would be more direct and less error-prone that measuring absorption lines. Newman quickly realized that DEEP2 galaxies containing oxygen emission lines were perfectly suited to provide a precise measure of any change.

“When the contradictory results from absorption lines starting showing up, I had the idea that, since we have all these high redshift galaxies, maybe we can do something not with absorption lines, but with emission lines within our sample,” Newman said. “Emission lines would be very slightly different if the fine structure constant changed.”

The DEEP2 data allowed Newman and his colleagues to measure the wavelength of emission lines of ionized oxygen (OIII, that is, oxygen that has lost two electrons) to a precision of better than 0.01 Angstroms out of 5,000 Angstroms. An Angstrom, about the width of a hydrogen atom, is equivalent to 10 nanometers.

“This is a precision surpassed only by people trying to look for planets,” he said, referring to detection of faint wobbles in stars due to planets tugging on the star.

The DEEP2 team compared the wavelengths of two OIII emission lines for 300 individual galaxies at various distances or redshifts, ranging from a redshift of about 0.4 (approximately 4 billion years ago) to 0.8 (about 7 billion years ago). The measured fine structure constant was no different from today’s value, which is approximately 1/137. There also was no upward or downward trend in the value of alpha over this 4-billion-year time period.

“Our null result is not the most precise measurement, but another method (looking at absorption lines) that gives more precise results involves systematic errors that cause different people using the method to come up with different results,” Newman said.

Newman also announced at the APS meeting the public release of the first season of data (2002) from the DEEP2 survey, which represents 10 percent of the 50,000 distant galaxies the team hopes to survey. DEEP2 uses the DEIMOS spectrograph on the Keck II telescope in Hawaii to record redshift, brightness and color spectrum of these distant galaxies, primarily to compare galaxy clustering then versus now. The survey, now more than 80 percent complete, should finish observations this summer, with full data release by 2007.

“This is really a unique data set for constraining both how galaxies have evolved and how the universe has evolved over time,” Newman said. “The Sloan Digital Sky Survey is making measurements out to about redshift 0.2, looking back the last 2-3 billion years. We really start at redshift 0.7 and peak at 0.8 or 0.9, equivalent to 7-8 billion years ago, a time when the universe was half as old as it is today.”

The survey also has completed measurements that could shed light on the nature of dark energy – a mysterious energy that permeates the universe and seems to be causing the universe’s expansion to accelerate. The team now is modeling various theories of dark energy to compare theoretical predictions with the new DEEP2 measurements.

As Davis explained it, the amount of dark energy, now estimated to be 70 percent of all the energy in the universe, determines the evolution of galaxies and clusters of galaxies. By counting the number of small groups and massive clusters of galaxies in a distant volume of space as a function of their redshift and mass, it is possible to measure the amount by which the universe has expanded to the present day, which depends on the nature of dark energy.

“Basically, you count the clusters and ask, ‘Are there a lot, or a few?'” Davis said. “That’s all it amounts to. If there are very few clusters, that means the universe expanded quite a ways. And if there are a lot of clusters the universe didn’t expand as much.”

Davis currently is comparing DEEP2 measurements with predictions of the simplest dark energy theory, but hopes to collaborate with other theoreticians to test more exotic dark energy theories.

“What they are really trying to get at is how the dark energy density is changing as the universe is expanding,” said UC Berkeley theoretical physicist Martin White, a professor of astronomy and of physics who has worked with Davis. “If the dark energy density is Einstein’s cosmological constant, then the theoretical prediction is that it doesn’t change. The holy grail now is to get some evidence that it’s not the cosmological constant, that it is in fact changing.”

Original Source: UC Berkeley

Audio: Oldest Star Discovered

Image credit: ANU
Listen to the interview: Oldest Star Discovered (2.5 mb)

Or subscribe to the Podcast: universetoday.com/audio.xml

Fraser Cain: How old is this star that you’ve found?

Anna Frebel: Well, that’s a bit of a problem because we cannot actually place an exact age on the star. You would need to measure radioactive elements in the star and if you said already that the star if very primitive, it is mint condition, so we don’t see any radioactive elements and hence we can only make a good guess on how old it is.

Fraser: How does it look different from our own sun?

Frebel: It’s very different from our Sun. We found the star because it had very low iron as compared to the Sun and this is also the reason why we think it is the oldest star because it has the lowest iron ever observed, and not only the iron, but also many other elements; carbon and nitrogen are very low as compared to the Sun.

Fraser: Why does our Sun have larger amounts of iron and this one doesn’t?

Frebel: If you consider the chemical evolution of the galaxy, and the entire universe, and you might know that after the Big Bang, the universe started out only with hydrogen and helium, and a little bit of lithium, and all the time, the heavy elements were synthesized in the stars themselves, now, certain elements such as carbon, nitrogen, oxygen and iron were synthesized during the lifetime of stars, but other elements, especially the heavy ones, were produced in supernova explosions; the death of a big star. So over time, the stars got enriched more and more in heavy elements; the Sun is not very old by astronomical standards, hence it has much more heavy elements than the star 183027, which was what we found.

Fraser: So you are saying that normal stars like our Sun have been through the wash cycle several times, and they have had their matter recycled through several stars, and that’s why they have some of the higher elements in them. How can a star remain untouched from such a long period?

Frebel: Well the density of stars in some areas is rather low and others, it’s higher; this star is a field halo star, so it’s in an area of our galaxy which is not very populated, so it’s just been sitting there for many, many, many years, and because it’s a low mass star, it is still very unevolved, so it’s just waiting there for us to find it.

Fraser: What kind of star is it, because I understand that our Sun is several billion years old, but definitely not the age of the universe, so what kind of star is it that it could be as old as the Big Bang?

Frebel: The star is a low mass star, it’s a bit lighter than the Sun and that means that it evolved very very slowly. I mean the Sun, well, it’s still in its teenage years, so it hasn’t burned much. High mass stars burn very very fast, and they explode quickly as a supernova enriching the surrounding gas; the interstellar medium with heavy elements, but this star, because it is so low in mass has just been sitting there and burning its hydrogen slowly and we think the hydrogen has just finished burning. So helium should be the next stage.

Fraser: How early on do you think it actually formed? How long after the Big Bang?

Frebel: Well, we have 2 scenarios; one would be that it formed in the second generation of stars and the first generation formed within one billion years after the Big Bang. So that star should have formed very quickly, probably about one billion years after the Big Bang. And the second theory which we cannot exclude, although I personally don’t favor it, is that the star indeed is a first star itself, meaning that it formed as one of the very, very first stars in the universe and presumably that happened then within the first billion years.

Fraser: Do you think that there are many of these types of stars in the Milky Way?

Frebel: Good question; probably not because they are very old and hence they are very rare because it seems that there is a certain type of these low mass stars which are actually able to survive that long and astronomers have been searching for these types of stars for the last 30-40 years and so far, we’ve only found 2 in huge efforts, so we are really looking for the needle in the haystack I would say.

Fraser: In the last couple of years, I have been covering the fires at Mount Stromlo. How is the observatory doing?

Frebel: It’s doing very well. We haven’t been affected from a science point of view. We have been very much productive since the fires. The reconstruction has now started; we are getting an new advanced, technological instrumentation building so we have a lot of noise here, but that also means things are progressing. Everyone is doing very well and we’ve, I think psychologically, we’ve put the fires way behind us.

What’s Up This Week – Apr 18 – Apr 24, 2005

Image credit: NOAO/AURA/NSF
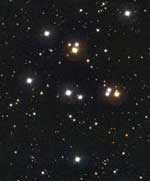
Monday, April 18 – Tonight let’s use two bright celestial objects to our advantage to help you locate an outstanding galactic cluster – M44. Because this great gathering of stars is located near the ecliptic plane, you will find it easily tonight in binoculars by scanning the area mid-point between Saturn and the Moon. Also known as the “Beehive”, this wonderful open cluster is sufficiently bright enough to be seen unaided under darker conditions. In ancient times it was used as a weather predicting tool – if it was not visible under otherwise clear skies – a major storm was on the way. This easy collection of bright pairs was known and recorded as far back as 260 B.C. – but in 1610 Galileo was the first to resolve it into individual stars with his newly invented telescope. Enjoy its stellar “swarm” tonight…

Continue on to the lunar surface to explore the very fine appearance of crater Copernicus located about mid-way along the terminator. It is not the largest, the deepest, the oldest, the most bright, nor the most unusual of lunar features – but it definitely holds the record at being the most spectacular!

Tuesday, April 19 – A little more than 35 years ago, the Apollo 13 crew was on a mission to land on the Moon in the Fra Mauro highlands. Although disaster kept them from completion, Apollo 14 carried out the plan a little less than a year later – and tonight we will be able to see this landing area on the lunar surface. Along the terminator to the south, you will see a dark expanse known as Mare Nubium. On its northern shore and nearing the terminator’s center, you will see a inlet of small shallow craters. The brightest of these small rings is crater Parry with Fra Mauro appearing larger and more shallow to its north. Power up! Fra Mauro has a long fissure that runs between its north and south borders. At the northern crater edge you will see the ruins of an ancient impact. Known as X, it definitely marks the spot of this successful lunar landing.

Wednesday, April 20 – Tonight the most prominent lunar feature will be the ancient and graceful Gassendi. Its bright ring stands on the north shore of Mare Humorum – an area about the size of the state of Arkansas. Around 113 km in diameter and 2012 meters deep, you will see a triple mountain peak in its center and the south wall eroded by lava flows. Gassendi offers a wealth of details to telescopic observers on its ridge and rille covered floor.

When you have finished with your lunar observations, let’s travel on to a fascinating double star. A little less than a handspan south of the last star in the handle of the “Big Dipper”, you will see a fairly bright star that is on the edge of unaided eye detection thanks to tonight’s gibbous Moon. Aim your telescopes or steady binoculars there for a real treat! Alpha Canum is more commonly known as Cor Caroli – or the “heart of Charles” – and is a true jewel easily split by the most modest of instruments. Although some observers may not be able to distinguish a color difference between the magnitude 2.8 and 5.6 companions, it has been my experience that most will see a faded blue primary (a magnetic spectrum variable) and pale orange secondary on this 120 light year distant pair. If you are equatorially aligned, turn off the drive and wait for 150 seconds. Widely separated Struve 1702 will be coming into view…

Thursday, April 21 – Tonight’s lunar observing will be a challenging one – worthy of the larger scope. Start by identifying past study craters, Hansteen and Billy. Due west of Hansteen you will find a small crater near the terminator known as Sirsalis. It will appear as a small, dark ellipse with a bright west wall with its twin, Sirsalis B on the edge. The feature you will be looking for is the Sirsalis Rille – the longest presently known. Stretching northeast of Sirsalis and extending for 459 kilometers south to the bright rays of Byrgius, this major “crack” in the lunar surface will show several branches – like a long dry river bed.

Tonight let’s go from one navigational extreme to another as viewers in the northern hemisphere try their hand at Polaris. As guide star for north, Polaris is also a wonderful double with an easily resolved, faint blue companion for the mid-sized telescope. But what about the south? Viewers in the southern hemisphere can never see Polaris – is there a matching star for the south? The answer is yes – Sigma Octantis – but at magnitude 5, it doesn’t make a very good unaided eye guide. Ancient navigators found better success with the constellation of Crux, better known as the “Southern Cross”. While Crux has many wonderful double stars, if southern hemispere viewers would like to see a star very similar to Polaris, then try your luck with Lambda Centauris. The magnitude difference between components and separation are about the same!

Friday, April 22 – Today celebrates the birthday of Sir Harold Jeffreys, who was born in 1891. Jeffreys was an astrogeophysicist and the first person to envision Earth’s fluid core. He also helped in our understanding of tidal friction, general planetary structure, and the origins of our solar system. Start your morning off before dawn with a chance to view the peak of the Lyrid meteor shower. Since the radiant is near Vega, you will improve your chances of spotting them when the constellation of Lyra is as high as possible and the Moon far to the west. This stream comes from parent Comet Thatcher and produces around 15 bright, long-lasting meteors per hour. (UPDATE: The current projected peak time has been upgraded to 10:30 UT.)

But what about later?

The Moon will be very busy tonight… On this universal date it will occult Jupiter in regions across mid-to-south Africa. Since we have many readers from that area, please watch! This IOTA webpage will give you precise universal times for your location. As the Earth turns, a wide swath across the southeast, central and western portions of both North and South America, will enjoy the Moon occulting Eta Viriginis. Be sure to visit this IOTA webpage for a list of universal times in your area.

Saturday, April 23 – Pioneer quantum physicist, Max Planck was born on this day in 1858. In 1900, Max developed the quantum – known as the Planck equation- to explain the shape of blackbody spectra (a function of temperature and wavelength of emission). A “blackbody” is any object that absorbs all incident radiation – regardless of wavelength. For example, a heated metal has blackbody properties because the energy it radiates is thermal. The blackbody spectrum’s shape remains a constant and the peak and height of an emitter can be measured against it – be it cosmic background radiation or our own bodies.

Now, let’s put this knowledge into action. Stars themselves approximate blackbody radiators, because their temperature directly controls the color we see. A prime example of a “hot” star is Alpha Viginis, better known as Spica. Compare its color to the cooler Arcturus… What colors do you see? There are other astronomical delights that radiate like blackbodies over some or all parts of the spectrum as well. You can observe a prime example in a nebulae, such as the M42 in Orion. By examining the radio portion of the spectrum, we find the temperature properly matches that of electrons involved in the process of flourescence. Much like a common household fixture, this process is what produces the visible light we can observe.

Sunday, April 24 – For central and western North America, this would be an excellent morning to set the alarm for the early hours as the Moon undergoes a penumbral eclipse – reaching its deepest at 09:55 UT. The effects of the shading of a penumbral eclipse are not as dramatic as the umbral portion, but it’s still fun! For viewers in Central America and western South America, the event will happen before dawn. Hawaii will catch the action around local midnight, while Australia, New Zealand and Japan will have their opportunity in the early evening.

Just because we have full Moon doesn’t mean we can’t have any fun. Tonight let’s explore the star in the middle of the handle of the “Big Dipper”. Its name is Mizar, but if you have exceptional eyes you may also see its companion Alcor as well! The ancient Arabs used this star as an “eye test” for their warriors – if you could see both components, you were given a horse. The name Mizar and Alcore literally translates to “the horse and rider”. If it’s not clear to you, even the slightest optical aid will separate the two, but a treat is in store for telescope users. Mizar itself is a double star! As the very first to be discovered and photographed, you will enjoy this pair. In the eyepiece, Alcor will appear to the east of Mizar A and B, but look for a faint star in between. It has the very impressive name of Sidus Ludovicianum and was once believed to be a planet.

Until next week? Ask for the Moon – but keep reaching for the stars! Light speed…. ~Tammy Plotner

DART Mission Ends Prematurely

The Demonstration of Autonomous Rendezvous Technology (DART) spacecraft that was successfully launched Friday at 10:25 a.m. PDT from Vandenberg Air Force Base, Calif., experienced an on orbit anomaly late Friday.

After a successful rendezvous, acquisition of the target spacecraft, and approach to within approximately 300 feet, DART placed itself in the retirement phase before completing all planned proximity operations, ending the mission prematurely.

NASA is convening a mishap investigation board to determine the reason for the DART spacecraft anomaly.

A teleconference with DART project managers is scheduled for 11 a.m. PDT. Media who want to participate must register by calling the DART Newsroom at 805/605-3051.

The DART spacecraft was a flight experiment attempting to establish autonomous rendezvous capabilities for the U.S. space program. While previous rendezvous and docking efforts have been piloted by astronauts, the DART spacecraft completed the rendezvous and acquisition with no human intervention, relying on a variety of sensors and analyses to complete these functions.

For more information about DART on the Internet, visit:

http://www.nasa.gov/

Original Source: NASA News Release

Iceberg Smashes Off a Chunk of Antarctica

Maps of Antarctica need to be amended. The long-awaited collision between the vast B-15A iceberg and the landfast Drygalski ice tongue has taken place. This Envisat radar image shows the ice tongue ? large and permanent enough to feature in Antarctic atlases – has come off worst.

An image acquired by Envisat on 15 April 2005 shows that a five-kilometre-long section at the seaward end of Drygalski has broken off following a collision with the drifting B-15A. The iceberg itself appears so far unaffected. With more than half the iceberg still to clear the floating pier of ice, Drygalski may undergo more damage in coming days.

It is an old philosophical paradox: what happens when an irresistible force meets an immovable object? For the past few months, ESA’s Envisat satellite has been watching an answer play out in ice, as the B-15A iceberg converged on the Drygalski ice tongue.

The sheer scale of B-15A is best appreciated from space. The bottle-shaped Antarctic iceberg is around 115 kilometres long, with an area exceeding 2500 square kilometres, making it about as large as the entire country of Luxembourg.

From January the iceberg has been drifting towards, then past, the 70-kilometre-long Drygalski ice tongue in McMurdo Sound on the Ross Sea. In the last month prevailing currents have been slowly edging B-15A along past the northern edge of Drygalski.

Envisat’s Advanced Synthetic Aperture Radar (ASAR) instrument has been monitoring events since the start of the year, gathering the highest frequency weather-independent satellite dataset of this area ever.

Ice in opposition
B-15A is the largest remaining section of the even larger B-15 iceberg that calved from the Ross Ice Shelf in March 2000. Equivalent in size to Jamaica, B-15 had an initial area of 11 655 square kilometres but subsequently broke up into smaller pieces.

Since then, the largest piece – B-15A – has found its way to McMurdo Sound, where its presence has blocked ocean currents and led to a build-up of sea ice. With the Antarctic summer now at an end and in-situ observations therefore limited, the ASAR instrument aboard Envisat becomes even more useful for monitoring changes in polar ice and tracking icebergs.

Its radar signals pass freely through the thickest polar storm clouds or local darkness. And because ASAR is sensitive to surface texture as well as physical and chemical properties, the sensor is extremely sensitive to different types of ice ? for example clearly delineating the older rougher surface of the Drygalski ice tongue and iceberg B15A from the surrounding sea ice pack.

The Drygalski ice tongue is located at the opposite end of McMurdo Sound from the US and New Zealand bases. The long narrow tongue stretches out to sea as an extension of the land-based David Glacier, which flows through coastal mountains of Victoria Land.

Twin-mode ASAR Antarctic observations
Envisat’s ASAR instrument monitors Antarctica in two different modes: Global Monitoring Mode (GMM) provides 400-kilometre swath one-kilometre resolution images, enabling rapid mosaicking of the whole of Antarctica to monitor changes in sea ice extent, ice shelves and iceberg movement.

Wide Swath Mode (WSM) possesses the same swath but with 150-metre resolution for a detailed view of areas of particular interest.

ASAR GMM images are routinely provided to a variety of users including the US National Oceanic and Atmospheric Administration (NOAA) National Ice Centre, responsible for tracking icebergs worldwide.

ASAR imagery is also being used operationally to track icebergs in the Arctic by the Northern View and ICEMON consortia, which provide ice monitoring services as part of the Global Monitoring for Environment and Security (GMES) initiative, jointly backed by ESA and the European Union.

This year also sees the launch of CryoSat, a dedicated ice-watching mission designed to precisely map changes in the thickness of polar ice sheets and floating sea ice.

CryoSat, in connection with regular Envisat ASAR GMM mosaics and SAR interferometry ? a technique used to combine radar images to measure tiny centimetre-scale shifts between acquisitions – should answer the question of whether the kind of ice-shelf calving that gave rise to B-15 and its descendants are a consequence of ice sheet dynamics or other factors.

Together they will provide insight into whether such iceberg calving occurrences are becoming more common, as well as improving our understanding of the relationship between the Earth’s ice cover and the global climate.

Original Source: ESA News Release