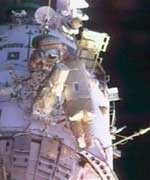
Another Gathering of Planets

Image credit: NASA
It’s happening again: the Moon and a bunch of planets are gathering in the evening sky.

Unlike last month, when five bright planets (including Mercury) were visible, this time there are only four: Venus, Mars, Saturn and Jupiter. Four is plenty, though. Using only your eyes and, if you have one, a small telescope, you’ll be able to see some wondrous things.

The show begins on Thursday, April 22nd. Step outside after nightfall and look west. The first thing you’ll notice is piercing-bright Venus and, not far below it, the delicate crescent Moon. These are the two brightest objects in the night sky, pleasingly close together. Mars is there, too, albeit not much brighter than an ordinary star. You can find it just above Venus, at one vertex of a Moon-Mars-Venus isosceles triangle.

Point a telescope at Venus and ? it looks just like the Moon! Well, almost. Because it lies between Earth and the Sun, Venus has phases just as our Moon does. At the moment Venus is a fat crescent. It’s colored gray-white, very Moon-like, but unlike the Moon, Venus is featureless. Thick uniform clouds hide the planet’s surface; the most powerful telescopes on Earth can’t penetrate them.

The crescent Moon is more fun to look at through a telescope. Low-slanting rays from the sun cast long shadows from lunar mountains. You can see impact craters, valleys and rilles ? all cast into sharp relief.

Can you also see a ghostly glow across the Moon’s dark terrain? For millennia the glow was a mystery, until Leonardo da Vinci figured it out in the 16th century. It is sunlight reflected from Earth onto the Moon. Modern astronomers call the glow Earthshine, and it’s one of the loveliest sights in the heavens–no telescope required.

The triangle shifts on Friday, April 23rd, as the Moon moves past Venus to a spot right beside Mars. This is the best night to find Mars, dim and red, using the Moon as a guidepost. Seen through a telescope Mars is not very impressive, not like it was in August 2003 when the planet made a historic close approach to Earth.

On Saturday, April 24th, the Moon glides away from Mars and toward Saturn, which looks like a bright yellow star. With the Moon beside Saturn to mark its location, you can’t miss it. Point your telescope at Saturn: Even a small ‘scope will show the planet’s lovely rings and it’s biggest moon Titan.

The NASA-ESA Cassini spacecraft is en route to Saturn now, due to arrive in July. Cassini will orbit for four years, studying Saturn’s rings, weather and magnetic field. Cassini will also drop a probe named Huygens through the thick orange clouds of Titan to discover what lies beneath.

Titan is one of the most mysterious worlds in the solar system. It has a nitrogen atmosphere denser than Earth’s and clouds laced with organic compounds. Some researchers believe there might be puddles, lakes or even oceans of liquid hydrocarbons sloshing around on the surface. These are places where organic molecules might get together for the first stirrings of simple life.

Through a backyard telescope Titan looks like an 8th magnitude star, an unremarkable pinprick. In fact, Titan is bigger than Mercury and Pluto. If it orbited the sun it would surely be considered a planet. What do the clouds of Titan hide? It’s something to think about while you’re peering through the eyepiece.

Finally on Thursday, April 29th, the Moon glides by Jupiter. You’ve probably noticed Jupiter before: it hangs almost directly overhead at sunset and outshines everything in the sky except Venus and the Moon. The Moon and Jupiter side by side are a pleasing sight.

Look at Jupiter through a telescope and you’ll see the planet’s rust-colored cloud belts and its four largest moons: Io, Europa, Callisto, and Ganymede. You might also see the Great Red Spot–a hurricane twice as wide as Earth and at least 100 years old. On April 29th it will be crossing Jupiter’s middle (as seen from Earth) at 09:12 p.m. PDT or 04:12 UT on April 30th.

Four planets, six moons, Earthshine, lunar mountains, the phases of Venus, a planet-sized hurricane and Saturn’s rings: Mark your calendar and see them all before April is done.

Original Source: NASA Science Story

Arecibo Gets an Upgrade

Image credit: Cornell
The Arecibo Observatory telescope, the largest and most sensitive single dish radio telescope in the world, is about to get a good deal more sensitive.

Today (Wednesday, April 21) the telescope got a new “eye on the sky” that will turn the huge dish, operated by Cornell University for the National Science Foundation, into the equivalent of a seven-pixel radio camera.

The complex new addition to the Arecibo telescope was hauled 150 meters (492 feet) above the telescope’s 1,000-foot-diameter (305 meters) reflector dish starting in the early morning hours. The device, the size of a washing machine, took 30 minutes to reach a platform inside the suspended Gregorian dome, where ultimately it will be cooled and then connected to a fiber optic transmission system leading to ultra-high speed digital signal processors. The new instrument is called ALFA (for Arecibo L-Band Feed Array) and is essentially a camera for making radio pictures of the sky. ALFA will conduct large-scale sky surveys with unprecedented sensitivity, enabling astronomers to collect data about seven times faster than at present, giving the telescope an even broader appeal to astronomers.

The ALFA receiver was built by the Australian research group, Commonwealth Scientific & Industrial Research Organisation, under contract to the National Astronomy and Ionosphere Center (NAIC) at Cornell, in Ithaca, N.Y. Development of ALFA was overseen by the observatory’s technical staff. The rest of the ALFA system, including ultra-fast data processing machines, are under development at NAIC.

Radio telescopes traditionally have been limited to seeing just one spot — a single pixel — on the sky at once. Pictures of the sky have been built up by painstakingly imaging one spot after another. But ALFA lets the telescope see seven spots — seven pixels — on the sky at once, slashing the time needed to make all-sky surveys. Steve Torchinsky, ALFA project manager at Arecibo Observatory, says the new device will make it possible to find many new fast-spinning, highly dense stars called pulsars and will improve the chances of picking up very rare kinds of systems — for instance, a pulsar orbiting a black hole.

It also will map the neutral hydrogen gas in our galaxy, the Milky Way, as well as in other galaxies. Hydrogen is the most abundant element in the universe. “A whole range of science is planned for ALFA, ” says Torchinsky. “Arecibo’s large collecting area is particularly well-suited to pulsar studies.”

NAIC commissioned CSIRO to build ALFA following the success of a ground-breaking “multibeam” instrument it had designed and built for the Parkes radio telescope in eastern Australia. That instrument increased the Parkes telescope’s view 13-fold, making it practical for the first time to search the whole sky for faint and hidden galaxies.

Original Source: Cornell News Release

Saturn in Four Wavelengths

Image credit: NASA/JPL/Space Science Institute
A montage of Cassini images, taken in four different regions of the electromagnetic spectrum from the ultraviolet to the near-infrared, demonstrates that there is more to Saturn than meets the eye.

The pictures show the effects of absorption and scattering of light at different wavelengths by both atmospheric gas and clouds of differing heights and thicknesses. They also show absorption of light by colored particles mixed with white ammonia clouds in the planet’s atmosphere. Contrast has been enhanced to aid visibility of the atmosphere.

Cassini’s narrow-angle camera took these four images over a period of 20 minutes on April 3, 2004, when the spacecraft was 44.5 million kilometers (27.7 million miles) from the planet. The image scale is approximately 267 kilometers (166 miles) per pixel. All four images show the same face of Saturn.

In the upper left image, Saturn is seen in ultraviolet wavelengths (298 nanometers); at upper right, in visible blue wavelengths (440 nanometers); at lower left, in far red wavelengths just beyond the visible-light spectrum (727 nanometers); and at lower right, in near-infrared wavelengths (930 nanometers).

All gases scatter sunlight efficiently at short wavelengths. That’s why the sky on Earth is blue. The effect is more pronounced in the ultraviolet than in the visible. On Saturn, helium and molecular hydrogen gases scatter ultraviolet light strongly, making the atmosphere appear bright. Only high altitude cloud particles, which tend to absorb ultraviolet light, appear dark against the bright background, explaining the dark equatorial band in the upper left ultraviolet image. The contrast is reversed in the lower left image taken in a spectral region where light is absorbed by methane gas but scattered by high clouds. The equatorial zone in this image is bright because the high clouds there reflect this long wavelength light back to space before much of it can be absorbed by methane.

Scattering by atmospheric gases is less pronounced at visible blue wavelengths than it is in the ultraviolet. Hence, in the top right image, the sunlight can make its way down to deeper cloud layers and back to the observer, and the high equatorial cloud particles, which are reflective at visible wavelengths, also are apparent. This view is closest to what the human eye would see. At bottom right, in the near-infrared, some methane absorption is present but to a much lesser degree than at 727 nanometers. Scientists are not certain whether the contrasts here are produced mainly by colored particles or by latitude differences in altitude and cloud thickness. Data from Cassini should help answer this question.

The sliver of light seen in the northern hemisphere appears bright in the ultraviolet and blue (top images) and is nearly invisible at longer wavelengths (bottom images). The clouds in this part of the northern hemisphere are deep, and sunlight is illuminating only the cloud-free upper atmosphere. The shorter wavelengths are consequently scattered by the gas and make the illuminated atmosphere bright at these wavelengths, while the longer wavelengths are absorbed by methane.

Saturn’s rings also appear noticeably different from image to image, whose exposure times range from two to 46 seconds. The rings appear dark in the 46-second ultraviolet image because they inherently reflect little light at these wavelengths. The differences at other wavelengths are mostly due to the differences in exposure times.

The Cassini-Huygens mission is a cooperative project of NASA, the European Space Agency and the Italian Space Agency. The Jet Propulsion Laboratory, a division of the California Institute of Technology in Pasadena, manages the Cassini-Huygens mission for NASA’s Office of Space Science, Washington, D.C. The Cassini orbiter and its two onboard cameras, were designed, developed and assembled at JPL. The imaging team is based at the Space Science Institute, Boulder, Colorado

For more information about the Cassini-Huygens mission, visit http://saturn.jpl.nasa.gov and the Cassini imaging team home page, http://ciclops.org.

Original Source: CICLOPS News Release

Book Review: Einstein’s Cosmos

Perhaps surprisingly Einstein had a less than spectacular youth. He appeared to be more interested in reading books than developing social skills. He also had his own value system that gave greater weight to substance than imagery. From this he completed his undergraduate work with no money, no support for further education and few friends to start him on a career. Luckily one of them did find him a posting as a government patent officer. As he excelled at analyzing propositions, the work suited him. Of greater benefit was the opportunity he had to freely think about many of the questions that had been perplexing him since his early years. Through discussions with new colleagues and fortuitous circumstances in one year, 1905, he wrote his theories on special relativity, the interchangeability of matter and energy and the quantization of light. With these Einstein finally received support from the scientific community together with a doctorate and a teaching position at a university.

In as much as these theories were ground breaking postulations of their time, Einstein didn’t rest on his laurels. Much of his preceding work had been on the contemplation of light and the electromagnetic effect. Einstein’s conjectures about light were for the most part based in the nether regions of space where there was no effect from gravity. His general theory on relativity brought gravity into perspective by describing it as the bending of space and time. As Einstein was now a full member of the scientific community he instantly got support and tribulations from his colleagues. Though this was and still is the accepted method for evaluating new theories it seemed quite vicious and even somewhat personal. Nevertheless his theory prevailed with much support from a field he was not particularly good at, mathematics. In reviewing Einstein’s work mathematicians corroborated his theories and perhaps more importantly expanded them to encompass other known yet unexplained phenomena.

It was at about this time that Einstein’s fame blossomed. He went on world tours, was greeted by royalty and had the adulation usually reserved for film stars. He even saw his face depicted in stained glass at a church to which he mused, “a jew as a protestant saint?”. Aside from these existential considerations, Einstein was facing more suitable cosmological challenges. For example, if gravity is an attractive force shouldn’t the universe be contracting, eventually leading to a singularity? Einstein with the scientific community tackled this and others. Schwarzschild’s solution to Einstein’s equations led to event horizons and black holes. Mandl brought forward the idea of testing gravity by looking for the lensing of light caused by the mass of stars. These and others put Einstein’s theories to the test and continually they were found up to the task. He was due his fame.

Still Einstein continued. The jewel in the crown so to speak was the unifying theory. That is, a field theory that unified his theory of gravity with Maxwell’s theory of electromagnetism. Unity would bring together the farthest reaches of the cosmos with the smallest concepts of particles in a sensible temporal frame. Much of the last thirty years of Einstein’s life was spent looking for this theory. Mathematics shone as the tool of choice as only it could successfully represent the relations of objects too small and obscure or too large and too powerful. Yet even with this Einstein met his match. As Kaku put it, Einstein was about 50 years ahead of the necessary technology and mathematics to continue making progress.

This book by Kaku is a clean concise summary of Einstein’s activities portrayed against the technical and political challenges of the day. Kaku also discusses recent experiments that have or will provide more proof or insight. The progression from Newtonian thinking of space and time to relativistic thinking admirably describes scientific progress and the rigour to which theories are subject.

In some ways though this book may make you feel like a child in a candy store. There are many referrals to experiments and mathematical properties but no substantiation. If you know the material, the reading is easy, if you don’t you need faith or must investigate elsewhere. Also, the portrayal of Einstein is one sided in that only his positive attributes seem to be mentioned. Everyone has their off days and in adding some of Einstein’s, the portrayal would have been more balanced.

All in all, Einstein’s Cosmos aptly describes Einstein as the amazing person he was who readily deserves the praise of being one of the most influential people of the millennium. As we each age and travel with our planet through space we should take some of the precious time we are granted on Earth to read books like this and perhaps realize a clearer view of where we stand and what we can accomplish.

Buy this book and others from Amazon.com

Review by Mark Mortimer

Wallpaper: Galaxy with a Ring of Star Formation

Image credit: Hubble
Resembling a diamond-encrusted bracelet, a ring of brilliant blue star clusters wraps around the yellowish nucleus of what was once a normal spiral galaxy in this new image from NASA’s Hubble Space Telescope (HST). This image is being released to commemorate the 14th anniversary of Hubble’s launch on April 24, 1990 and its deployment from the space shuttle Discovery on April 25, 1990.

The sparkling blue ring is 150,000 light-years in diameter, making it larger than our entire home galaxy, the Milky Way. The galaxy, cataloged as AM 0644-741, is a member of the class of so- called “ring galaxies.” It lies 300 million light-years away in the direction of the southern constellation Dorado.

Ring galaxies are an especially striking example of how collisions between galaxies can dramatically change their structure, while also triggering the formation of new stars. They arise from a particular type of collision, in which one galaxy (the “intruder”) plunges directly through the disk of another one (the “target”). In the case of AM 0644-741, the galaxy that pierced through the ring galaxy is out of the image but visible in larger-field images. The soft spiral galaxy that is visible to the left of the ring galaxy in the image is a coincidental background galaxy that is not interacting with the ring.

The resulting gravitational shock imparted due to the collision drastically changes the orbits of stars and gas in the target galaxy’s disk, causing them to rush outward, somewhat like ripples in a pond after a large rock has been thrown in. As the ring plows outward into its surroundings, gas clouds collide and are compressed. The clouds can then contract under their own gravity, collapse, and form an abundance of new stars.

The rampant blue star formation explains why the ring is so blue: It is continuously forming massive, young, hot stars, which are blue in color. Another sign of robust star formation is the pink regions along the ring. These are rarefied clouds of glowing hydrogen gas, fluorescing because of the strong ultraviolet light from the newly formed massive stars.

Anyone who lives on planets embedded in the ring would be treated to a view of a brilliant band of blue stars arching across the heavens. The view would be relatively short-lived because theoretical studies indicate that the blue ring will not continue to expand forever. After about 300 million years, it will reach a maximum radius, and then begin to disintegrate.

The Hubble Heritage Team used the Hubble Advanced Camera for Surveys to take this image in January 2004. The team used a combination of four separate filters that isolate blue, green, red, and near-infrared light to create the color image.

The Space Telescope Science Institute (STScI) is operated by the Association of Universities for Research in Astronomy, Inc. (AURA), for NASA, under contract with the Goddard Space Flight Center, Greenbelt, MD. The Hubble Space Telescope is a project of international cooperation between NASA and the European Space Agency (ESA).

Original Source: Hubble News Release

Not Getting the Newsletter?

In theory, I send out Universe Today every weekday (Mon-Fri) some time during the day. I do occasionally miss a day, but for the last year or so, that’s been pretty rare. If you find the newsletter just stops coming, you should be suspicious that your Internet service provider has gotten a little over-zealous in its attempts to block SPAM. This newsletter has images in it, and allows you to unsubscribe – and these are also key features of a lot of unsolicited mail.

So, if Universe Today doesn’t show up in your mailbox, wait a couple of days and then check the website. If the homepage hasn’t been updated, then it means I’m not working on the website… bad Fraser! But if I am being industrious and the homepage is current, that means the newsletter is going out. Time for you to nag your Internet service provider.

Check to see if the email is being dumped into your junk mail folder. It’s got a different name in Hotmail, AOL, Yahoo, etc. If it’s not there, you should have some way make sure that mail from me is never considered SPAM. If that doesn’t seem to be working, you’ll have to contact your ISP through email or on the phone and let them know that you really miss your subscription to Universe Today. Send me an email and I can try and work on them from my end as well.

Thanks!

Fraser Cain
Publisher
Universe Today

P.S. I’ve getting reports from Yahoo folks that the newsletter is being blocked as of April 14th. If anyone knows what happened, please enlighten me so I can fix it.

Are Jupiter’s Spots Disappearing?

Image credit: NASA/JPL
If a University of California, Berkeley, physicist’s vision of Jupiter is correct, the giant planet will be in for a major global temperature shift over the next decade as most of its large vortices disappear.

But fans of the Great Red Spot can rest easy. The most famous of Jupiter’s vortices – which are often compared to Earth’s hurricanes – will stay put, largely because of its location near the planet’s equator, says Philip Marcus, a professor at UC Berkeley’s Department of Mechanical Engineering.

Using whirlpools and eddies for comparison, Marcus bases his forecast on principals learned in junior-level fluid dynamics and on the observation that many of Jupiter’s vortices are literally vanishing into thin air.

“I predict that due to the loss of these atmospheric whirlpools, the average temperature on Jupiter will change by as much as 10 degrees Celsius, getting warmer near the equator and cooler at the poles,” says Marcus. “This global shift in temperature will cause the jet streams to become unstable and thereby spawn new vortices. It’s an event that even backyard astronomers will be able to witness.”

According to Marcus, the imminent changes signal the end of Jupiter’s current 70-year climate cycle. His surprising predictions are published in the April 22 issue of the journal Nature.

Jupiter’s stormy atmosphere has a dozen or so jet streams that travel in alternating directions of east and west, and that can clock speeds greater than 330 miles per hour. As on Earth, vortices on Jupiter that rotate clockwise in the northern hemisphere are considered anticyclones, while those that spin counterclockwise are cyclones. The opposite is true in the southern hemisphere, where clockwise vortices are cyclones and counterclockwise spinners are anticyclones.

The Great Red Spot, located in the southern hemisphere, holds title as Jupiter’s largest anticyclone; spanning 12,500 miles wide, it is large enough to swallow Earth two to three times over.

Unlike the cyclonic storms on Jupiter, Earth’s hurricanes and storms are associated with low-pressure systems and dissipate after days or weeks. The Great Red Spot, in comparison, is a high-pressure system that has been stable for more than 300 years, and shows no signs of slowing down.

About 20 years ago, Marcus developed a computer model showing how the Great Red Spot emerged out of and endured in the chaotic turbulence of Jupiter’s atmosphere. His efforts to explain the dynamics governing it and other vortices on Jupiter led to his current projection of the planet’s impending climate change.

He says the current 70-year cycle began with the formation of three distinct anticyclones – the White Ovals – that developed south of the Great Red Spot in 1939. “The birth of the White Ovals was seen through telescopes on Earth,” he says. “I believe we’re in for a similar treat within the next 10 years.”

Marcus says the first stage of the climate cycle involves the formation of vortex streets which straddle the westward jet streams. Anticyclones form on one side of the street, while cyclones form on the other side, with no two vortices rotating in the same direction directly adjacent to each other.

Most of the vortices slowly decay with turbulence. By stage two of the cycle, some vortices become weak enough to get trapped in the occasional troughs, or Rossby waves, that form in the jet stream. Multiple vortices can get caught in the same trough. When they do, they travel bunched together, and turbulence can easily make them merge. When the vortices are weak, trapping and merging continues until only one pair is left on each vortex street.

The noted disappearance of two White Ovals, one in 1997 or 1998 and a second in 2000, exemplified the merging of the vortices in stage two, and as such, signaled the “beginning of the end” of Jupiter’s current climate cycle, says Marcus.

Why would the merger of vortices affect global temperature? Marcus says the relatively uniform temperature of Jupiter – where the temperatures at the poles are nearly the same as they are at the equator – is due to the chaotic mixing of heat and airflow from the vortices.

“If you knock out a whole row of vortices, you stop all the mixing of heat at that latitude,” says Marcus. “This creates a big wall and prevents the transport of heat from the equator to the poles.”

Once enough vortices are gone, the planet’s atmosphere will warm at the equator and cool at the poles by as much as 10 degrees Celsius in each region, which is stage three of the climate cycle.

This temperature change destabilizes the jet streams, which will react by becoming wavy. The waves steepen and break up, like they do at the beach, but they then roll up into new large vortices in the cycle’s fourth stage. In the fifth and final stage of the climate cycle, the new vortices decrease in size, and they settle into the vortex streets to begin a new cycle.

The weakening of the vortices is due to turbulence and happens gradually over time. It takes about half a century for newly formed vortices to gradually shrink down enough to be caught up in a jet stream trough, says Marcus.

Fortunately, the Great Red Spot’s proximity to the equator saves it from destruction. Unlike Jupiter’s other vortices, the Great Red Spot survives by “eating” its neighboring anticyclones, says Marcus.

Marcus notes that his theory of Jupiter’s climate cycle relies on the existence of a roughly equal number of cyclones and anticyclones on the planet.

Since the telltale signs of vortices are the clouds they create, it was easy to miss the presence of long-lived cyclones, says Marcus. He explains that unlike an anticyclone’s distinct spot, cyclones create patterns of filamentary clouds that are less clearly defined.

“On the face of it, it is easy to think that Jupiter is dominated by anticyclones because their spinning clouds show up clearly as bull’s-eyes,” says Marcus.

In the paper in Nature, Marcus presents a computer simulation showing that the warm center and cooler perimeter of a cyclone creates the appearance of the filamentary clouds. In contrast, anticyclones have cold centers and warmer perimeters. Ice crystals that form in the anticyclone’s center swell up and move to the sides where they melt, creating a darker swirl surrounding a lighter colored center.

Marcus approaches the study of planetary atmospheres from the untraditional viewpoint of a fluid dynamicist. “I’m basing my predictions on the relatively simple laws of vortex dynamics instead of using voluminous amounts of data or complex atmospheric models,” says Marcus.

Marcus says the lesson of Jupiter’s climate could be that small disturbances can cause global changes. However, he cautions against applying the same model to Earth’s climate, which is influenced by many different factors, both natural and manmade.

“Still, it’s important to have different ‘labs’ for climate,” says Marcus. “Studying other worlds helps us better understand our own, even if they are not directly analogous.”

Marcus’s research is supported by grants from the NASA Origins Program, the National Science Foundation Astronomy and Plasma Physics Programs and the Los Alamos National Laboratory.

Original Source: UC Berkeley News Release

Satellites Show How the Earth is Warming Up

Image credit: NASA
Like thermometers in space, satellites are taking the temperature of the Earth’s surface or skin. According to scientists, the satellite data confirm the Earth has had an increasing “fever” for decades.

For the first time, satellites have been used to develop an 18- year record (1981-1998) of global land surface temperatures. The record provides additional proof that Earth’s snow-free land surfaces have, on average, warmed during this time period, according to a NASA study appearing in the March issue of the Bulletin of the American Meteorological Society. The satellite record is more detailed and comprehensive than previously available ground measurements. The satellite data will be necessary to improve climate analyses and computer modeling.

Menglin Jin, the lead author, is a visiting scientist at NASA’s Goddard Space Flight Center, Greenbelt, Md., and a researcher with the University of Maryland, College Park, Md. Jin commented until now global land surface temperatures used in climate change studies were derived from thousands of on-the- ground World Meteorological Organization (WMO) stations located around the world, a relatively sparse set of readings given Earth’s size. These stations actually measure surface air temperature at two to three meters above land, instead of skin temperatures. The satellite skin temperature dataset is a good complement to the traditional ways of measuring temperatures.

A long-term skin temperature data set will be essential to illustrate global as well as regional climate variations. Together with other satellite measurements, such as land cover, cloud, precipitation, and sea surface temperature measurements, researchers can further study the mechanisms responsible for land surface warming.

Furthermore, satellite skin temperatures have global coverage at high resolutions, and are not limited by political boundaries. The study uses Advanced Very High Resolution Radiometer Land Pathfinder data, jointly created by NASA and the National Oceanic and Atmospheric Administration (NOAA) through NASA’s Earth Observing System Program Office. It also uses recently available NASA Moderate Resolution Imaging Spectroradiometer skin temperature measurements, as well as NOAA TIROS Operational Vertical Sounder (TOVS) data for validation purposes. All these data are archived at NASA’s Distributed Active Archive Center.

Inter-annually, the 18-year Pathfinder data in this study showed global average temperature increases of 0.43 Celsius (C) (0.77 Fahrenheit (F)) per decade. By comparison, ground station data (2 meter surface air temperatures) showed a rise of 0.34 C (0.61 F) per decade, and a National Center for Environmental Prediction reanalysis of land surface skin temperature showed a similar trend of increasing temperatures, in this case 0.28 C (0.5 F) per decade. Skin temperatures from TOVS also prove an increasing trend in global land surface temperatures. Regional trends show more temperature variations.

“Although an increasing trend has been observed from the global average, the regional changes can be very different,” Jin said. “While many regions were warming, central continental regions in North America and Asia were actually cooling.”

One issue with the dataset is that it cannot detect surface temperatures over snow. In winter, most of the land areas in the mid to upper latitudes of the Northern Hemisphere are covered by snow. Of Earth’s land area, 90 percent of it is snow free in July, compared to only 65 percent in January. For this reason, the study only focused on snow free areas. Still, in mountainous areas that are hard to monitor, like Tibet, satellites can detect the extent of snow coverage and its variations.

The satellite dataset allows researchers to also look at daily trends on global and regional scales. The largest daily variation was above 35.0 C (63 F) at tropical and sub-tropical desert areas for a July 1988 sample, with decreasing daily ranges towards the poles, in general. Daily changes were also closely related to vegetation cover. The daily skin temperature range showed a decreasing global mean trend over the 18-year period, resulting from greater temperature increases at night compared to daytime.

Things like clouds, volcanic eruptions, and other factors gave false readings of land temperatures, but scientists factored those out to make the skin temperature data more accurate. Scientists are considering extending this 18-year satellite- derived skin temperature record up to 2003. The mission of NASA’s Earth Science Enterprise is to develop a scientific understanding of the Earth system and its response to natural or human-induced changes to enable improved prediction capability for climate, weather, and natural hazards. NASA funded the study.

Original Source: NASA News Release

Gravity Probe B Launches

Image credit: NASA
The NASA space vehicle designed to test two important predictions of Albert Einstein’s Theory of General Relativity launched today from Vandenberg Air Force Base, Calif., aboard a Boeing Delta II expendable launch vehicle.

The spacecraft is being inserted into an almost perfect circular polar orbit around the Earth at an altitude of 400 statute miles. “The solar arrays are deployed, and we have received initial data that indicates all systems are operating smoothly. We are very pleased,” said Gravity Probe B (GP-B) program manager Rex Geveden of NASA’s Marshall Space Flight Center (MSFC), Huntsville, Ala. “The Gravity Probe B space vehicle houses one of the most challenging science instruments ever devised and seeks to answer some of the most important questions about the structure of our universe,” he said.

The GP-B mission will use four ultra-precise gyroscopes to test Einstein’s theory that space and time are distorted by the presence of massive objects. To accomplish this, the mission will measure two factors, how space and time are very slightly warped by the presence of the Earth, and how the Earth’s rotation very slightly drags space-time around with it.

“This is a great moment and a great responsibility, the outcome of a unique collaboration of physicists and engineers to develop this near-perfect instrument to test Einstein’s theory of gravity,” said the experiment’s principal investigator Dr. Francis Everitt of Stanford University in Stanford, Calif. “We are very grateful for all the support we have received at NASA and elsewhere for this exacting effort, truly a new venture in fundamental physics.”

In-orbit checkout and calibration is scheduled to last 60 days, followed by a 12-month science-data acquisition period and a two-month post-science period for calibrations.

During the mission, data from GP-B will be received a minimum of twice daily. Either Earth-based ground stations or NASA’s data relay satellites can receive the information. Controllers will be able to communicate with the orbiting space vehicle from the Mission Operations Center at Stanford University.

Data will include space vehicle and instrument performance, as well as the very precise measurements of the gyroscopes’ spin-axis pointing. By 2005 the GP-B mission will be complete. A one-year period is planned for scientific analysis of the data.

MSFC manages the GP-B program. NASA’s prime contractor for the mission, Stanford University, conceived the experiment and is responsible for the design and integration of the science instrument, as well as for mission operations and data analysis. Lockheed Martin, a major subcontractor, designed, integrated and tested the space vehicle and some of its major payload components. NASA’s Kennedy Space Center and Boeing Expendable Launch Systems were responsible for the pre-launch preparations, countdown and launch of the Delta II.

For information about NASA and agency missions on the Internet, visit:

http://www.nasa.gov/

For information about the GP-B mission on the Internet, visit:

http://einstein.stanford.edu/ and http://www.gravityprobeb.com

Original Source: NASA News Release

Chandra Reveals a Supernova’s Power

Image credit: Chandra
The NASA Chandra X-ray Observatory image of SNR 0540-69.3 clearly shows two aspects of the enormous power released when a massive star explodes. An implosion crushed material into an extremely dense (10 miles in diameter) neutron star, triggering an explosion that sent a shock wave rumbling through space at speeds in excess of 5 million mph.

The image reveals a central intense white blaze of high-energy particles about 3 light years across created by the rapidly rotating neutron star, or pulsar. Surrounding the white blaze is a shell of hot gas 40 light years in diameter that marks the outward progress of the supernova shock wave.

Whirling around 20 times a second, the pulsar is generating power at a rate equivalent to 30,000 Suns. This pulsar is remarkably similar to the famous Crab Nebula pulsar, although they are seen at vastly different distances, 160,000 light years versus 6,000 light years. Both SNR 0540-69.3 and the Crab pulsar rotating rapidly, and are about a thousand years old. Both pulsars are pumping out enormous amounts of X-radiation and high-energy particles, and both are immersed in magnetized clouds of high-energy particles that are a few light years in diameter. Both clouds are luminous X-ray sources, and in both cases the high-energy clouds are surrounded by a filamentary web of cool gas that shows up at optical wavelengths.

However, the extensive outer shell of 50 million degree Celsius gas in SNR 0540-69.3 has no counterpart in the Crab Nebula. This difference is thought to be due to environmental factors. The massive star that exploded to create SNR 0540-69.3 was evidently in a region where there was an appreciable amount of gas. The supernova shock wave swept up and heated the surrounding gas and created the extensive hot X-ray shell. A similar shock wave presumably exists around the Crab Nebula, but the amount of available gas is apparently too small to produce a detectable amount of X-radiation.

Original Source: Chandra News Release