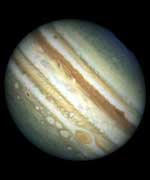
Image credit: NASA/JPL
If a University of California, Berkeley, physicist’s vision of Jupiter is correct, the giant planet will be in for a major global temperature shift over the next decade as most of its large vortices disappear.
But fans of the Great Red Spot can rest easy. The most famous of Jupiter’s vortices – which are often compared to Earth’s hurricanes – will stay put, largely because of its location near the planet’s equator, says Philip Marcus, a professor at UC Berkeley’s Department of Mechanical Engineering.
Using whirlpools and eddies for comparison, Marcus bases his forecast on principals learned in junior-level fluid dynamics and on the observation that many of Jupiter’s vortices are literally vanishing into thin air.
“I predict that due to the loss of these atmospheric whirlpools, the average temperature on Jupiter will change by as much as 10 degrees Celsius, getting warmer near the equator and cooler at the poles,” says Marcus. “This global shift in temperature will cause the jet streams to become unstable and thereby spawn new vortices. It’s an event that even backyard astronomers will be able to witness.”
According to Marcus, the imminent changes signal the end of Jupiter’s current 70-year climate cycle. His surprising predictions are published in the April 22 issue of the journal Nature.
Jupiter’s stormy atmosphere has a dozen or so jet streams that travel in alternating directions of east and west, and that can clock speeds greater than 330 miles per hour. As on Earth, vortices on Jupiter that rotate clockwise in the northern hemisphere are considered anticyclones, while those that spin counterclockwise are cyclones. The opposite is true in the southern hemisphere, where clockwise vortices are cyclones and counterclockwise spinners are anticyclones.
The Great Red Spot, located in the southern hemisphere, holds title as Jupiter’s largest anticyclone; spanning 12,500 miles wide, it is large enough to swallow Earth two to three times over.
Unlike the cyclonic storms on Jupiter, Earth’s hurricanes and storms are associated with low-pressure systems and dissipate after days or weeks. The Great Red Spot, in comparison, is a high-pressure system that has been stable for more than 300 years, and shows no signs of slowing down.
About 20 years ago, Marcus developed a computer model showing how the Great Red Spot emerged out of and endured in the chaotic turbulence of Jupiter’s atmosphere. His efforts to explain the dynamics governing it and other vortices on Jupiter led to his current projection of the planet’s impending climate change.
He says the current 70-year cycle began with the formation of three distinct anticyclones – the White Ovals – that developed south of the Great Red Spot in 1939. “The birth of the White Ovals was seen through telescopes on Earth,” he says. “I believe we’re in for a similar treat within the next 10 years.”
Marcus says the first stage of the climate cycle involves the formation of vortex streets which straddle the westward jet streams. Anticyclones form on one side of the street, while cyclones form on the other side, with no two vortices rotating in the same direction directly adjacent to each other.
Most of the vortices slowly decay with turbulence. By stage two of the cycle, some vortices become weak enough to get trapped in the occasional troughs, or Rossby waves, that form in the jet stream. Multiple vortices can get caught in the same trough. When they do, they travel bunched together, and turbulence can easily make them merge. When the vortices are weak, trapping and merging continues until only one pair is left on each vortex street.
The noted disappearance of two White Ovals, one in 1997 or 1998 and a second in 2000, exemplified the merging of the vortices in stage two, and as such, signaled the “beginning of the end” of Jupiter’s current climate cycle, says Marcus.
Why would the merger of vortices affect global temperature? Marcus says the relatively uniform temperature of Jupiter – where the temperatures at the poles are nearly the same as they are at the equator – is due to the chaotic mixing of heat and airflow from the vortices.
“If you knock out a whole row of vortices, you stop all the mixing of heat at that latitude,” says Marcus. “This creates a big wall and prevents the transport of heat from the equator to the poles.”
Once enough vortices are gone, the planet’s atmosphere will warm at the equator and cool at the poles by as much as 10 degrees Celsius in each region, which is stage three of the climate cycle.
This temperature change destabilizes the jet streams, which will react by becoming wavy. The waves steepen and break up, like they do at the beach, but they then roll up into new large vortices in the cycle’s fourth stage. In the fifth and final stage of the climate cycle, the new vortices decrease in size, and they settle into the vortex streets to begin a new cycle.
The weakening of the vortices is due to turbulence and happens gradually over time. It takes about half a century for newly formed vortices to gradually shrink down enough to be caught up in a jet stream trough, says Marcus.
Fortunately, the Great Red Spot’s proximity to the equator saves it from destruction. Unlike Jupiter’s other vortices, the Great Red Spot survives by “eating” its neighboring anticyclones, says Marcus.
Marcus notes that his theory of Jupiter’s climate cycle relies on the existence of a roughly equal number of cyclones and anticyclones on the planet.
Since the telltale signs of vortices are the clouds they create, it was easy to miss the presence of long-lived cyclones, says Marcus. He explains that unlike an anticyclone’s distinct spot, cyclones create patterns of filamentary clouds that are less clearly defined.
“On the face of it, it is easy to think that Jupiter is dominated by anticyclones because their spinning clouds show up clearly as bull’s-eyes,” says Marcus.
In the paper in Nature, Marcus presents a computer simulation showing that the warm center and cooler perimeter of a cyclone creates the appearance of the filamentary clouds. In contrast, anticyclones have cold centers and warmer perimeters. Ice crystals that form in the anticyclone’s center swell up and move to the sides where they melt, creating a darker swirl surrounding a lighter colored center.
Marcus approaches the study of planetary atmospheres from the untraditional viewpoint of a fluid dynamicist. “I’m basing my predictions on the relatively simple laws of vortex dynamics instead of using voluminous amounts of data or complex atmospheric models,” says Marcus.
Marcus says the lesson of Jupiter’s climate could be that small disturbances can cause global changes. However, he cautions against applying the same model to Earth’s climate, which is influenced by many different factors, both natural and manmade.
“Still, it’s important to have different ‘labs’ for climate,” says Marcus. “Studying other worlds helps us better understand our own, even if they are not directly analogous.”
Marcus’s research is supported by grants from the NASA Origins Program, the National Science Foundation Astronomy and Plasma Physics Programs and the Los Alamos National Laboratory.
Original Source: UC Berkeley News Release