A team of amateur rocket builders accomplished a major feat this week; the first privately built rocket to reach the edge of space. The 6.5-metre (21 foot) unmanned rocket blasted off from its Nevada launch pad, and reached a speed of 6500 km/h (4000 m/h) in only 9 seconds. Based on this velocity, the Civilian Space Exploration Team (CSXT) calculated that it would have reached the official edge of space at 100 km (62.5 m). The CSXT team has detected the rocket’s landing telemetry information, but hasn’t been able to locate it on the ground yet.
Chandra Furthers Understanding About Dark Energy
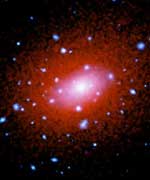
Image credit: Chandra
Dark energy. Does it exist, and what are its properties? Using galaxy-cluster images from NASA’s Chandra X-ray Observatory, astronomers have applied a powerful, new method for detecting and probing dark energy. The results offer intriguing clues about the nature of dark energy and the fate of the Universe. The Marshall Center manages the Chandra program.
Photo: Composite image of the galaxy cluster Abell 2029 (Optical: NOAO/Kitt Peak/J.Uson, D.Dale; X-ray: NASA/CXC/IoA/S.Allen et al.)
Astronomers have detected and probed dark energy by applying a powerful, new method that uses images of galaxy clusters made by NASA’s Chandra X-ray Observatory. The results trace the transition of the expansion of the Universe from a decelerating to an accelerating phase several billion years ago, and give intriguing clues about the nature of dark energy and the fate of the Universe.
“Dark energy is perhaps the biggest mystery in physics,” said Steve Allen of the Institute of Astronomy (IoA) at the University of Cambridge in England, and leader of the study. “As such, it is extremely important to make an independent test of its existence and properties.”
Allen and his colleagues used Chandra to study 26 clusters of galaxies at distances corresponding to light travel times of between one and eight billion years. These data span the time when the Universe slowed from its original expansion, before speeding up again because of the repulsive effect of dark energy.
“We’re directly seeing that the expansion of the Universe is accelerating by measuring the distances to these galaxy clusters,” said Andy Fabian also of the IoA, a co-author on the study. The new Chandra results suggest that the dark energy density does not change quickly with time and may even be constant, consistent with the “cosmological constant” concept first introduced by Albert Einstein. If so, the Universe is expected to continue expanding forever, so that in many billions of years only a tiny fraction of the known galaxies will be observable.
If the dark energy density is constant, more dramatic fates for the Universe would be avoided. These include the “Big Rip,” where dark energy increases until galaxies, stars, planets and eventually atoms are eventually torn apart. The “Big Crunch,” where the Universe eventually collapses on itself, would also be ruled out.
Chandra’s probe of dark energy relies on the unique ability of X-ray observations to detect and study the hot gas in galaxy clusters. From these data, the ratio of the mass of the hot gas and the mass of the dark matter in a cluster can be determined. The observed values of the gas fraction depend on the assumed distance to the cluster, which in turn depends on the curvature of space and the amount of dark energy in the universe.
Because galaxy clusters are so large, they are thought to represent a fair sample of the matter content in the universe. If so, then relative amounts of hot gas and dark matter should be the same for every cluster. Using this assumption, Allen and colleagues adjusted the distance scale to determine which one fit the data best. These distances show that the expansion of the Universe was first decelerating and then began to accelerate about six billion years ago.
Chandra’s observations agree with supernova results including those from the Hubble Space Telescope (HST), which first showed dark energy’s effect on the acceleration of the Universe. Chandra’s results are completely independent of the supernova technique – both in wavelength and the objects observed. Such independent verification is a cornerstone of science. In this case it helps to dispel any remaining doubts that the supernova technique is flawed.
“Our Chandra method has nothing to do with other techniques, so they’re definitely not comparing notes, so to speak,” said Robert Schmidt of University of Potsdam in Germany, another coauthor on the study.
Better limits on the amount of dark energy and how it varies with time are obtained by combining the X-ray results with data from NASA’s Wilkinson Microwave Anisotropy Probe (WMAP), which used observations of the cosmic microwave background radiation to discover evidence for dark energy in the very early Universe. Using the combined data, Allen and his colleagues found that dark energy makes up about 75% of the Universe, dark matter about 21%, and visible matter about 4%.
Allen and his colleagues stress that the uncertainties in the measurements are such that the data are consistent with dark energy having a constant value. The present Chandra data do, however, allow for the possibility that the dark energy density is increasing with time. More detailed studies with Chandra, HST, WMAP and with the future mission Constellation-X should provide much more precise constraints on dark energy.
“Until we better understand cosmic acceleration and the nature of the dark energy we cannot hope to understand the destiny of the Universe,” said independent commentator Michael Turner, of the University of Chicago.
The team conducting the research also included Harald Ebeling of the University of Hawaii and the late Leon van Speybroeck of the Harvard-Smithsonian Center for Astrophysics. These results will appear in an upcoming issue of the Monthly Notices of the Royal Astronomy Society.
NASA’s Marshall Space Flight Center, Huntsville, Ala., manages the Chandra program for NASA’s Office of Space Science, Washington. Northrop Grumman of Redondo Beach, Calif., formerly TRW, Inc., was the prime development contractor for the observatory. The Smithsonian Astrophysical Observatory controls science and flight operations from the Chandra X-ray Center in Cambridge, Mass.
Additional information and images are available at:
http://chandra.harvard.edu/
and
http://chandra.nasa.gov/
Original Source: NASA News Release
New Photo of Comet NEAT
Astrophotographer John Chumack sent in this image of Comet Neat which he took last night. He used a Canon 10D digital SLR and 4″ F8 refractor telescope, ISO 400, 9 minute exposure. If you want to see the comet for yourself, just head outside and look to the West. It’s a fuzzy blur that you can just make out with the unaided eye, even in the city. You can make it out much better with a pair of binoculars. Skymaps.com has conveniently put positions of Comet’s NEAT and LINEAR for the month of May in its current sky chart, so head there and grab a free map to help you orient yourself. Get some friends and make an evening of it.
Good luck!
Fraser Cain
Publisher
Universe Today
Book Review: Gorgon

Peter Ward cut his teeth, so to speak, on a more recent mass extinction. This event was the Cretaceous-Tertiary or K/T mass extinction about 65 million years ago that saw the end of the dinosaurs and many of their co-habitants. Fortunately for people, it also paved the way for the dominance of mammals. The quest that drove Peter and other paleontologists was to find the reason for the mass extinction. After extensive investigation of the K/T boundary, the cause was ruled not to be a long, gradual climate change but a brief flash due to an asteroid hitting at Chicxulub in the Yucatan peninsula of Mexico. Peter’s own findings supported the final conclusion but seeing as it was a conclusion, Peter was left without a future target for his personal challenge.
The end of the Permian period was similar to the end of the Cretaceous period as each ended with a mass extinction. However, the Permian period was a more complete extinction and, as it occurred hundreds of millions of years beforehand, there was a lot less material to substantiate either a cause or a process. Peter fortuitously began studying this event. Over the ensuing twenty years, he experienced both political extremes in the pre and post apartheid and environmental extremes as he traversed the back country called the Karoo. He discovered much about the mass extinction and much about himself.
The lands of the Karoo do not give up their secrets easily. Though effectively a desert region, its temperature ranges from below freezing to well above 40 Celsius. Sunstroke and frostbite were equally possible. Ticks were incessant and could in one bite lead to a painful and fateful end. Puff adders and Cape cobras abounded. Clean water didn’t. Restaurants and hotels were few and far between and of limited quality. In spite of the hardships, or perhaps because of them, many every day visions took on a greater grandeur. Night skis were a crystal clear panoply of stars, galaxies and light shows. Rivers had recuperative powers better than any pharmaceutical pill. And, of course, the sighting of a fossil made the rigour of many a hard day melt away. The Karoo had the evidence needed to help explain the Permian boundary extinction but it did so grudgingly.
Being a paleontologists, as is Peter, gives perhaps a somewhat unique perspective of today’s events on Earth. Some claim that the Earth at this moment is experiencing another mass extinction. However, this time it is not due to celestial strikes but through the actions of a singular species, humans. Humanity is causing the loss of species at a rate ten times faster than at any time since the last mass extinction. In addition, with its alteration to the Earth’s environment, especially the atmosphere, many of the indicators for the start of a mass extinction are again present. Further, if a large extinction occurs, then with the human caused reduction in biodiversity, the Earth may again need tens of millions of years to achieve a full set of complex life forms. Peter raises such perspectives and in so doing easily justifies the time and effort spent examining an event hundreds of millions of years old.
This backward look in time is equally exciting for space enthusiasts. NASA itself is funding significant investigations into the Earth’s mass extinctions and the beginnings of life. The definition of life and its constituent matters may seem complete but seeing new life forms at undersea volcanoes or kilometres deep in granite lends credence to the belief that life can exist elsewhere than Earth. Further, the study of mass extinctions can lead to the definition of the processes of evolution as well as ecosystem dependencies. From this, conjecture can be raised about the effects of the loss of species and phyla, as well as the effects of another asteroid striking Earth. Such scenarios easily give NASA greater support to develop lunar bases and space travel.
After reading this book, you will discard any romantic notions you may have had about being a fossil hunter. Peter clearly describes days of sweat, years of poor pay and few occasions of reward. His personal vindications allow a reader to feel the warmth of comradery, the joys of mystery meat on pizza and the satisfaction of contributing to scientific knowledge. As much as this book reinforces a career choice other than a paleontologist, I’m glad there are people like Peter who do this work and are able to write a book for a non-practitioner to enjoy.
Yet, though I’m not a paleontologist, I would have liked a clearer description of the events and surroundings being investigated. There is a flourish that waxes about the vast expanse of life before the Permian mass extinction and the lack thereafter, but there is little detail. Also, reference is made to activities and researchers elsewhere, but these seem more of an add on than part of the narrative. Peter includes more of his feelings than details of his work, which may please or discourage the reader.
The Gorgonopsian was a predator from the Permian period. It became extinct along with about 95 percent of its fellow inhabitants on Earth at the end of this period. Peter Ward, in his book Gorgon, describes his personal challenges and successes in prying the secrets of fossils from the back country of South Africa. In reading this book, you can easily end up wondering about the huge expanse of lives and events that have gone before us, wondering about current and past politics or just wondering about what drives people to do the things they do.
You can also read a review of Ward’s previous book, The Life and Death of Planet Earth here on Universe Today.
Read more reviews, or buy a copy online from Amazon.com.
Review by Mark Mortimer
New Satellite to Assess the Health of the Earth’s Atmosphere
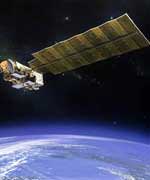
Image credit: NASA/JPL
On June 19, NASA will launch Aura, a next generation Earth- observing satellite. Aura will supply the best information yet about the health of Earth’s atmosphere.
Aura will help scientists understand how atmospheric composition affects and responds to Earth’s changing climate. The satellite will help reveal the processes that connect local and global air quality. It will also track the extent to which Earth’s protective ozone layer is recovering.
Aura will carry four instruments designed to survey different aspects of Earth’s atmosphere. The instruments will provide an unprecedented and complete picture of the composition of the atmosphere. Aura will survey the atmosphere from the troposphere, where mankind lives, through the stratosphere, where the ozone layer resides and protects life on Earth.
Aura’s space-based view of the atmosphere and its chemistry will complete the first series of NASA’s Earth Observing System satellites. The other satellites are Terra, which monitors land; and Aqua, which observes Earth’s water cycle.
“Gaining this global view of Earth will certainly reap new scientific discoveries that will serve as essential stepping stones to our further exploration of the Moon, Mars and beyond, the basis of the Vision for Space Exploration,” NASA Administrator Sean O’Keefe said.
Aura will help answer key scientific questions, including whether the ozone layer is recovering. Aura data may prove useful in determining the effectiveness of international agreements that banned ozone-depleting chemicals like chlorofluorocarbons (CFCs).
Aura will accurately detect global levels of CFCs and their byproducts, chlorine and bromine, which destroy ozone. Aura will also track the sources and processes controlling global and regional air quality. It will help distinguish between natural and human-caused sources of these gases. When ozone exists in the troposphere, it acts as an air pollutant. Tropospheric ozone is linked to high levels of precursors such as nitrogen dioxide, carbon monoxide and volatile hydrocarbons. Aura will help scientists follow the sources of tropospheric ozone and its precursors.
“Aura, the first comprehensive laboratory in space to help us better understand the chemistry and composition of the Earth’s atmosphere, is fundamentally a mission to understand and protect the very air we breathe, ” said NASA Associate Administrator for Earth Science Dr. Ghassem Asrar. “It is also a perfect complement to our other Earth Observing System satellites that, together, will aid our nation and our neighbors by determining the extent, causes, and regional consequences of global change.”
As the composition of Earth’s atmosphere changes, so does its ability to absorb, reflect and retain solar energy. Greenhouse gases, including water vapor, trap heat in the atmosphere. Airborne aerosols from human and natural sources absorb or reflect solar energy based on color, shape, size and substance. The impact of aerosols, tropospheric ozone and upper tropospheric water vapor on Earth’s climate remains largely unquantified. Aura’s ability to monitor these agents will help unravel some of their mystery.
Aura’s four instruments, the High Resolution Dynamics Limb Sounder; the Microwave Limb Sounder; the Ozone Monitoring Instrument; and the Tropospheric Emission Spectrometer will work together to provide measurements in the troposphere and stratosphere to help answer important climate questions.
The High Resolution Dynamics Limb Sounder was built by the United Kingdom and the United States. The Ozone Monitoring Instrument was built by the Netherlands and Finland in collaboration with NASA. NASA’s Jet Propulsion Laboratory, Pasadena, Calif., constructed the Tropospheric Emission Spectromer and Microwave Limb Sounder. NASA’s Goddard Space Flight Center, Greenbelt, Md., manages the Aura mission.
NASA’s Earth Science Enterprise is dedicated to understanding the Earth as an integrated system and applying Earth System Science to improve prediction of climate, weather, and natural hazards using the unique vantage point of space.
Original Source: NASA News Release
Faking Titan in the Lab
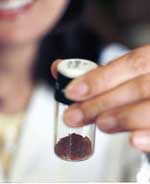
Image credit: UA
While the Cassini spacecraft has been flying toward Saturn, chemists on Earth have been making plastic pollution like that raining through the atmosphere of Saturn’s moon, Titan.
Scientists suspect that organic solids have been falling from Titan’s sky for billions of years and might be compounds that set the stage for the next chemical step toward life. They collaborate in University of Arizona laboratory experiments that will help Cassini scientists interpret Titan data and plan a future mission that would deploy an organic chemistry lab to Titan’s surface.
Chemists in Mark A. Smith’s laboratory at the University of Arizona create compounds like those condensing from Titan’s sky by bombarding an analog of Titan’s atmosphere with electrons. This produces “tholins” ? organic polymers (plastics) found in Titan’s upper nitrogen-methane atmosphere. Titan’s tholins are created by ultraviolet sunlight and electrons streaming out from Saturn’s magnetic field.
Tholins must dissolve to produce amino acids that are the basic building blocks of life. But chemists know that tholins won’t dissolve in Titan’s ethane/methane lakes or oceans.
However, they readily dissolve in water or ammonia. And experiments done 20 years ago show that dissolving tholins in liquid water produces amino acids. So given liquid water, there may be amino acids brewing in Titan’s version of primordial soup.
Oxygen is the other essential for life on Earth. But there is almost no oxygen in Titan?s atmosphere.
Last year, however, Caitlin Griffith, of UA?s Lunar and Planetary Laboratory, discovered water ice on Titan?s surface. (See Titan Reveals a Surface Dominated by Icy Bedrock.) UA planetary scientist Jonathan Lunine and others theorize that when volcanoes erupt on Titan, some of this ice could melt and flow across the landscape. Similar flows could result when comets and asteroids slam into Titan.
Better still, Titan?s water may not immediately freeze because it’s probably laced with enough ammonia (antifreeze) to remain liquid for about 1,000 years, Smith and Lunine noted in a research paper published in last November’s issue of “Astrobiology.”
So although Titan is extremely cold — about 94 degrees kelvin (minus 180 degrees Celsius or minus 300 degrees Fahrenheit) — water may briefly flow across the surface, supplying oxygen and a medium for chemistry, they conclude.
To further understand how all this might work together, Smith’s group is generating tholins in the lab, analyzing their spectroscopic properties, and trying to understand their chemistry.
?We?re trying to learn how the compounds will react with molten water on Titan?s surface, what compounds they?ll make, and, therefore, what we should really be looking for,” Smith explained. “We?re not just looking for atmospheric plastic sitting on the surface, but the result of time and energy input over billions of years.
“We want to know what sorts of molecules have evolved, and whether they’ve evolved along pathways that might provide insights into how biological molecules developed on primordial Earth,? he said.
Mark A. Smith, professor and head of UA’s chemistry department
?Some of what we?ve learned so far in our experiments is that these materials are gross mixtures of incredibly complex molecules,? Smith added. ?Carl Sagan spent the last 10 years of his life studying these compounds in experiments like ours. What we?ve found complements his work. We see the same spectroscopic signatures.”
But Smith’s group also has found that there is a component of these molecules that is very reactive and could easily, within a reasonable time frame, react on the surface of Titan to yield oxygenated compounds.
“And that?s what we?re just starting to unravel now,? Smith said.
?Our work will get much more interesting this fall, in our experiments at the Advanced Light Source of the Lawrence Berkeley Lab,” he added. “We?ll be using a synchrotron to create tholins photochemically, using very energetic photons to break up this Titan gas by vacuum ultraviolet radiation.?
Vacuum ultraviolet radiation hits nitrogen and methane molecules in Titan’s upper atmosphere and blasts them apart. Scientists don’t know if this produces the same kinds of polymers that are formed from an electrical discharge.
?When you can crack nitrogen and methane molecules with light, you might get polymers similar to those formed when an electrical discharge cracks them apart,” Smith said. “Or you may get different polymers. The chemistry is quite complex, and we just don’t know the answers to so many of the simplest questions. But that’s one of the reasons we’ll conduct the experiments at Berkeley.?
The work going on in Smith’s lab is important to scientists on NASA’s Cassini Mission and possible follow-up missions to Saturn. The Cassini orbiter was launched in 1997 and is to launch a probe into Titan’s atmosphere in December. This Huygens probe will float to Titan’s surface next January.
?Titan?s thick orange aerosol haze layer is basically a bunch of organic plastics ? polymers of carbon, hydrogen and nitrogen,” said Smith, head of UA’s chemistry department. “The particulates eventually settle on Titan?s surface, where they produce the organic feedstock for any organic chemistry going on.”
Cassini’s Huygens probe will be the first instrument to actually sample this aerosol. It will give scientists some rudimentary chemical information on this material. But the probe won’t tell them much about organic chemistry at Titan’s surface.
A follow-up mission to Titan that includes a robotic organic chemistry laboratory will give scientists a much more detailed look at the surface. The experiment is being designed by Lunine and Smith in collaboration with researchers from Caltech and NASA’s Jet Propulsion Laboratory.
Lunine leads NASA?s Astrobiology Institute focus group on Titan and is one of three interdisciplinary Cassini mission scientists for the Huygens probe.
?We don?t really know how life formed on the Earth, or on whatever planet it formed,? Lunine said. ?There are no traces left of how it happened on Earth, because all of Earth?s organic molecules have been processed biochemically by now. Titan is our best chance to study organic chemistry in a planetary environment that has remained lifeless over billions of years.?
Original Source: UA News Release
Venus Transit on June 8
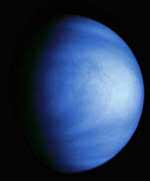
Image credit: NASA/JPL
On Tuesday 8 June, observers throughout Europe, as well as most of Asia and Africa, will be able to witness a very rare astronomical phenomenon when the planet Venus lines up directly between Earth and the Sun. Seen as a small black disk against the bright Sun, Venus will take about 6 hours to complete its crossing of the Sun’s face – known as a ‘transit’. The whole event is visible from the UK, weather permitting.
The last transit of Venus took place on 6 December 1882, but the last one that could have been seen in its entirety from the UK, as on this occasion, was in 1283 (when no one knew it was happening) and the next will not be until 2247! (The transit of 6 June 2012 will not be visible from the UK). The first transit of Venus to be observed was on 24 November 1639 (Julian Calendar). Transits also occurred in 1761, 1769 and 1874.
Venus and Mercury both orbit the Sun closer than Earth. Both planets regularly line up roughly between Earth and the Sun (called ‘conjunction’) but on most occasions they pass above or below the disc of the Sun from our point of view. Since 1631, transits of Venus have been occurring at intervals of 8, 121.5, 8 then 105.5 years and this pattern will continue until the year 2984. Transits of Mercury are more common; there are 13 or 14 each century, the next being in November 2006.
WHEN AND WHERE
The Venus transit of 8 June begins shortly after sunrise at about 6.20 BST, when the Sun will be about 12 degrees above the eastern horizon. It will take about 20 minutes from ‘first contact’ until the planet is fully silhouetted against the Sun, roughly at the ‘8 o’clock’ position’. It will then cut a diagonal path across the southern part of the Sun. Mid-transit is at about 9.22 BST. Venus begins to leave the Sun near the ‘5 o’clock’ position at about 12.04 BST and the transit will be completely over around 12.24. Timings differ by a few seconds for different latitudes, but clouds permitting, the transit will be visible from any place where the Sun is up, including the whole of the UK and almost all of Europe.
For a diagram of Venus’s track across the Sun, see:
http://sunearth.gsfc.nasa.gov/eclipse/OH/tran/Transit2004-2a.GIF (hi-res)
http://sunearth.gsfc.nasa.gov/eclipse/OH/tran/Transit2004-2b.GIF (low-res)
http://www.transit-of-venus.org.uk/transit.htm
For map showing where transit is visible, see:
http://sunearth.gsfc.nasa.gov/eclipse/OH/tran/Transit2004-1b.GIF
HOW TO VIEW
Venus is large enough to be just visible to someone with normal eyesight without the help of binoculars or a telescope. Its diameter will appear about 1/32 the diameter of the Sun. However, NO ONE SHOULD EVER LOOK DIRECTLY AT THE SUN, WITH OR WITHOUT A TELESCOPE OR BINOCULARS WITHOUT USING A SAFE SOLAR FILTER. TO DO SO IS VERY DANGEROUS AND IS LIKELY TO RESULT IN PERMANENT BLINDNESS.
For safe viewing of the transit, much the same rules apply as those for observing an eclipse of the Sun. Eclipse viewers can be used (as long as they are undamaged), and observing is limited to a few minutes at a time. (Note that they must NOT be used with binoculars or a telescope.) For an enlarged view, an image of the Sun can be projected onto a screen by a small telescope. Pinhole projection, however, will not produce a sharp enough image to show Venus clearly.
More detailed information on safety from:
http://sunearth.gsfc.nasa.gov/eclipse/SEhelp/safety2.html
http://www.transit-of-venus.org.uk/safety.htm
IMPORTANCE OF THE TRANSIT
In the 18th and 19th centuries, transits of Venus presented rare opportunities to tackle a fundamental problem – finding an accurate value for the distance between Earth and the Sun. The unit astronomers use for distance measurements in the solar system is based closely on its average value and is called the astronomical unit (AU). It is approximately 93 million miles, or 150 million km.
In the end, though observations of transits produced rough answers, they were never as accurate as originally hoped (see more on this below). But the quest was the stimulus for unprecedented international scientific cooperation and for expeditions that produced discoveries far beyond their original intended scope. Today, distances in the solar system are known with great precision through very different means.
In the 21st century, the main interest in the transits of Venus of 2004 and 2012 is their rarity as astronomical phenomena, the educational opportunities they present, and the sense of a link with important events in scientific and world history.
However, astronomers are now particularly interested in the general principle of planet transits as a way of hunting for extrasolar planetary systems. When a planet crosses in front of its parent star, there is a minute dip in the star’s apparent brightness. Identifying such dips will be a useful method of finding planets orbiting other stars. Some astronomers intend to use the transit of Venus as a test to help design searches for extrasolar planets.
The transit will be observed by two solar observatories in space: TRACE and SOHO. From where SOHO is positioned, it will not see a transit across the visible disc of the Sun, but it will observe Venus’s passage across the Sun’s corona (its outer atmosphere).
VENUS TRANSITS OF THE PAST
The first person to predict a transit of Venus was Johannes Kepler, who calculated that one would take place on 6 December 1631, just a month after a transit of Mercury on 7 November. Though the transit of Mercury was observed, the transit of Venus was not visible from Europe and there is no record of anyone seeing it. Kepler himself died in 1630.
Jeremiah Horrocks (also spelled Horrox), a young English astronomer, studied Kepler’s planetary tables and discovered with just a month to go that a transit of Venus would occur on 24 November 1639. Horrocks observed part of the transit from his home at Much Hoole, near Preston, Lancashire. His friend William Crabtree also saw it from Manchester, having been alerted by Horrocks. As far as is known, they were the only people to witness the transit. Tragically, Horrocks’s promising scientific career was cut short when he died in 1641, aged about 22.
Edmond Halley (of comet fame) realised that observations of transits of Venus could in principle be used to find how far the Sun is from Earth. This was a major problem in astronomy at the time. The method involved observing and timing a transit from widely spaced latitudes from where Venus’s track across the Sun would appear slightly different. Halley died in 1742, but the transits of 1761 and 1769 were observed from many places around the world. Captain James Cook’s expedition to Tahiti in 1769 is one of the most famous and went on to become a world voyage of discovery. However, results on the Sun-Earth distance were disappointing. The observations were plagued by many technical difficulties.
Nevertheless, 105 years later, optimistic astronomers tried again. The results were equally disappointing and people began to realise that the practical problems with Halley’s simple idea were just too great to overcome. Even so, by the 1882 tr ansit, there was enormous public interest and it was mentioned on the front page of most newspapers. Thousands of ordinary people saw it for themselves.
In his 1885 book, “The Story of Astronomy” Professor Sir Robert Stawell Ball described his own feelings on watching the transit 3 years earlier:
“… To have seen even a part of a transit of Venus is an event to remember for a lifetime, and we felt more delight than can be easily expressed… Before the phenomenon had ceased, I spared a few minutes from the somewhat mechanical work at the micrometer to take a view of the transit in the more picturesque form which the large field of the finder presents. The sun was already beginning to put on the ruddy hues of sunset, and there, far in on its face, was the sharp, round, black disk of Venus. It was then easy to sympathize with the supreme joy of Horrocks, when, in 1639, he for the first time witnessed this spectacle. The intrinsic interest of the phenomenon, its rarity, the fulfilment of the prediction, the noble problem which the transit of Venus helps us to solve, are all present to our thoughts when we look at this pleasing picture, a repetition of which will not occur again until the flowers are blooming in the June of A.D. 2004.”
For an excellent historical summary, see:
THE FAMOUS ‘BLACK DROP’ PROBLEM
One of the chief problems visual observers of transits faced was pinpointing the exact time when Venus was first fully on the visible face of the Sun. Astronomers call this point ‘second contact’. In practice, as Venus crossed onto the Sun, its black disc seemed to remain linked to the edge of the Sun for a short time by a dark neck, making it appear almost pear-shaped. The same happened in reverse when Venus began to leave the Sun. This so-called ‘black drop effect’ was the main reasons why timing the transits failed to produce consistent accurate results for the Sun-Earth distance. Halley expected second contact could be timed to within about a second. The black drop reduced the accuracy of timing to more like a minute.
The black drop effect is often mistakenly attributed to Venus’s atmosphere but Glenn Schneider, Jay Pasachoff and Leon Golub showed last year that the problem is due to a combination of two effects. One is the image blurring that naturally takes place when a telescope is used (described technically as ‘the point spread function’). The other is the way the brightness of the Sun diminishes close to its visible ‘edge’ (known to astronomers as ‘limb darkening’).
More experiments will be done on this phenomenon at the 8 June transit of Venus using the TRACE solar observatory in space.
VENUS – THE PLANETARY EQUIVALENT TO HELL.
At first glance, if Earth had a twin, it would be Venus. The two planets are similar in size, mass and composition, and both reside in the inner part of the Solar System. Indeed, Venus comes closer to Earth than any of the other planets.
Before the advent of the Space Age, astronomers could only speculate over the nature of its hidden surface. Some thought that Venus might be a tropical paradise, covered in forests or oceans. Others believed that it was a totally barren, arid desert. After investigations by numerous American and Russian spacecraft, we now know that Earth’s planetary neighbour is the most hellish, hostile world imaginable. Any astronaut unlucky enough to land there would be simultaneously crushed, roasted, choked and dissolved.
Unlike Earth, Venus has no ocean, no satellites and no intrinsic magnetic field. It is covered by thick, yellowish clouds – made of sulphur and droplets of sulphuric acid – that act like a blanket to trap surface heat. The upper cloud layers move faster than hurricane-force winds on Earth, sweeping all the way around the planet in just four days. These clouds also reflect most of the incoming sunlight, helping Venus to outshine everything in the night sky (apart from the Moon). At the present time, Venus dominates the western sky after sunset.
Atmospheric pressure is 90 times that of Earth, so an astronaut standing on Venus would be crushed by pressure equivalent to that at a depth of 900 m (more than half a mile) in the Earth’s oceans. The dense atmosphere consists mainly of carbon dioxide (the greenhouse gas that we breathe out every time we exhale) and virtually no water vapour. Since the atmosphere allows the Sun’s heat in but does not allow it to escape, surface temperatures soar to more than 450 deg. C – hot enough to melt lead. Indeed, Venus is hotter than Mercury, the planet closest to the Sun.
Venus rotates sluggishly on its axis once every 243 Earth days, while it orbits the Sun every 225 days – so its day is longer than its year! Just as peculiar is its retrograde, or “backwards” rotation, which means that a Venusian would see the Sun rise in the west and set in the east.
Earth and Venus are similar in density and chemical composition, and both have relatively young surfaces, with Venus appearing to have been completely resurfaced 300 to 500 million years ago.
The surface of Venus comprises about 20 per cent lowland plains, 70 per cent rolling uplands, and 10 per cent highlands. Volcanic activity, impacts, and deformation of the crust have shaped the surface. More than 1,000 volcanoes larger than 20 km (12.5 mls) in diameter dot the surface of Venus. Although much of the surface is covered by vast lava flows, no direct evidence of active volcanoes has been found. Impact craters smaller than 2 km (1 ml) across do not exist on Venus because most meteorites burn up in the dense atmosphere before they can reach the surface.
Venus is drier than the driest desert on Earth. Despite the absence of rainfall, rivers or strong winds, some weathering and erosion does occur. The surface is brushed by gentle winds, no stronger than a few kilometres per hour, enough to move grains of sand, and radar images of the surface show wind streaks and sand dunes. In addition, the corrosive atmosphere probably chemically alters rocks.
Radar images sent back by orbiting spacecraft and ground-based telescopes have revealed several elevated “continents”. In the north is a region named Ishtar Terra, a high plateau larger than the continental United States and bounded by mountains almost twice as high as Everest. Near the equator, the Aphrodite Terra highlands, more than half the size of Africa, extend for almost 10,000 km (6,250 miles). Volcanic lava flows have also produced long, sinuous channels extending for hundreds of kilometres.
Original Source: RAS News Release
Rover Analyzing Ejected Rock
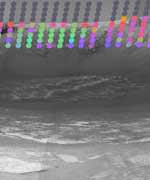
Image credit: NASA/JPL
NASA’s Mars Exploration Rover Opportunity has begun sampling rocks blasted out from a stadium-sized impact crater the rover is circling, and the very first one may extend our understanding about the region’s wet past.
Opportunity is spending a few weeks examining the crater, informally named “Endurance,” from the rim, providing information NASA will use for a decision about whether to send the rover down inside. That decision will take into account both the scientific allure of rock layers in the crater and the operational safety of the rover. Opportunity has completed observations from the first of three planned viewpoints located about one-third of the way around the rim from each other. Mission controllers at NASA’s Jet Propulsion Laboratory, Pasadena, Calif., are sending the rover around the crater’s rim counterclockwise.
“As we were proceeding from our first viewpoint toward our second viewpoint, we saw a rock that looked like nothing we’d ever seen before,” said Dr. Steve Squyres of Cornell University, Ithaca, N.Y., principal investigator for the science instruments on both Mars Exploration Rovers. The rock appears to have come from below the area’s current surface level, tossed up by the impact that excavated Endurance Crater.
This rock, dubbed “Lion Stone,” is about 10 centimeters tall and 30 centimeters long (4 inches by 12 inches). In some ways it resembles rocks that provided evidence of past water at the smaller crater, “Eagle Crater,” in which Opportunity landed. Like them, it has a sulfur-rich composition, fine layering and spherical concretions, and likely formed under wet conditions.
“However,” Squyres said, “it is different in subtle ways from what we saw at Eagle Crater: a little different in mineralogy, a little different in color. It may give us the first hint of what the environment was like before the conditions that produced the Eagle Crater rocks.”
Inside Endurance Crater are multiple layers of exposed rocks that might provide information about a much longer period of environmental history. From the viewpoints around the rim, Opportunity’s miniature thermal emission spectrometer is returning data for mapping the mineral composition of the rocks exposed in the crater’s interior.
“We see the coarse hematite grains on the upper slopes and basaltic sand at the bottom,” said Dr. Phil Christensen of Arizona State University, Tempe, lead scientist for that spectrometer. “Most exciting is the basalt signature in the layered cliffs.” Basalt is volcanic in origin, but the thinness of the layers visible in the cliffs suggests they were emplaced some way other than as flows of lava, he said.
“Our working hypothesis is that volcanically erupted rock was broken down into particles that were then transported and redeposited by wind or by liquid water,” Christensen said.
At a press conference today in Montreal, Canada, Christensen and Squyres presented previews of rover-science reports scheduled this week at a joint meeting of the American Geophysical Union and the Canadian Geophysical Union.
Although the stack of rock layers at Endurance is more than 10 times thicker than the bedrock exposure at Eagle Crater, it is still only a small fraction of the 200-meter-thick (650- foot-thick) stack seen from orbit at some other locations in Mars’ Meridian Planum region. A close-up look at the Endurance Crater rocks could help with interpreting the other exposures seen from orbit. “It’s possible that the whole stack was deposited in water — some particles washed in by flowing water and others chemically precipitated out of the water,” Christensen said. “An alternative is that wind blew sand in.”
Halfway around Mars from Opportunity, Spirit is driving toward highlands informally named “Columbia Hills,” where scientists hope to find older rocks than the ones on the plain the rover has been crossing. The rover could reach the edge of the hills by mid-June. “Spirit is making breathtaking progress,” Squyres said. “The other day it covered 124 meters [407 feet] in one day. And that’s not a parking lot we’re crossing. It’s hilly, rock-strewn terrain. This kind of pace bodes well for having lots of rover capability left when we get to the hills.”
JPL, a division of the California Institute of Technology in Pasadena, manages the Mars Exploration Rover project for NASA’s Office of Space Science, Washington, D.C. Images and additional information about the project are available from JPL at http://marsrovers.jpl.nasa.gov and from Cornell University at http://athena.cornell.edu.
Original Source: NASA/JPL News Release
Asteroid That Nearly Ended Life on Earth
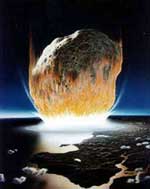
Image credit: NASA
An impact crater believed to be associated with the “Great Dying,” the largest extinction event in the history of life on Earth, appears to be buried off the coast of Australia. NASA and the National Science Foundation (NSF) funded the major research project headed by Luann Becker, a scientist at the University of California, Santa Barbara (UCSB). Science Express, the electronic publication of the journal Science, published a paper describing the crater today.
Most scientists agree a meteor impact, called Chicxulub, in Mexico’s Yucatan Peninsula, accompanied the extinction of the dinosaurs 65 million years ago. But until now, the time of the Great Dying 250 million years ago, when 90 percent of marine and 80 percent of land life perished, lacked evidence and a location for a similar impact event. Becker and her team found extensive evidence of a 125-mile-wide crater, called Bedout, off the northwestern coast of Australia. They found clues matched up with the Great Dying, the period known as the end-Permian. This was the time period when the Earth was configured as one primary land mass called Pangea and a super ocean called Panthalassa.
During recent research in Antarctica, Becker and her team found meteoric fragments in a thin claystone “breccia” layer, pointing to an end-Permian event. The breccia contains the impact debris that resettled in a layer of sediment at end-Permian time. They also found “shocked quartz” in this area and in Australia. “Few Earthly circumstances have the power to disfigure quartz, even high temperatures and pressures deep inside the Earth’s crust,” explains Dr. Becker.
Quartz can be fractured by extreme volcanic activity, but only in one direction. Shocked quartz is fractured in several directions and is therefore believed to be a good tracer for the impact of a meteor. Becker discovered oil companies in the early 70’s and 80’s had drilled two cores into the Bedout structure in search of hydrocarbons. The cores sat untouched for decades. Becker and co-author Robert Poreda went to Australia to examine the cores held by the Geological Survey for Australia in Canberra. “The moment we saw the cores, we thought it looked like an impact breccia,” Becker said. Becker’s team found evidence of a melt layer formed by an impact in the cores.
In the paper, Becker documented how the Chicxulub cores were very similar to the Bedout cores. When the Australian cores were drilled, scientists did not know exactly what to look for in terms of evidence of impact craters. Co-author Mark Harrison, from the Australian National University in Canberra, determined a date on material obtained from one of the cores, which indicated an age close to the end-Permian era. While in Australia on a field trip and workshop about Bedout, funded by the NSF, co-author Kevin Pope found large shocked quartz grains in end-Permian sediments, which he thinks formed as a result of the Bedout impact. Seismic and gravity data on Bedout are also consistent with an impact crater.
The Bedout impact crater is also associated in time with extreme volcanism and the break-up of Pangea. “We think that mass extinctions may be defined by catastrophes like impact and volcanism occurring synchronously in time,” Dr. Becker explains. “This is what happened 65 million years ago at Chicxulub but was largely dismissed by scientists as merely a coincidence. With the discovery of Bedout, I don’t think we can call such catastrophes occurring together a coincidence anymore,” Dr. Becker adds.
Two Planet Finding Missions
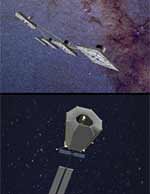
Image credit: NASA/JPL
Included in the nation’s new vision for space is a plan for NASA to “conduct advanced telescope searches for Earth-like planets and habitable environments around other stars.” To meet this challenge, NASA has chosen to fly two separate missions with distinct and complementary architectures to achieve the goal of the Terrestrial Planet Finder. The purpose will be to take family portraits of stars and their orbiting planets, and to study those planets to see which, if any, might be habitable, or might even have life. Both missions would launch within the next 10 to 15 years.
The two missions are:
* Terrestrial Planet Finder-C: a moderate-sized visible-light telescope, similar to the 4- by 6-meter (13.1- by 19.6-foot) version currently under study, to launch around 2014. Onboard coronagraph instrumentation will use a central disc and other specialized techniques to block the glare of a star, allowing detection and characterization of dimmer planets around it.
* Terrestrial Planet Finder-I: multiple spacecraft carrying 3 to 4 meter (9 to 13 foot) infrared telescopes flying in precise formation, to launch before 2020, and to be conducted jointly with the European Space Agency. Combining the infrared, or heat radiation gathered by the multiple telescopes, using a technique called interferometry, will simulate a much larger telescope. This will enable the mission to detect and study individual planets orbiting a parent star observed by TPF-C and also new ones beyond the reach of TPF-C.
Observing extra-solar planets in both visible and infrared light allows scientists to obtain a rich set of data to understand what chemical processes may be going on at various levels in a planet’s atmosphere and surface. That leads to understanding of whether a planet ever could or actually does harbor life. A review of these two plans will be conducted over the summer by NASA and the National Academy of Sciences Committee on Astronomy and Astrophysics. Two other architectures that were studied, the large visible coronagraph and the structurally connected infrared interferometer, will be documented and further studies concluded this summer.
Terrestrial Planet Finder is managed by NASA’s Jet Propulsion Laboratory, Pasadena, Calif., for NASA’s Office of Space Science, Washington, D.C. It is part of NASA’s Origins program, a series of missions and studies designed to answer the questions: Where did we come from? Are we alone?
Original Source: NASA/JPL News Release
