
The Associated Press is reporting that a private group of Russian space experts announced plans to send 6 humans to Mars by 2011 – for a cost of only $3.5 billion. An official from the Central Research Institute for Machine Building said it would carry out the mission with funding by Aerospace Systems, and would be completely private. The program envisions six cosmonauts traveling to Mars and exploring it for several months before returning to Earth – the total journey would take three years. The mission costs would be low because it would use existing spacecraft. The Russian Space Agency has no involvement with this mission, and dismissed it as nonsense.
Rover Mission Extended
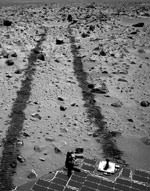
Image credit: NASA/JPL
NASA has approved an extended mission for the Mars Exploration Rovers, handing them up to five months of overtime assignments as they finish their three-month prime mission.
The first of the two rovers, Spirit, met the success criteria set for its prime mission. Spirit gained check marks in the final two boxes on April 3 and 5, when it exceeded 600 meters (1,969 feet) of total drive distance and completed 90 martian operational days after landing.
Opportunity landed three weeks after Spirit. It will complete the two-rover checklist of required feats when it finishes a 90th martian day of operations April 26. Each martian day, or “sol,” lasts about 40 minutes longer than an Earth day.
“Given the rovers’ tremendous success, the project submitted a proposal for extending the mission, and we have approved it,” said Orlando Figueroa, Mars Exploration Program director at NASA Headquarters, Washington, D.C.
The mission extension provides $15 million for operating the rovers through September. The extension more than doubles exploration for less than a two percent additional investment, if the rovers remain in working condition. The extended mission has seven new goals for extending the science and engineering accomplishments of the prime mission.
“Once Opportunity finishes its 91st sol, everything we get from the rovers after that is a bonus,” said Dr. Firouz Naderi, manager of Mars exploration at NASA’s Jet Propulsion Laboratory, Pasadena, Calif., where the rovers were built and are controlled. “Even though the extended mission is approved to September, and the rovers could last even longer, they also might stop in their tracks next week or next month. They are operating under extremely harsh conditions. However, while Spirit is past its ‘warranty,’ we look forward to continued discoveries by both rovers in the months ahead.” JPL’s Jennifer Trosper, Spirit mission manager, said even when a memory-management problem on the rover caused trouble for two weeks, she had confidence the rover and the operations team could get through the crisis and reach the 90-sol benchmark. “We never felt it was over, but certainly when we were getting absolutely no data from the spacecraft and were trying to figure out what happened, we were worried,” she said.
Trosper was less confident about Spirit’s prospects for reaching the criterion of 600 meters by sol 91, given the challenging terrain of the landing area within Gusev Crater. On sol 89 Spirit accomplished that goal and set a short-lived record for martian driving, with a single-sol distance of 50.2 meters (165 feet) that pushed the odometer total to 617 meters (2,024 feet). Two days later, Opportunity shattered that mark with a 100-meter (328-foot) drive.
Beyond the quantifiable criteria, such as using all research tools at both landing sites and investigating at least eight locations, the rovers have returned remarkable science results. The most dramatic have been Opportunity’s findings of evidence of a shallow body of salty water in the past in the Mars Meridiani Planum region.
“We’re going to continue exploring and try to understand the water story at Gusev,” said JPL’s Dr. Mark Adler, deputy mission manager for Spirit. Spirit is in pursuit of geological evidence for an ancient lake thought to have once filled Gusev Crater.
Reaching “Columbia Hills,” which could hold geological clues to that water story, is one of seven objectives for Spirit’s extended mission. Opportunity has a parallel one, to seek geologic context for the outcrop in the “Eagle” crater by reaching other outcrops in the “Endurance” crater and perhaps elsewhere. Other science objectives are to continue atmospheric studies at both sites to encompass more of Mars’ seasonal cycle, and to calibrate and validate data from Mars orbiters for additional types of rocks and soils examined on the ground.
Three new engineering objectives are to traverse more than a kilometer (0.62 mile) to demonstrate mobility technologies; to characterize solar-array performance over long durations of dust deposition at both landing sites; and to demonstrate long-term operation of two mobile science robots on a distant planet. During the past two weeks, rover teams at JPL have switched from Mars-clock schedules to Earth-clock schedules designed to be less stressful and more sustainable over a longer period.
JPL, a division of the California Institute of Technology in Pasadena, manages the Mars Exploration Rover project for NASA’s Office of Space Science, Washington, D.C. Images and additional information about the project are available from JPL at http://marsrovers.jpl.nasa.gov and from Cornell University, Ithaca, N.Y., at http://athena.cornell.edu .
Original Source: NASA/JPL News Release
New Asteroid Impact Simulator Available
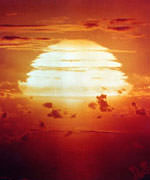
Image credit: US Department of Energy
Next time an asteroid or comet is on a collision course with Earth you can go to a web site to find out if you have time to finish lunch or need to jump in the car and DRIVE.
University of Arizona scientists are launching an easy-to-use, web-based program that tells you how the collision will affect your spot on the globe by calculating several environmental consequences of its impact.
Starting today, the program is online at http://www.lpl.arizona.edu/impacteffects .
You type in your distance from the predicted impact site, the size and type of projectile (e.g. ice, rock, or iron) and other information. Then the Earth Impact Effects Program calculates impact energies and crater size. It next summarizes thermal radiation, seismic shaking, ejecta deposition (where all that flying stuff will land), and air-blast effects in language that non-scientists understand.
For those who want to know how all these calculations are made, the web page will include “a description of our algorithm, with citations to the scientific sources used,” said Robert Marcus, a UA undergraduate in the UA/NASA Space Grant Program. He discussed the project recently at the 35th Lunar and Planetary Science Conference meeting in Houston, Texas.
Marcus developed the web site in collaboration with planetary sciences Regents? Professor H. Jay Melosh and research associate Gareth Collins of UA?s Lunar and Planetary Laboratory.
Melosh is a leading expert on impact cratering and one of the first scientists reporters call when rumors of big, Earth-smashing objects begin to circulate.
Reporters and scientists both want to know the same thing: how much damage a particular collision would wrack on communities near the impact site.
The web site is valuable for scientists because they don’t have to spend time digging up the equations and data needed to calculate the effects, Melosh said. Similarly, it makes the information available to reporters and other non-scientists who don’t know how to make the calculations.
“It seemed to us that this is something we could automate, if we could find some very capable person to help us construct the website,” Melosh said.
That person turned out to be Marcus, who is majoring in computer engineering and physics. He applied to work on the project as a paid intern through the UA/NASA Space Grant Program.
Marcus built the web-based program around four environmental effects. In order of their occurrence, they are:
1) Thermal radiation. An expanding fireball of searing vapor occurs at impact. The program calculates how this fireball will expand, when maximum radiation will occur, and how much of the fireball will be seen above the horizon.
The researchers based their radiation calculations on information found in “The Effect of Nuclear Weapons.” This 1977 book, by the U.S. Defense Department and U.S. Department of Energy, details “considerable research into what different degrees of thermal radiation from blasts will do,” Melosh noted.
“We determine at a given distance what type of damage the radiation causes,” Marcus said. “We have descriptions like when grass will ignite, when plywood or newspaper will ignite, when humans will suffer 2nd or 3rd degree burns.”
2) Seismic shaking. The impact generates seismic waves that travel far from the impact site. The program uses California earthquake data and computes a Richter scale magnitude for the impact. Accompanying text describes shaking intensity at the specified distance from the impact site using a modified Mercalli scale This is a set of 12 descriptions ranging from “general destruction” to “only mildly felt.”
Now suppose the dinosaurs had this program 65 million years ago. They could have used it to determine the environmental consequences of the 15-kilometer-diameter asteroid that smashed into Earth, forming the Chicxulub Crater.
The program would have told them to expect seismic shaking of magnitude 10.2 on the Richter scale. They also would have found (supposing that the continents were lined up as they are now) that the ground would be shaking so violently 1,000 kilometers (600 miles) away in Houston that dinosaurs living there would have trouble walking, or even standing up.
If the Chicxulub Crater-impact occurred today, glass in Houston would break. Masonry and plaster would crack. Trees and bushes would shake, ponds would form waves and become turbid with mud, sand and gravel banks would cave in, and bells in Houston schools and churches would ring from ground shaking.
3) Ejecta deposition. The team used a complicated ballistics travel-time equation to calculate when and where debris blown out of the impact crater would rain back down on Earth. Then they used data gathered from experimental explosions and measurements of craters on the moon to calculate how deep the ejecta blanket would be at and beyond the impact-crater rim.
They also determined how big the ejecta particles would be at different distances from impact, based on observations that Melosh and UA?s Christian J. Schaller published earlier when they analyzed ejecta on Venus.
OK, back to the dinosaurs. Houston would have been covered by an 80.8-centimeter- (32-inch-) thick blanket of debris, with particles averaging 2.8 mm (about 1/8th inch) in size. They would have arrived 8 minutes and 15 seconds after impact (meaning they got there at more than 4,000 mph).
4) Air blast. Impacts also produce a shock wave in the atmosphere that, by definition, moves faster than the speed of sound. The shock wave creates intense air pressure and severe winds, but decays to the speed of sound while it?s still close to the fireball, Melosh noted. “We translate that decreasing pressure in terms of decibels ? from ear-and-lung-rupturing sound, to being as loud as heavy traffic, to being only as loud as a whisper.”
The program calculates maximum pressures and wind velocities based on test results from pre-1960s nuclear blasts. Researchers at those blasts erected brick structures at the Nevada Test Site to study blast wave effects on buildings. The UA team used that information to describe damage in terms of buildings and bridges collapsing, cars bowled over by wind, or forests being blown down.
Dinosaurs living in Houston would have heard the Chicxulub impact as loud as heavy traffic and basked in 30 mph winds.
Original Source: UA News Release
Question: Are There Plans to Deal With a Potential Asteroid Strike?
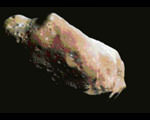
Image credit: NASA
The simple answer to this question is “no”. There are limited search and detection programmes in operation, mainly in the US, but these are only designed to detect large asteroids in the 1 km plus range. NASA funds four such programmes, and contributes to a fifth.
Were an asteroid to be detected on a collision course with Earth our response would depend on the warning time. If the collision were to occur within days, weeks or months there is nothing that we can do except make plans for the aftermath. We would need a few decades to be sure of having an effective response.
One of the major problems is that a collision will not be certain until it is far too late to mount a mitigation project – it’s all a matter of probabilities. It will be a political decision as to when we take action, and there is no concensus as to when this should be. Do we act when the impact probability is 1:1 million, 1:1000, 1:100 or 1:10? The longer we wait, the more difficult the job will be.
Jay Tate is a member of the Board of Directors of the International Spaceguard Foundation, a consultant to the International Astronomical Union Working Group on Near Earth Objects. He is the Director of the Spaceguard Centre in mid-Wales.
Wallpaper: Louros Valles
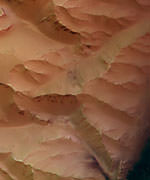
Image credit: ESA
These latest images show a system of sapping channels, called Louros Valles (named in 1982 after river in Greece), south of the Ius Chasma canyon which runs east to west.
These images were taken by the High Resolution Stereo Camera (HRSC) on board ESA’s Mars Express during orbit 97 from an altitude of 269 kilometres. The images have a resolution of about 13 metres per pixel and are centred at 278.8? East and 8.3? South. The colour image has been created from the nadir and three colour channels. North is at the right.
The Ius Chasma belongs to the giant Valles Marineris canyon system on Mars. The Geryon Montes, visible at the right of this image, is a mountain range which divides the Ius Chasma into two parallel trenches. The dark deposits at the bottom of the Ius Chasma are possibly related to water and wind erosion.
‘Sapping’ is erosion by water that emerges from the ground as a spring or seeps from between layers of rock in a wall of a cliff, crater or other type of depression. The channel forms from water and debris running down the slope from the seepage area.
This is known from similar features on Earth, but on Mars it is thought that most of the water had probably either evaporated or frozen by the time it reached the bottom of the slope.
Original Source: ESA News Release
Field Reversal Takes 7,000 Years
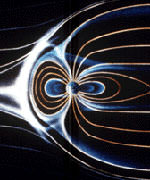
Image credit: NASA
The time it takes for Earth’s magnetic field to reverse polarity is approximately 7000 years, but the time it takes for the reversal to occur is shorter at low latitudes than at high latitudes, a geologist funded by the National Science Foundation (NSF) has concluded. Brad Clement of Florida International University published his findings in this week’s issue of the journal Nature. The results are a major step forward in scientists’ understanding of how Earth?s magnetic field works.
The magnetic field has exhibited a frequent but dramatic variation at irregular times in the geologic past: it has completely changed direction. A compass needle, if one existed then, would have pointed not to the north geographic pole, but instead to the opposite direction. Such polarity reversals provide important clues to the nature of the processes that generate the magnetic field, said Clement.
Since the time of Albert Einstein, researchers have tried to nail down a firm time-frame during which reversals of Earth’s magnetic field occur. Indeed, Einstein once wrote that one of the most important unsolved problems in physics centered around Earth’s magnetic field. Our planet’s magnetic field varies with time, indicating it is not a static or fixed feature. Instead, some active process works to maintain the field. That process is most likely a kind of dynamic action in which the flowing and convecting liquid iron in Earth’s outer core generates the magnetic field, geologists believe.
Figuring out what happens as the field reverses polarity is difficult because reversals are rapid events, at least on geologic time scales. Finding sediments or lavas that record the field in the act of reversing is a challenge. In the past several years, however, new polarity transition records have been acquired in sediment cores obtained through the international Ocean Drilling Program, funded by NSF. These records make it possible to determine the major features of reversals, Clement said.
“It is generally accepted that during a reversal, the geomagnetic field decreases to about 10 percent of its full polarity value,” said Clement. “After the field has weakened, the directions undergo a nearly 180 degree change, and then the field strengthens in the opposite polarity direction. A major uncertainty, however, has remained regarding how long this process takes. Although this is usually the first question people ask about reversals, scientists have been forced to answer with only a vague ‘a few thousand years.'”
The reason for this uncertainty? Each published polarity transition reported a slightly different duration, from just under 1,000 years to 28,000 years.
“Now, through the innovative use of deep-ocean sediment cores, Clement has demonstrated that magnetic field reversal events occur within certain time-frames, regardless of the polarity of the reversal,” said Carolyn Ruppel, program director in NSF’s division of ocean sciences. “Sediment cores originally drilled to meet disparate scientific objectives have led to a result of global significance, which underscores the value of collecting and maintaining cores and associated data.”
Clement examined the database of existing polarity transition records of the past four reversals. The overall average duration, he found, is 7,000 years. But the variation is not random, he said. Instead it alters with latitude. The directional change takes half as long at low-latitude sites as it does at mid- to high-latitude sites. “This dependence of duration on site latitude was surprising at first, but it?s exactly as would be predicted in geometric models of reversing fields,” Clement said.
Original Source: NSF News Release
Cassini Sees Merging Storms on Saturn
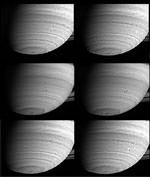
Image credit: NASA/JPL/Space Science Institute
Only a month and a half into its long approach to Saturn, the Cassini spacecraft captured two storms, each a swirling mass of clouds and gas, in the act of merging. With diameters close to 1000 kilometers (621 miles), both storms, which appear as spots in the southern hemisphere, were seen moving westward, relative to the rotation of Saturn’s interior, for about a month before they merged on Mar. 19-20, 2004.
Merging is one of the distinct features of storms in the giant planet atmospheres. On Earth, storms last for a week or so and usually fade away when they enter the mature phase and can no longer extract energy from their surroundings. On Saturn and the other giant planets, storms last for months, years, or even centuries, and instead of simply fading away, many storms on the giant planets end their lives by merging. How they form is still uncertain.
The series of eight images shown here was taken between Feb. 22 and Mar. 22, 2004; the image scale ranges from 381 kilometers (237 miles) to 300 kilometers (186 miles) per pixel. All images have been processed to enhance visibility. The top four frames, spanning 26 days, are portions of narrow angle camera images that were taken through a filter accepting light in the near-IR region of the spectrum centered at 619 nanometers, and show two spots approaching each other. Both storms are within half a degree of 36 degrees south latitude and sit in an anti-cyclonic shear zone, which means that the flow to the north is westward relative to the flow to the south. Consequently, the northern storm moves westward at a slightly greater rate than the southern one: 11 vs. 6 meters per second (25 and 13 miles per hour), respectively. The storms drift with these currents and engage in a counterclockwise dance before merging with each other.
The bottom four frames are from images taken on Mar. 19, 20, 21, and 22, respectively, in a region of the spectrum visible to the human eye and illustrate the storms’ evolution. Just after the merger, on Mar. 20, the new feature is elongated in the north-south direction, with bright clouds on either end. Two days later on Mar. 22, it has settled into a more circular shape and the bright clouds have spread around the circumference to form a halo. Whether the bright clouds are particles of a different composition or particles at a different altitude is uncertain.
The new storm is a few tenths of a degree farther south than either of its progenitors. There, its westward velocity is weaker and it is almost stationary relative to the planet’s rotation. Although these particular storms move slowly westward, storms at Saturn’s equator move eastward at speeds up to 450 meters per second (1000 mph), which is ~10 times the speed of the Earth’s jet streams and ~ three times greater than the equatorial winds on Jupiter. Saturn is the windiest planet in the solar system, which is another mystery of the ringed giant.
The Cassini-Huygens mission is a cooperative project of NASA, the European Space Agency and the Italian Space Agency. The Jet Propulsion Laboratory, a division of the California Institute of Technology in Pasadena, manages the Cassini-Huygens mission for NASA’s Office of Space Science, Washington, D.C. The imaging team is based at the Space Science Institute, Boulder, Colorado.
For more information about the Cassini-Huygens mission, visit http://saturn.jpl.nasa.gov and the Cassini imaging team home page, http://ciclops.org.
Original Source: NASA/JPL News Release
Hubble Peers Into the Heart of Galaxy NGC 300

Image credit: Hubble
What appear as individual grains of sand on a beach in this image obtained with NASA’s Hubble Space Telescope are actually myriads of stars embedded deep in the heart of the nearby galaxy NGC 300. The Hubble telescope’s exquisite resolution enables it to see the stars as individual points of light, despite the fact that the galaxy is millions of light-years away.
NGC 300 is a spiral galaxy similar to our own Milky Way. It is a member of a nearby collection of galaxies known as the Sculptor group, named for the southern constellation where the group can be found. The distance to NGC 300 is 6.5 million light-years, making it one of the Milky Way’s closer neighbors. At this distance, only the brightest stars can be picked out from ground-based images. With a resolution some 10 times better than ground-based telescopes, Hubble’s Advanced Camera for Surveys (ACS) resolves many more stars in this galaxy than can be detected from the ground.
A ground-based Digitized Sky Survey image of the full field of NGC 300 is shown in the top left frame. An outline of the Hubble Heritage ACS image is marked and shown in the image in the top right frame. A detailed blowup of this image (in the bottom frame) shows individual stars in the galaxy. A background spiral galaxy is visible in the lower right corner. The individual Hubble ACS exposures were taken in July and September 2002.
Original Source: Hubble News Release
Book Review: Practical Astronomy

The first half of the book is a reference source for how to observe. With good sense, it gives credit to the unaided eye and it extols the benefits of quickly and easily orienting yourself amongst the limitless dots and streaks in the black canopy of night. Visual aids are described. Telescope types; refractor, reflector and catadioptric, are compared. Ancillary equipment from red lights, to telescope drives to planispheres are also discussed. There are star charts (white dot on blue background) for the complete sky, that is both northern and southern hemispheres. These charts show stars up to magnitude 5 as well as the constellations and their boundaries. This half of the book also includes a section on how to locate the constellations and many of the most significant stars using the altazimuthal system, celestial coordinates, and/or from starting from other, easy to find sights such as Orion.
The second half of the book categorizes the sources of light from near Earth outwards. It starts with meteors, satellites and auroras, then to the Moon, the Sun, and through each of the planets. The final section looks at star clusters, binary stars and nebulae. There is even a brief discussion of galaxies and some exciting amateur prints of them. Rather than solely stating where to find each object, this half discusses characteristics of interest (e.g. the cusps of Venus), noteworthy events (e.g. occultations) and effects in time (e.g. variable stars). Throughout this half the author emphasizes the benefits of recording observations, such as by sketching. This is both for self-satisfaction and as a means of proving observations of an original event.
I like this book as it explains all the necessary fundamentals for sky watching. Without costing more than the price of this text, a person can occupy themselves for a long time in getting acquainted with the sights and events that occur while most everyone else is safely tucked into bed. Sometimes I did find the text a little difficult to follow especially with some of the explanations. Yet there are many prints and drawings that provide a lot of clarity. Also, there are enough inline references throughout the text to aid in following any particular topic.
In all, Practical Astronomy is a great reference for getting a person started onto the road of understanding the night sky and enjoying a pastime that keeps many night owls happily occupied.
Buy this book and others from Amazon.com
Review by Mark Mortimer
Aura Satellite Delivered to Launch Facility

Image credit: NASA/JPL
NASA’s Aura spacecraft, the latest in the Earth Observing System series, has arrived at Vandenberg Air Force Base, Calif., to begin launch preparations.
Aura was transported from Northrop Grumman’s Space Park manufacturing facility in Redondo Beach, Calif. The spacecraft will undergo final tests and integration with a Boeing Delta II rocket for a scheduled launch in June.
Aura’s four state-of-the-art instruments, including two built and managed by NASA’s Jet Propulsion Laboratory, Pasadena, Calif., will study the atmosphere’s chemistry and dynamics. The spacecraft will provide data to help scientists better understand Earth’s ozone, air quality and climate change. JPL’s Tropospheric Emission Spectrometer is an infrared sensor designed to study Earth’s troposphere-the lowest region of the atmosphere-and to look at ozone. JPL’s Microwave Limb Sounder is an instrument intended to improve our understanding of ozone in Earth’s stratosphere, vital in protecting us from solar ultraviolet radiation.
“The entire Aura team is very excited to see all our efforts come to fruition and is looking forward to a successful launch,” said Rick Pickering, Aura project manager at NASA’s Goddard Space Flight Center in Greenbelt, Md.
Aura fulfills part of NASA’s commitment to study Earth as a global system and represents a key agency contribution to the U.S. Global Change Research Program. This mission will continue the global data collection underway by NASA’s other Earth Observing System satellites: Terra, which monitors land; and Aqua, which observes Earth’s water cycle.
The Aura spacecraft is part of NASA’s Earth Science Enterprise, a long-term research effort to determine how human-induced and natural changes affect the global environment.
For more information about Aura on the Internet, visit http://aura.gsfc.nasa.gov . For more information about the Tropospheric Emission Spectrometer on the Internet, visit http://tes.jpl.nasa.gov/ . For more information about the Microwave Limb Sounder on the Internet, visit http://mls.jpl.nasa.gov/ .
Original Source: NASA/JPL News Release