Ulysses is Running Out of Power

Image credit: NASA
Deep space is cold. Very cold. That’s a problem–especially if you’re flying in an old spaceship. And your power supplies are waning. And the fuel lines could freeze at any moment. Oh, and by the way, you’ve got to keep flying for thirteen more years.

It sounds like a science fiction thriller, but this is really happening to the NASA/European Space Agency spacecraft Ulysses.

Ulysses was launched in 1990 on a five-year mission to study the sun. The craft gathered new data about the speed and direction of the solar wind. It discovered the 3D shape of the sun’s magnetic field. It recorded solar flares on the sun, and super-solar flares from distant neutron stars. Ulysses even flew through the tail of comet Hyakutake, an unexpected encounter that delighted astronomers.

The mission was supposed to end in 1995, but Ulysses was too successful to quit. NASA and the ESA have granted three extensions, most recently in Feb. 2004. Ulysses is scheduled to keep going until 2008, thirteen years longer than originally planned.

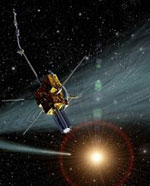
Ulysses’ extended mission, as before, is to study the sun. But at the moment Ulysses is far from our star. It’s having an encounter with Jupiter, studying the giant planet and its magnetic field. Sunlight out there is 25 times less intense than what we experience on Earth, and Ulysses is getting perilously cold.

Back in the 1980’s, when Ulysses was still on Earth and being assembled, mission planners knew that the spacecraft would have to endure some low temperatures. So they put dozens of heaters onboard, all powered by a Radioisotope Thermoelectric Generator, or “RTG.” These heaters have kept Ulysses comfortably warm.

But there’s a problem: the RTG is fading.

“The power output of the RTG has been dropping since the spacecraft was launched,” says Nigel Angold, the Ulysses ESA Spacecraft Operations Manager at JPL. RTG power naturally fades as its radioactive source decays. That’s as expected. What planners didn’t expect was 13 years of extra operations.

“When Ulysses was launched in 1990 the RTG produced 285 watts. Now it’s down to 207 watts–barely enough power to run the science instruments and the heaters at the same time,” notes Angold.

Inside Ulysses the temperature varies from place to place. “Many of the science instruments are already below freezing (0 C),” says Ulysses thermal engineer Fernando Castro. “That’s OK, because they can operate at low temperature.” But the fuel lines are another matter. They’re hovering about 3 degrees above zero, “and if they freeze we’re in trouble.”

Fuel lines are critical to the mission. They deliver hydrazine propellant to the ship’s eight thrusters. Every week or so, ground controllers fire the thrusters to keep Ulysses’ radio antenna pointing toward Earth. The thrusters won’t work if the hydrazine freezes. No thrusters means no communication. The mission would be lost.

About eight meters of fuel line snake through the spaceship. Every twist and turn is a possible cold spot, a place where the hydrazine can begin to solidify. “If the hydrazine freezes anywhere, I don’t know if we can safely thaw it again,” worries Castro. When hydrazine thaws, it expands, possibly enough to rupture the fuel lines. Ulysses’ propellant would fizzle uselessly into space.

The temperature at any given point along the fuel lines is bewilderingly sensitive to what’s going on elsewhere in the spacecraft. Turning on a scientific instrument “here” might cause a chill “over there,” because it takes power away from one of the heaters. Firing a thruster, playing back or recording data: almost anything could upset Ulysses’ delicate thermal balance.

Above: The complicated interior of Ulysses. Dark blocks are science instruments and other devices. Fuel lines, denoted by red, blue and green, lead from a central hydrazine tank to the thrusters. Click here to view areas most vulnerable to freezing.

Even the simple act of sending the spacecraft a message can cause problems. Systems engineer Andy McGarry recalls, “last month we were sending some new commands to Ulysses when the temperature began to drop, as much as 0.8 degrees C near the fuel lines. We were less than a degree from the freezing point of hydrazine–too close for comfort.”

Engineers quickly figured out the problem. “All of Ulysses’ science instruments had been activated to study Jupiter,” explains McGarry, “and this was straining the RTG to its limit.” Ulysses would have trouble supporting even one more device. But when a signal arrived from Earth, another device did turn on, automatically: the decoder, which translates radio signals into a stream of binary ones and zeros understood by Ulysses’ computers. “The decoder was stealing power from the heaters.”

Since then ground controllers have learned to keep their transmissions to Ulysses brief, so the temperature can’t fall very far.

Ulysses is about to turn away from Jupiter and head back to the sun. Eventually solar heating will keep the hydrazine warm, and onboard heaters can be turned off, “but that won’t happen until 2007,” says Angold. Meanwhile, engineers at JPL keep a constant watch on the spacecraft.

Mission scientist Steve Suess at the NASA Marshall Space Flight Center believes it’s worth the effort. “The extended mission gives us a chance to learn a lot more about the sun.” Of special interest is the Solar Minimum. Solar activity waxes and wanes every 11 years, he explains. Ulysses studied the sun’s quiet phase, Solar Minimum, between 1994 and 1995. Now Ulysses gets to do it again. “The next Solar Minimum is due around 2006,” says Suess, “but it won’t be the same as before.” In 2001 the sun’s magnetic field flipped. The north pole shifted south, and vice versa. Magnetically speaking, the sun is now upside down. How will that affect Solar Minimum?

Perhaps Ulysses will find out ? if it doesn’t freeze to death first.

Original Source: NASA Science Story

The Origins of Oxygen on Earth

Image credit: NASA
Christopher Chyba is the principal investigator for The SETI Institute lead team of the NASA Astrobiology Institute. Chyba formerly headed the SETI Institute’s Center for the Study of Life in the Universe. His NAI team is pursuing a wide range of research activities, looking at both life’s beginnings on Earth and the possibility of life on other worlds. Astrobiology Magazine’s managing editor, Henry Bortman, spoke recently with Chyba about several of his team’s projects that will explore the origin and significance of oxygen in Earth’s atmosphere.

Astrobiology Magazine: Many of the projects that members of your team will be working on have to do with oxygen in Earth’s atmosphere. Today oxygen is a significant component of the air we breathe. But on early Earth, there was very little oxygen in the atmosphere. There is a great deal of debate about just how and when the planet’s atmosphere became oxygenated. Can you explain how your team’s research will approach this question?

Christopher Chyba: The usual story, with which you’re probably familiar, is that after oxygenic photosynthesis evolved, there was then a huge biological source of oxygen on early Earth. That’s the usual view. It may be right, and what’s usually the case in these kinds of arguments is not whether one effect is right or not. Probably many effects were active. It’s a question of what was the dominant effect, or whether there were several effects of comparable importance.

SETI Institute researcher Friedemann Freund has a completely non-biological hypothesis about the rise of oxygen, which has some experimental support from laboratory work that he’s done. The hypothesis is that, when rocks solidify from magma, they incorporate small amounts of water. Cooling and subsequent reactions leads to the production of peroxy links (consisting of oxygen and silicon atoms) and molecular hydrogen in the rocks.

Then, when the igneous rock is subsequently weathered, the peroxy links produce hydrogen peroxide, which decomposes into water and oxygen. So, if this is right, simply weathering igneous rocks is going to be a source of free oxygen into the atmosphere. And if you look at some of the quantities of oxygen that Friedemann is able to release from rocks in well-controlled situations in his initial experiments, it might be that this was a substantial and significant source of oxygen on early Earth.

So even apart from photosynthesis, there might be a kind of natural source of oxygen on any Earth-like world that had igneous activity and liquid water available. This would suggest that the oxidation of the surface might be something that you expect to occur, whether photosynthesis happens early or late. (Of course, the timing of this depends on oxygen sinks as well.) I emphasize that’s all a hypothesis at this point, for much more careful investigation. Friedemann’s done only pilot experiments so far.

One of the interesting things about Friedemann’s idea is that it suggests there might be an important source of oxygen on planets completely independent of biological evolution. So there might be a natural driver towards the oxidation of the surface of a world, with all the ensuing consequences for evolution. Or maybe not. The point is to do the work and find out.

Another component of his work, which Friedemann will do with the microbiolologist Lynn Rothschild of NASA Ames Research Center, has to do with this question of whether in environments associated with weathered igneous rocks and the production of oxygen, you could have created micro-environments that would have allowed certain microorganisms living in those environments to have pre-adapted to an oxygen-rich environment. They’ll be doing work with microorganisms to try to address that question.

AM: Emma Banks will be looking at chemical interactions in the atmosphere of Saturn’s moon Titan. How does that tie into understanding oxygen on early Earth?

CC: Emma’s looking at another abiotic way that might be important in oxidizing a world’s surface. Emma does chemical computational models, all the way down to the quantum mechanical level. She does them in a number of contexts, but what’s relevant to this proposal has to do with haze formation.

On Titan – and possibly on the early Earth as well, depending on your model for the atmosphere of the early Earth – there’s a polymerization of methane [the combination of methane molecules into larger hydrocarbon-chain molecules] in the upper atmosphere. Titan’s atmosphere is several percent methane; almost all the rest of it is molecular nitrogen. It’s bombarded with ultraviolet light from the sun. It’s also bombarded with charged particles from Saturn’s magnetosphere. The effect of that, acting on the methane, CH4 , is to break the methane up and polymerize it into longer-chain hydrocarbons.

If you start polymerizing methane into longer and longer carbon chains, each time you add another carbon onto the chain, you’ve got to get rid of some hydrogen. For example, to go from CH4 (methane) to C2H6, (ethane) you have to get rid of two hydrogens. Hydrogen is an extremely light atom. Even if it makes H2, that’s an extremely light molecule, and that molecule’s lost off the top of Titan’s atmosphere, just as it’s lost off the top of the Earth’s atmosphere. If you bleed hydrogen off the top of your atmosphere, the net effect is to oxidize the surface. So it’s another way that gives you a net oxidation of a world’s surface.

Emma’s interested in this primarily with respect to what takes place on Titan. But it’s also potentially relevant as a kind of global oxidizing mechanism for the early Earth. And, bringing nitrogen into the picture, she’s interested in the potential production of amino acids out of these conditions.

AM: One of the mysteries about early life on Earth is how it survived the damaging effects of ultraviolet (UV) radiation before there was enough oxygen in the atmosphere to provide an ozone shield. Janice Bishop, Nathalie Cabrol and Edmond Grin, all of whom are with the SETI Institute, are exploring some of these strategies.

CC: And there are a lot of potential strategies there. One is just being deep enough below the surface, whether you’re talking about the land or the sea, to be completely shielded. Another is to be shielded by minerals within the water itself. Janice and Lynn Rothschild are working on a project that is examining the role of ferric oxide minerals in water as a kind of UV shield.

In the absence of oxygen the iron in water would be present as ferric oxide. (When you have more oxygen, the iron oxidizes further; it becomes ferrous and drops out.) Ferric oxide could potentially have played the role of an ultraviolet shield in the early oceans, or in early ponds or lakes. To investigate how good it is as a potential UV shield, there are some measurements you might want to make, including measurements in natural environments, such as in Yellowstone. And once again there’s a microbiological component to the work, with Lynn’s involvement.

This is related to the project that Nathalie Cabrol and Edmond Grin are pursuing, from a different perspective. Nathalie and Edmond are very interested in Mars. They are both on the Mars Exploration Rover science team. In addition to their Mars work, Nathalie and Edmond explore environments on Earth as Mars analog sites. One of their topics of investigation is strategies for survival in high-UV environments. There’s a lake six kilometers high on Licancabur (a dormant volcano in the Andes). We now know there’s microscopic life in that lake. And we’d like to know what are its strategies for surviving in the high-UV environment there? And that’s a different, very empirical way of getting at this question of how life survived in the high-UV environment that existed on early Earth.

These four projects are all coupled, because they have to do with the rise of oxygen on early Earth, how organisms survived before there was substantial oxygen in the atmosphere, and then, how all this relates to Mars.

Original Source: Astrobiology Magazine

Universe Today Maintenance Thursday

If you had problems accessing Universe Today yesterday, don’t worry, you weren’t alone. I was “lucky” enough to end up on the homepage of Google News for the Sedna story. The resulting traffic brought my webserver to its knees. I had a chat with my service provider and they’ve recommended some upgrades to the server to better handle future traffic spikes. They’ll be installing the new hardware on Thursday at 1500 UTC (10 am EST), so the website will be down for 1-2 hours. Okay, Google… bring it on.

Thanks to everyone who donated over the weekend… it was good timing. 🙂

Fraser Cain
Publisher
Universe Today

Wallpaper: Bonneville Crater

Image credit: NASA/JPL
NASA’s Spirit rover has taken a beautiful panoramic image of the Bonneville crater. Here’s a 1024×768 wallpaper of the crater. The original image was quite wide, covering 180-degrees, so it doesn’t quite fit a computer screen normally – this image has been cropped a bit. Spirit recorded this photo on March 12, 2004, using its panoramic camera. By taking such a detailed image, scientists can get a good idea about the surface material at the crater.

Proton Launches W3A Satellite

Image credit: ILS
A Russian Proton rocket successfully placed the Eutelsat W3A satellite into orbit this morning, marking the second mission in three days for International Launch Services (ILS).

This was the first flight of the year for the Khrunichev-built Proton vehicle, which has carried out more than 300 missions for the Russian government and commercial customers over nearly 40 years.

This also was the third mission of the year for ILS. The company?s other vehicle, the Lockheed Martin (NYSE: LMT) Atlas rocket, successfully launched a satellite Saturday morning from Cape Canaveral, Fla.

?We celebrate another success for Proton, and thank our customer, Eutelsat, for again placing its confidence in us,? said ILS President Mark Albrecht. ?This marks the seventh mission on an ILS vehicle for Eutelsat, and we?re proud to say they have all been flawless.?

The Proton vehicle lifted off at 4:06 a.m. local time (6:06 p.m. Monday EST, 23:06 GMT). In less than 10 minutes, the three-stage Proton vehicle finished its climb into space, leaving the Breeze M upper stage to continue the mission for the next nine hours. The Breeze M?s engine underwent five burns to place the W3A satellite into a geosynchronous transfer orbit at 1:16 p.m. Baikonur time (3:16 a.m. Tuesday EST, 08:16 GMT).

?Our congratulations to ILS for another flawless launch for Eutelsat, which follows six successful launches on the Atlas rocket from Cape Canaveral,? said Giuliano Berretta, CEO of Eutelsat. ?W3A is the heaviest and most complex satellite yet launched for our company. Its ride into geostationary transfer orbit on the Proton/Breeze M will enable us to optimize the operational lifetime of W3A and take us to new levels of efficiency.?

When it enters service later this year, the W3A satellite will provide broadband, direct-to-home and other communications services to Eutelsat customers in Europe, the Middle East and Africa. It is an EADS Astrium Eurostar E3000 model satellite, the largest spacecraft launched to date for Eutelsat.

?Congratulations to ILS for the successful launch of the Proton, which put W3A in geostationary orbit this morning,? said Antoine Bouvier, CEO of EADS Astrium. ?It is a major event for us as it is the maiden launch of a Eurostar E3000 and the first to be launched by Proton.?

ILS is a joint venture of Lockheed Martin Corp. and Khrunichev State Research and Production Space Center. ILS, based in McLean, Va., markets and manages all missions for Atlas and commercial missions on Proton.

Original Source: ILS News Release

SOHO Sees a Huge Prominence on the Sun

Image credit: SOHO
On Friday, 12 March 2004, the Sun ejected a spectacular ‘eruptive prominence’ into the heliosphere. SOHO, the ESA/NASA solar watchdog observatory, faithfully recorded the event.

This ‘eruptive prominence’ is a mass of relatively cool plasma, or ionised gas. We say ‘relatively’ cool, because the plasma observed by the Extreme-ultraviolet Imaging Telescope (EIT) on board SOHO was only about 80 000 degrees Celsius, compared to the plasma at one or two million degrees Celsius surrounding it in the Sun’s tenuous outer atmosphere, or ‘corona’.

At the time of this snapshot, the eruptive prominence seen at top right was over 700 000 kilometres across – over fifty times Earth’s diameter – and was moving at a speed of over 75 000 kilometres per hour.

Eruptive prominences of this size are associated with coronal mass ejections (CMEs), and the combination of CMEs and prominences can affect Earth’s magnetosphere when directed toward our planet. In this case, the eruptive prominence and associated CME were directed away from Earth.

SOHO is a mission of international co-operation between ESA and NASA, launched in December 1995. Every day SOHO sends thrilling images from which research scientists learn about the Sun’s nature and behaviour. Experts around the world use SOHO images and data to help them predict ‘space weather’ events affecting our planet.

Original Source: ESA News Release

Mountain of Sky Survey Data Released

Image credit: SDSS
One of the largest astronomy catalogs ever compiled was released to the public today by the Sloan Digital Sky Survey (SDSS).

With photometric and spectroscopic observations of the sky gathered during the last two years, this second data release (DR2) offers six terabytes of images and catalogs, including two terabytes in an easy to use searchable database.

This public data release provides digital images and measured properties of more than 88 million celestial objects, as well as spectra and redshifts of over 350,000 objects. The data are available from the SDSS Web site (http://www.sdss.org/DR2) or from the SkyServer Web site more attuned to the general public (http://skyserver.sdss.org/).

The SDSS is the most ambitious astronomical survey ever undertaken. A consortium of more than 200 astronomers at 13 institutions around the world, the SDSS will map in detail one-quarter of the entire sky, determining the positions and brightnesses of several hundred million celestial objects. It will also measure the distances to approximately one million galaxies and quasars.

“Getting DR2 out to the broader astronomical community and to the general public will allow these data to be analyzed for projects limited only by the imagination and ingenuity of the user,” said Michael Strauss of Princeton University, scientific spokesperson for the SDSS.

Strauss explained that while members of the SDSS international collaboration have written more than 200 scientific papers with SDSS data, “we feel we’ve barely started. There is far more interesting science to be done and discoveries to be made with these data than we have time or people to do. This is why this data release is so important.” Public searchable data in the survey have doubled from June 2003 to today.

“Many external researchers are already using the data from earlier public releases”, explained Alex Szalay of the Johns Hopkins University, an architect of the SDSS’s data mining tools. In fact, researchers from outside of the consortium wrote roughly half of the SDSS-related papers presented at recent American Astronomical Society meetings. “This is a clear indication that we’ve kept our promise to the scientific community of getting them uniformly high quality data in a timely manner and in a searchable format.”

The first public data release from the SDSS in 2003 contained information on 50 million objects, including spectra and redshifts for almost 200,000 of these objects. The SDSS is an ongoing survey that recorded its first observations in May 1998 and is funded for operations through Summer 2005.

The 2.5-meter SDSS telescope is located at Apache Point Observatory in New Mexico and is operated by the Astrophysical Research Consortium. The telescope has two main instruments: an imaging camera, one of the largest ever built, and a spectrograph capable of recording data from 640 objects at a time. The camera creates images from digital scans through five filters: ultraviolet, green, red, and two infrared bands.

CATALOG OF RESULTS
Scientific findings and ground-breaking discoveries already achieved with the DR2 data from the most distant quasars, to the coolest stars, the properties of galaxies to the sizes of asteroids, the structure of the halo of our Milky Way and the large-scale structure of the universe.

DR2 consists of images from 3,324 square degrees of the Northern sky and more than 88 million galaxies, stars, and quasars. The survey is complete for objects as faint as 22.2 magnitude, three million times fainter than the faintest star that can be seen with the naked eye on a dark night.

In addition to images from the SDSS telescope, the DR2 includes the spectra, and therefore redshifts, of 260,000 galaxies, 36,000 quasars, and 48,000 stars, according to consortium member Mark Subbarao of the University of Chicago. The galaxy and quasar catalogs are the largest ever produced.

SEARCH REFINEMENTS
Jim Gray of Microsoft Corp. was part of the team working to make the observations accessible to the astronomical community and the public. The team developed several algorithms to efficiently search the complicated database.

“The SDSS is a BIG database with researchers making very complicated queries for spatial, color and space parameters,” explained Gray, a distinguished engineer in Microsoft’s Scaleable Servers Research Group and manager of Microsoft’s Bay Area Research Center.

“It has been very rewarding working with the SDSS. The people are very creative, enthusiastic, and bright. The SDSS has shown that we database folks need to do a better job in many ways,” Gray said. “For Microsoft, the SkyServer and Catalog Archive Server are an information-at-your-fingertips project we’ve helped develop for astronomers. I see them as archetypes of what all the sciences need.”

Ani Thakar, an SDSS astronomer from the Johns Hopkins University’s Center for Astrophysical Sciences, who has worked closely with Szalay and Gray on the SkyServer, said the DR2 database has a form-based Web page for imaging and spectroscopic queries.

“This gives astronomers the ability to extract detailed information from the database without having to learn a query language. We’ve also added a batch service that lets users submit queries that are likely to take a long time. They can come back later and pick up the results,” Thakar explained.

DR2 also offers enhanced querying and filtering options like image cutout and finding chart services. Users can cross-identify objects by uploading lists of object positions on the sky.

The SDSS anticipates releasing more data in its ongoing celestial census late this year.

Original Source: SDSS News Release

Tracking Diseases from Space

Image credit: NASA
Last year more than a million people died of malaria, mostly in Sub-saharan Africa. Outbreaks of Dengue Fever, hantavirus, West Nile Fever, Rift Valley Fever, and even Plague still occasionally strike villages, towns, and whole regions. To the dozens or hundreds who suffer painful deaths, and to their loved ones, these diseases must seem to spring upon them from nowhere.

Yet these diseases are not without rhyme or reason. When an outbreak occurs, often it is because environmental conditions such as rainfall, temperatures, and vegetation set the stage for a population surge in disease-carrying pests. Mosquitoes or mice or ticks thrive, and the diseases they carry spread rapidly.

So why not watch these environmental factors and warn when conditions are ripe for an outbreak? Scientists have been tantalized by this possibility ever since the idea was first expressed by the Russian epidemiologist E. N. Pavlovsky in the 1960s. Now technology and scientific know-how are catching up with the idea, and a region-wide early warning system for disease outbreaks appears to be within reach.

Ronald Welch of NASA’s Global Hydrology and Climate Center in Huntsville, Alabama, is one of the scientists working to develop such an early warning system. “I have been to malarious areas in both Guatemala and India,” he says. “Usually I am struck by the poverty in these areas, at a level rarely seen in the United States. The people are warm and friendly, and they are appreciative, knowing that we are there to help. It feels very good to know that you are contributing to the relief of sickness and preventing death, especially the children.”

The approach employed by Welch and others combines data from high-tech environmental satellites with old-fashioned, “khaki shorts and dusty boots” fieldwork. Scientists actually seek out and visit places with disease outbreaks. Then they scrutinize satellite images to learn how disease-friendly conditions look from space. The satellites can then watch for those conditions over an entire region, country, or even continent as they silently slide across the sky once a day, every day.

In India, for example, where Welch is doing research, health officials are talking about setting up a satellite-based malaria early warning system for the whole country. In coordination with mathematician Jia Li of the University of Alabama at Huntsville and India’s Malaria Research Center, Welch is hoping to do a pilot study in Mewat, a predominantly rural area of India south of New Delhi. The area is home to more than 700,000 people living in 491 villages and 5 towns, yet is only about two-thirds the size of Rhode Island.

“We expect to be able to give warnings of high disease risk for a given village or area up to a month in advance,” Welch says. “These ‘red flags’ will let health officials focus their vaccination programs, mosquito spraying, and other disease-fighting efforts in the areas that need them most, perhaps preventing an outbreak before it happens.”

Outbreaks are caused by a bewildering variety of factors.

For the mosquito species that carries malaria in Welch’s study area, for example, an outbreak hotspot would have pools of stagnant water where adult mosquitoes can deposit their eggs to mature into new adults. These could be lingering puddles on dense, clay-like soil after heavy rains, swamplands located nearby, or even rain-filled buckets habitually left outside by villagers. A malaria hotspot would be warmer than 18?C, because in colder weather, the single-celled “plasmodium” parasite that actually causes malaria operates too slowly to go through its infection cycle before the host mosquito dies. But the weather mustn’t be too hot, or the mosquitoes would have to hide in the shade. The humidity must hover in the 55% to 75% range that these mosquitoes require for survival. Preferably there would be cattle or other livestock within the mosquitoes’ 1 km flight range, because these pests actually prefer to feed on the blood of animals.

If all of these conditions coincide, watch out!

Documenting some of these factors, such as soil type and local bucket-leaving habits, requires initial groundwork by researchers in the field, Welch notes. This information is plugged into a computerized mapping system called a Geographical Information Systems database (GIS). Fieldwork is also required to characterize how the local species of mosquito behaves. Does it bite people indoors or outdoors or both? Other factors, like the locations of cattle pastures and human dwellings, are inputted into the GIS map based on ultra-high resolution satellite images from commercial satellites like Ikonos and QuickBird, which can spot objects on the ground as small as 80 cm across. Then region-wide variables like temperature, rainfall, vegetation types, and soil moisture are derived from medium-resolution satellite data, such as from Landsat 7 or the MODIS sensor on NASA’s Terra satellite. (MODIS stands for MODerate-resolution Imaging Spectrometer.)

Scientists feed all of this information into a computer simulation that runs on top of a digital map of the landscape. Sophisticated mathematical algorithms chew on all these factors and spit out an estimate of outbreak risk.

The basic soundness of this approach for estimating disease risk has been borne out by previous studies. A group from the University of Nevada and the Desert Research Institute were able to “predict” historical rates of deer-mouse infection by the Sin Nombre virus with up to 80% accuracy, based only on vegetation type and density, elevation and slope of the land, and hydrologic features, all derived from satellite data and GIS maps. A joint NASA Ames / University of California at Davis study achieved a 90% success rate in identifying which rice fields in central California would breed large numbers of mosquitoes and which would breed fewer, based on Landsat data. Another Ames project predicted 79% of the high-mosquito villages in the Chiapas region of Mexico based on landscape features seen in satellite images.

Perfect predictions will likely never be possible. Like weather, the phenomenon of human disease is too complicated. But these encouraging results suggest that reasonably accurate risk estimates can be achieved by combining old-fashioned fieldwork with the newest in satellite technologies.

“All of the necessary pieces of the puzzle are there,” Welch says, offering the hope that soon disease outbreaks that seem to come “from out of nowhere” will catch people off guard much less often.

Original Source: NASA Science Story

Astronomers Find a Second Pluto

Image credit: NASA/JPL
NASA-funded researchers have discovered the most distant object orbiting Earth’s Sun. The object is a mysterious planet-like body three times farther from Earth than Pluto.

“The Sun appears so small from that distance that you could completely block it out with the head of a pin,” said Dr. Mike Brown, California Institute of Technology, Pasadena, Calif., associate professor of planetary astronomy and leader of the research team. The object, called “Sedna” for the Inuit goddess of the ocean, is 13 billion kilometers (8 billion miles) away, in the farthest reaches of the solar system.

This is likely the first detection of the long-hypothesized “Oort cloud,” a faraway repository of small icy bodies that supplies the comets that streak by Earth. Other notable features of Sedna include its size and reddish color. After Mars, it is the second reddest object in the solar system. It is estimated Sedna is approximately three-fourths the size of Pluto. Sedna is likely the largest object found in the solar system since Pluto was discovered in 1930.

Brown, along with Drs. Chad Trujillo of the Gemini Observatory, Hawaii, and David Rabinowitz of Yale University, New Haven, Conn., found the planet-like object, or planetoid, on Nov. 14, 2003. The researchers used the 48-inch Samuel Oschin Telescope at Caltech’s Palomar Observatory near San Diego. Within days, telescopes in Chile, Spain, Arizona and Hawaii observed the object. NASA’s new Spitzer Space Telescope also looked for it.

Sedna is extremely far from the Sun, in the coldest know region of our solar system, where temperatures never rise above minus 240 degrees Celsius (minus 400 degrees Fahrenheit). The planetoid is usually even colder, because it approaches the Sun only briefly during its 10,500-year solar orbit. At its most distant, Sedna is 130 billion kilometers (84 billion miles) from the Sun, which is 900 times Earth’s solar distance.

Scientists used the fact that even the Spitzer telescope was unable to detect the heat of the extremely distant, cold object to determine it must be less than 1,700 kilometers (about 1,000 miles) in diameter, which is smaller than Pluto. By combining available data, Brown estimated Sedna’s size at about halfway between Pluto and Quaoar, the planetoid discovered by the same team in 2002.

The elliptical orbit of Sedna is unlike anything previously seen by astronomers. However, it resembles that of objects predicted to lie in the hypothetical Oort cloud. The cloud is thought to explain the existence of certain comets. It is believed to surround the Sun and extend outward halfway to the star closest to the Sun. But Sedna is 10 times closer than the predicted distance of the Oort cloud. Brown said this “inner Oort cloud” may have been formed by gravity from a rogue star near the Sun in the solar system’s early days.

“The star would have been close enough to be brighter than the full moon, and it would have been visible in the daytime sky for 20,000 years,” Brown explained. Worse, it would have dislodged comets farther out in the Oort cloud, leading to an intense comet shower that could have wiped out some or all forms of life that existed on Earth at the time.

Rabinowitz said there is indirect evidence that Sedna may have a moon. The researchers hope to check this possibility with NASA’s Hubble Space Telescope. Trujillo has begun to examine the object’s surface with one of the world’s largest optical/infrared telescopes, the 8-meter (26-foot) Frederick C. Gillett Gemini Telescope on Mauna Kea, Hawaii. “We still don’t understand what is on the surface of this body. It is nothing like what we would have predicted or what we can explain,” he said.

Sedna will become closer and brighter over the next 72 years, before it begins its 10,500-year trip to the far reaches of the solar system. “The last time Sedna was this close to the Sun, Earth was just coming out of the last ice age. The next time it comes back, the world might again be a completely different place,” Brown said.

NASA’s Jet Propulsion Laboratory, Pasadena, Calif, manages the Spitzer Space Telescope. For more information about the research and images on the Internet, visit http://www.spitzer.caltech.edu/Media/releases/ssc2004-05. For information about NASA on the Internet, visit http://www.nasa.gov.

Original Source: NASA/JPL News Release

Background on the Rover Airbag System

Image credit: NASA/JPL
Here I was: 26 years old, I had never worked on a flight project before, and all eyes were on me. Every time I walked by the Pathfinder project office, Tony Spear, the project manager, would throw his arm around me and announce, “Hey everybody, the whole mission is riding on this guy right here.”

Our task was to design and build airbags for Pathfinder’s landing on Mars an approach that had never been used on any mission. Airbags may seem like a simple, low-tech product, but it was eye-opening to discover just how little we knew about them. We knew that the only way to find out what we needed to learn was to build prototypes and test them. We just didn’t know how ignorant we were going to be.

Airbags seemed like a crazy idea to a lot of people. Nobody ever said that, mind you, but there seemed to be a widespread feeling that the airbags weren’t going to work. “We’ll let you guys go off and fool around until you fall flat on your faces.” That was the unspoken message I received day after day.

Everyone’s main fear about using these giant airbags was that the lander would be buried in an ocean of fabric when the airbags deflated. I began the search for a solution by building scale models of the airbags and lander, and I played with them in my office for a couple of months.

I built the models out of cardboard and plastic, and taped them up with packing tape I got from the hardware store and ribbon from the fabric store. I used a small raft inflator that I had at home to pump up my model airbags. Over and over again, I filled the miniature airbags and then let them deflate, watching what happened.

I fooled around with a dozen or more approaches before I finally came up with something that I thought worked. Slowly but surely, I came up with the idea of using cords that zigzag through belt loops inside the airbags. Pull the cords a certain way, and the cords would draw in all of the fabric and contain it. Wait to open the lander until after all of the airbags had retracted, and the fabric would be tucked neatly underneath.

Testing on another scale
Once we built large-scale models to conduct drop tests, we started by doing simple vertical drops, first at 30 feet, and then up to 70 feet. The bags performed well, although the way they bounced like a giant ball was interesting to observe. People began to realize that the concept might just be reasonably sound. But we still had our doubters. Even after we had the mechanics figured out for the airbags, a big question remained: What about the rocky Martian terrain?

Landing on Mars, we had to accept whatever Mother Nature gave us. The Pathfinder wouldn’t have a landing strip. To simulate conditions on Mars, we brought in large lava rocks the size of a small office desk. They were real lava rocks that our geologists had gone out and picked; if you tried to handle one of them, you would cut up your hands.

The more landscape simulations we tested, the more we started tearing up the airbags. Things were not looking good. Once again, we realized that this was an area that we just didn’t understand. The challenge was to protect the bladder layer, essentially the inner tube of the airbag system, with as little fabric as possible because the project could not afford to just throw mass at the problem. We tried material after material heavy duty Kevlars and Vectrans among them applying them in dozens of different configurations to the outside of the airbag.

Ultimately, we knew that we could just throw on more and more material and come up with a reasonably performing airbag system, but the weight of that solution would have come at the expense of something else another component of Pathfinder would have to be sacrificed. We weren’t, however, going to Mars just to land there and take a few pictures. We wanted to go there and do science and we needed instruments to do that science. So there was a lot of motivation to come up with the lowest-mass, highest-performance airbag system that we could.

5, 4, 3, 2, 1
Each test became like a ritual, because it took between eight and ten hours to prepare the system including transporting the airbags into the vacuum chamber, getting all of the instrumentation wired up, raising the airbags up to the top of the chamber, making sure all the rocks were in the right place, and preparing the nets.

The vacuum chamber where we did the drop tests used so much power that we were only able to test in the middle of the night. Once the doors of the vacuum chamber were closed, it took three or four hours just to pump down the chamber. At that point, everybody either broke for dinner or went to relax for a while, before coming back at midnight or whatever the appointed hour was. Then we had another 45 minutes of going over all of the instrumentation, going through checklists, and then ultimately the countdown.

The last 30 seconds of the countdown were excruciating. All of that anticipation, and then the whole impact lasted less than one second.

When we finished a drop test, we knew right away whether it was a success or failure. Brian Muirhead, the flight systems manager, was always insistent that I call him immediately-no matter how late it was. At 4 a.m., I would call him at his home and have to give him the news, “Brian, we failed another test.”

Each test was followed by a high-pressure rush to figure out what went wrong, what test to run next, how to fix the extensively damaged bags, and how to simultaneously incorporate whatever new “experimental fix” we came up with. As a team, we agreed upon a course of action, usually in a surly, sleep-deprived mood over a greasy breakfast at a local diner. Then the ILC Dover folks would figure out any new patterns that needed to be generated as well as the detailed engineering to ensure the seams and stitch designs could handle the test loads. Our hero was our lead sewer, who incidentally sewed Neil Armstrong and Buz Aldren’s moon suits. She worked under less-than-ideal conditions while we slept and turned our sometimes unusual ideas into reality. Usually by the next day we were ready to do it all over again.

Tony Spear and Brian understood the challenges we were facing. They knew we had a solid team working on this, and I always kept them informed on the technical progress. They were always understanding, but that’s not to say they were always happy.

Back to the drawing board
We said, “Okay, let’s start doing analysis, computer modeling of the airbags and the impact against the rocks.” At the same time, we expanded our test program to understand how to optimize this airbag abrasion layer.

It turned out that the time, money, and effort we expended on the computer modeling didn’t pay off. Though we ran the most sophisticated programs available back in 1993 and 1994, the results didn’t help us design the abrasion layer. We had to rely on our prototypes.

After doing dozens of drop tests, looking at the data, and studying what was happening, we started to realize that a single layer of heavy material wasn’t the solution. Multiple layers of lightweight material might prove stronger.

We were forced to decide on the final abrasion layer design in order to meet our scheduled Qualification drop tests. In spacecraft terms, this is supposed to be the last test that you run in order to qualify your final design. By the time you get to that point, there is supposed to be no question whatsoever that you have a fully functioning system that meets all of the mission requirements. It is supposed to be a check-the-box process that the system is ready for flight. The problem was that at that point we had still only experienced partial success; we’d never had that A+, 100% grade on any of our drop tests.

Flying in to watch that last drop test, my plane was delayed. One of my colleagues at the test facility called and asked me, “Do you want us to wait for you?” I told him, “No, go ahead.”

When I got to the facility, the test crew wasn’t there. I went into the control room and ran into the guy who processes the videotapes. “So what happened?” I asked him. “Did you guys do the test?” He pointed at a VCR and said, “The video is in there. Just go ahead and press play.”

So, I hit play. Down comes the airbag in the video it hits the platform and explodes catastrophically. My heart sank. We weren’t going to make it. But then I realized that there was something strangely familiar about the video I had just watched. In an instant it came to me; they had put in the videotape from our worst drop test. The practical joke could mean only one thing: We had had a successful drop test, and were finally good to go.

Original Source: NASA/JPL Story