Mars Express Radar Deployment Delayed

Image credit: ESA
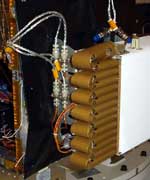
The MARSIS team has advised ESA to delay the deployment of the MARSIS radar instrument on board Mars Express, scheduled for this week.

New and improved computer models suggest that, during deployment, the radar booms may swing back and forth with larger amplitudes than previously expected. If this happened, the booms might come too close to delicate components of the spacecraft body. Further simulations and tests are under way to better understand the situation.

The two main radar booms are 20-metre long hollow cylinders, of 2.5 centimetres diameter, folded up in a box like a concertina (accordion). When the box is opened, the elastic energy of the compressed glass-fibre booms will let them unfold like a jack-in-the-box.

After the booms spring out, they will eventually lock in a straight line, taking up the shape that they had before being folded into the box. The deployment procedure of each boom is expected to last about 10 minutes.

Simulations carried out four years ago by the radar boom’s manufacturer, Astro Aerospace, California, USA, indicated that the deployment should be smooth, without significantly swinging back and forth. However, the radar team has now advised ESA that a new and refined analysis of the boom dynamics indicates that a sort of “backlash” might take place before the boom locks into its position.

Although a successful deployment is not in question, Mars Express mission managers want to make sure that the booms are not subjected to excessive mechanical stress and that they do not interfere with the spacecraft as they deploy.

The MARSIS team and their industrial contractors are now performing further tests and simulations to confirm that the deployment will have no impact on the safety of the spacecraft. These simulations will then be reviewed by ESA’s experts. Based on the results, expected within a few weeks, ESA will decide when and how to activate MARSIS.

MARSIS will study the sub-surface of Mars to a depth of a few kilometres. The instrument’s antennas will send radio waves towards the planet and analyse how they are reflected by any surface that they encounter. In this way, MARSIS can investigate the sub-surface mineralogical composition and will reveal the presence of any underground reservoir of water or ice.

Original Source: ESA News Release

Saturn in Full Colour

Image credit: NASA/JPL/Space Sciences
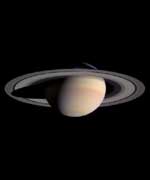
Saturn and its rings completely fill the field of view of Cassini’s narrow angle camera in this natural color image taken on March 27, 2004. This is the last single `eyeful’ of Saturn and its rings achievable with the narrow angle camera on approach to the planet. From now until orbit insertion, the rings will be larger than the camera’s field of view. The image is a composite of three exposures in red, green, and blue, taken when the spacecraft was 47.7 million kilometers (29.7 million miles) from the planet. The image scale is 286 kilometers (178 miles) per pixel.

Color variations between atmospheric bands and features in the southern hemisphere of the planet, as well as subtle color differences across Saturn’s middle B ring, are now more distinct than ever. Color variations generally imply different compositions. The nature and causes of any compositional differences in both the atmosphere and the rings are major questions to be investigated by Cassini scientists as the mission progresses.

The bright blue sliver of light in the northern hemisphere is sunlight passing through the Cassini Division in Saturn’s rings and being scattered by the cloud-free upper atmosphere.

Two faint dark spots are visible in the southern hemisphere. These spots are close to the latitude where Cassini saw two storms merging in mid-March. The fate of the storms visible here is unclear. They are getting close and will eventually merge or squeeze past each other. Further analysis of such dynamic systems in Saturn’s atmosphere will help scientists understand their origins and complex interactions.

Moons visible in this image are (clockwise from top right): Enceladus (499 kilometers, 310 miles across), Mimas (398 kilometers, 247 miles across), Tethys (1060 kilometers, 659 miles across), and Epimetheus (116 kilometers, 72 miles across). Epimetheus is dim and appears just above the left edge of the rings. Brightnesses have been exaggerated to aid visibility.

The Cassini-Huygens mission is a cooperative project of NASA, the European Space Agency and the Italian Space Agency. The Jet Propulsion Laboratory, a division of the California Institute of Technology in Pasadena, manages the Cassini-Huygens mission for NASA’s Office of Space Science, Washington, D.C. The imaging team is based at the Space Science Institute, Boulder, Colorado.

For more information about the Cassini-Huygens mission, visit http://saturn.jpl.nasa.gov and the Cassini imaging team home page, http://ciclops.org.

Original Source: CICLOPS News Release

ESO Images Cosmic Collision

Image credit: ESO
Stars like our Sun are members of galaxies, and most galaxies are themselves members of clusters of galaxies. In these, they move around among each other in a mostly slow and graceful ballet. But every now and then, two or more of the members may get too close for comfort – the movements become hectic, sometimes indeed dramatic, as when galaxies end up colliding.

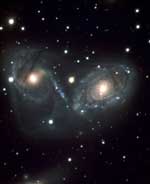
ESO shows an example of such a cosmic tango. This is the superb triple system NGC 6769-71, located in the southern Pavo constellation (the Peacock) at a distance of 190 million light-years.

This composite image was obtained on April 1, 2004, the day of the Fifth Anniversary of ESO’s Very Large Telescope (VLT). It was taken in the imaging mode of the VIsible Multi-Object Spectrograph (VIMOS) on Melipal, one of the four 8.2-m Unit Telescopes of the VLT at the Paranal Observatory (Chile). The two upper galaxies, NGC 6769 (upper right) and NGC 6770 (upper left), are of equal brightness and size, while NGC 6771 (below) is about half as bright and slightly smaller. All three galaxies possess a central bulge of similar brightness. They consist of elderly, reddish stars and that of NGC 6771 is remarkable for its “boxy” shape, a rare occurrence among galaxies.

Gravitational interaction in a small galaxy group
NGC 6769 is a spiral galaxy with very tightly wound spiral arms, while NGC 6770 has two major spiral arms, one of which is rather straight and points towards the outer disc of NGC 6769. NGC 6770 is also peculiar in that it presents two comparatively straight dark lanes and a fainter arc that curves towards the third galaxy, NGC 6771 (below). It is also obvious from this new VLT photo that stars and gas have been stripped off NGC 6769 and NGC 6770, starting to form a common envelope around them, in the shape of a Devil’s Mask. There is also a weak hint of a tenuous bridge between NGC 6769 and NGC 6771. All of these features testify to strong gravitational interaction between the three galaxies. The warped appearance of the dust lane in NGC 6771 might also be interpreted as more evidence of interactions.

Moreover, NGC 6769 and NGC 6770 are receding from us at a similar velocity of about 3800 km/s – a redshift just over 0.01 – while that of NGC 6771 is slightly larger, 4200 km/s.

A stellar baby-boom
As dramatic and destructive as this may seem, such an event is also an enrichment, a true baby-star boom. As the Phoenix reborn from its ashes, a cosmic catastrophe like this one normally results in the formation of many new stars. This is obvious from the blueish nature of the spiral arms in NGC 6769 and NGC 6770 and the presence of many sites of star forming regions.

Similarly, the spiral arms of the well-known Whirlpool galaxy (Messier 51) may have been produced by a close encounter with a second galaxy that is now located at the end of one of the spiral arms; the same may be true for the beautiful southern galaxy NGC 1232 depicted in another VLT photo (PR Photo 37d/98).

Nearer to us, a stream of hydrogen gas, similar to the one seen in ESO PR Photo 12/04, connects our Galaxy with the LMC, a relict of dramatic events in the history of our home Galaxy. And the stormy time is not yet over: now the Andromeda Galaxy, another of the Milky Way neighbours in the Local Group of Galaxies, is approaching us. Still at a distance of over 2 million light-years, calculations predict that it will collide with our galaxy in about 6,000 million years!

Original Source: ESO News Release

Spirit Closes in on Columbia Hills

Image credit: NASA/JPL
NASA’s Mars Exploration Rover Spirit took more panoramic camera images of the “Columbia Hills” as it continued its long trek across the Gusev Crater floor. Spirit is still approximately 2 kilometers (1.2 miles) and 52 sols away from its destination at the western base of the hills.

Once Spirit reaches the base, scientists and rover controllers will re-analyze the terrain and determine whether to send the rover up the mountain. Another option will be to send Spirit south along the base where she may encounter outcrops as indicated by orbital images from the Mars Orbiter Camera on the Mars Global Surveyor spacecraft.

Finding outcrops has become a surprise target for some mission scenarios, mainly because they can represent the geological timeline of an area if exposing bedrock. Unlike other parts of the surface, bedrock shows materials not transported from somewhere else by dust and wind.

Meanwhile on the other side of the planet, the Mars Exploration Rover Opportunity has broken another mission record, this time drilling the deepest hole ground into a rock on another planet. While only 7.2-millimeter (about 0.28-inch) deep into the rock “Pilbara,” the rover’s grinding power has proven valuable to getting at least below the first weathered layer.

The now familiar “blueberries,” or spherules, are present in this rock, however, they do not appear in the same manner as other berries examined during this mission. Reminiscent of a golf tee, the blueberries sit atop a “stem,” thus making them even more of an obstacle through which to grind.

The plains appear to be uniform in character from the rover’s current position all the way to Endurance Crater. Granules of various sizes blanket the plains. Those same spherical granules fancifully called blueberries are present – some intact and some broken. Larger granules pave the surface, while smaller grains, including broken blueberries, form small dunes. Randomly distributed 1-centimeter (0.4 inch) sized pebbles make up a third type of feature on the plains. The pebbles’ composition remains to be determined.

Examination of this part of Mars by NASA’s Mars Global Surveyor orbiter revealed the presence of hematite, which led NASA to choose Meridiani Planum as Opportunity’s landing site. The rover science conducted on the plains of Meridiani Planum serves to integrate what the rovers are seeing on the ground with what orbital data have shown.

The hole left by the rock abrasion tool after two hours and 16 minutes of grinding was 7.2 millimeters (about 0.28 inches) deep and 4.5 centimeters (about 1.8 inches) in diameter. The tool swept the hole clean after grinding, leaving the ring of cuttings around the hole.

The team has developed a new approach to commanding the rock abrasion tool that allows for more aggressive grinding parameters. The tool is now programmed, in the event of a stall, to retreat from its target and attempt to grind again. This allows the grinder to essentially reset itself instead of aborting its sequence altogether and waiting for further commands from rover planners.

Original Source: Astrobiology Magazine

Space Station Gyro Breaks Down

A gyroscope failed on board the International Space Station Wednesday evening, but NASA says that it doesn’t pose a risk to astronaut safety. The gyroscope failed only hours after the hatch was opened between the station and the Soyuz capsule carrying three astronauts. The station’s four gyroscopes are designed to keep it oriented properly in space, but it can still work with only one functioning gyro. Even if that fails, the station can use maneuvering jets on the attached Soyuz capsules for keeping position. A previous gyro broke a year ago, and it was supposed to have been repaired, but the Columbia disaster put this on hold.

Gravity Probe B is Working Fine

Image credit: NASA
Gravity Probe B ? a NASA mission to test two predictions of Albert Einstein’s Theory of General Relativity ? is orbiting 400 miles above Earth, and all spacecraft systems are performing well. Its solar arrays are generating power, and all electrical systems are powered on. The spacecraft is communicating well with its supporting satellite relay and ground stations. Launched April 20 from Vandenberg Air Force Base, Calif., Gravity Probe B is managed by the Marshall Center.

At 9:57:24 am Pacific Daylight Time on Tuesday, April 20, 2004, the Gravity Probe B spacecraft had a picture-perfect launch from Vandenberg Air Force Base in South-central California. The Boeing Delta II rocket hit the exact center of the bull’s eye in placing the spacecraft in its target polar orbit, 400 miles above the Earth.

“The Gravity Probe B Mission Operations Team has performed very well during this critical spacecraft activation period,” said Tony Lyons, Gravity Probe B NASA Deputy Program Manager from Marshall Space Flight Center in Huntsville, Ala.

“We’re ecstatic,” said Stanford Gravity Probe B Program Manager, Gaylord Green. “We couldn’t have asked for a better or more beautiful launch-nor a more perfect orbit insertion.”

At approximately one hour eleven minutes, the spacecraft’s solar arrays deployed, and shortly thereafter, the on-board cameras treated all viewers, via NASA TV, to the extraordinary sight of the separation of the spacecraft from the second stage rocket, with a portion of the Earth illuminated in the background.

After two days in orbit, all Gravity Probe B systems are performing as planned. The solar arrays are generating power, and all electrical systems are powered on. The spacecraft is communicating well with the Tracking and Data Relay Satellite System (TDRSS) and supporting ground stations.

All four Gyro Suspension Systems have now been activated. In addition, a lift check was successfully accomplished for gyros #2 and #3. “We’ve successfully achieved the first of many upcoming steps in preparing these four gyroscopes for science data collection,” said Rob Brumley, Stanford Gravity Probe B Deputy Program Manager, Technical. “We are all extremely gratified with the initial performance of these gyroscopes in space, including the first ever levitation of a Gravity Probe B gyro on orbit.”

The spacecraft’s Attitude Control System is maintaining initial attitude control. Fine attitude control should be achieved when thruster calibrations have been completed. After that, the ultra-precise science telescope will be locked onto the Gravity Probe B guide star, IM Pegasi, to within a range of 1/100,000th of a degree.

“All of us on the GP-B team are very grateful for the tremendous support we have received from NASA, Lockheed Martin, Boeing, and many others,” said Francis Everitt, Gravity Probe B Principal Investigator at Stanford University. “We’re off to a fine start, but we now have a great sense of responsibility to make sure we do the science in the best possible way.”

The spacecraft is being controlled from the Gravity Probe B Mission Operations Center, located at Stanford University. The Initialization & Orbit Checkout (IOC) phase of the Gravity Probe B mission is planned to last 45-60 days, after which the 12-month science data collection will begin. This will be followed by a two-month final calibration of the science instrument assembly.

NASA’s Gravity Probe B mission, also known as GP-B, will use four ultra-precise gyroscopes to test Einstein’s theory that space and time are distorted by the presence of massive objects. To accomplish this, the mission will measure two factors — how space and time are warped by the presence of the Earth, and how the Earth’s rotation drags space-time around with it.

NASA’s Marshall Space Flight Center in Huntsville, Ala., manages the Gravity Probe B program for NASA’s Office of Space Science. Stanford University in Stanford, Calif., developed and built the science experiment hardware and operates the science mission for NASA. Lockheed Martin of Palo Alto, Calif., developed and built the GP-B spacecraft.

For supporting materials for this news release – such as photographs, fact sheets, video and audio files and more – please visit the NASA Marshall Center Newsroom Web site at:

Marshall Space Flight Center

Original Source: NASA News Release

Arctic Ice Formation is More Complex Than Previously Thought

Image credit: NASA/JPL
Contrary to historical observations, sea ice in the high Arctic undergoes very small, back and forth movements twice a day, even in the dead of winter. It was once believed ice deformation at such a scale was almost non-existent.

According to a recent NASA-funded study, the finding is significant. Such movements may substantially increase the production of new ice and should be factored into Arctic climate models. The phenomenon of short-period Arctic sea ice motion was investigated in detail in 1967 and has been the subject of numerous research studies since.

A 1978 study found short-period ice motions disappeared almost entirely during the winter once the Arctic Ocean froze. A subsequent investigation in 2002, conducted using measurements from ocean buoys spaced hundreds of kilometers apart, found sea ice movement occurs during all seasons.

Since buoy observations are poor for understanding short-length-scale motion and deformation, researchers Ron Kwok and Glenn Cunningham of NASA’s Jet Propulsion Laboratory, Pasadena, Calif., and William Hibler III of the University of Alaska, Fairbanks, set out to examine the phenomenon in greater detail.

The researchers used high-resolution synthetic aperture radar imagery from Canada’s RADARSAT Earth observation satellite, which can image the region up to five times a day. Their findings were published recently in Geophysical Research Letters. The researchers studied an approximate 200 by 200 kilometer (124 by 124 mile) area in the Canada Basin region of the high Arctic for about three weeks in May 2002 and in February 2003.

This region is representative of the behavior of the central Arctic Ocean ice cover due to its location and thickness. The time frame was selected because Arctic sea ice motion is least expected during those times of year.

The study provided a more detailed picture of the phenomenon reported in the 2002 buoy research. It found sea ice moved back and forth and deformed slightly in a persistent 12-hour oscillating pattern. Subtle motions triggered by the Earth’s rotation rather than by tidal movement likely caused the pattern. In the absence of external forces, any object will move in a circular motion due to the Earth’s rotation. The researchers attributed the winter behavior of the ice cover, not observed in studies before 1970, to either a previous lack of detailed data or perhaps an indication of recent thinning of the Arctic ice cover.

“If Arctic pack ice is continually opening and closing during the Arctic winter on a widespread basis, it could significantly increase the rate of Arctic ice production and therefore increase the total amount of ice in the Arctic,” Kwok said. “A simple simulation of this ice production process shows that it can account for an equivalent of 10 centimeters (4 inches) of ice thickness over 6 months of winter. That’s approximately 20 percent of the base growth of thick ice during the central Arctic winter.”

Kwok said current models of the dynamics of Arctic sea ice typically don’t take into account processes occurring at short, 12-hour time scales, and the impact of such processes must be assessed. “As climate models continue to get better and better, it becomes increasingly important to understand the physics of small-scale processes so that we can understand their large-scale consequences,” he said. “If these Arctic sea ice processes are indeed important over the entire Arctic basin, their contribution to the overall amount of ice in the Arctic should be included in simulations of the interactions that take place between the Arctic’s ice, ocean and atmosphere to create the overall Arctic climate.

“If such oscillations in Arctic sea ice increase as the sea ice cover thins due to warmer atmospheric temperatures, then this mechanism of ice production may actually serve to slow down the overall depletion of ice in the Arctic Ocean,” he added. Kwok said other parts of the Arctic Ocean would be analyzed in future studies.

For more information about the study on the Internet, visit http://www.earth.nasa.gov/flash_top.html.

For information about NASA on the Internet, visit http://www.nasa.gov/home/index.html.

JPL is managed for NASA by the California Institute of Technology in Pasadena.

Original Source: NASA/JPL News Release

Another Gathering of Planets

Image credit: NASA
It’s happening again: the Moon and a bunch of planets are gathering in the evening sky.

Unlike last month, when five bright planets (including Mercury) were visible, this time there are only four: Venus, Mars, Saturn and Jupiter. Four is plenty, though. Using only your eyes and, if you have one, a small telescope, you’ll be able to see some wondrous things.

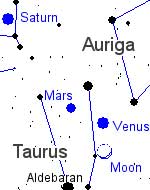
The show begins on Thursday, April 22nd. Step outside after nightfall and look west. The first thing you’ll notice is piercing-bright Venus and, not far below it, the delicate crescent Moon. These are the two brightest objects in the night sky, pleasingly close together. Mars is there, too, albeit not much brighter than an ordinary star. You can find it just above Venus, at one vertex of a Moon-Mars-Venus isosceles triangle.

Point a telescope at Venus and ? it looks just like the Moon! Well, almost. Because it lies between Earth and the Sun, Venus has phases just as our Moon does. At the moment Venus is a fat crescent. It’s colored gray-white, very Moon-like, but unlike the Moon, Venus is featureless. Thick uniform clouds hide the planet’s surface; the most powerful telescopes on Earth can’t penetrate them.

The crescent Moon is more fun to look at through a telescope. Low-slanting rays from the sun cast long shadows from lunar mountains. You can see impact craters, valleys and rilles ? all cast into sharp relief.

Can you also see a ghostly glow across the Moon’s dark terrain? For millennia the glow was a mystery, until Leonardo da Vinci figured it out in the 16th century. It is sunlight reflected from Earth onto the Moon. Modern astronomers call the glow Earthshine, and it’s one of the loveliest sights in the heavens–no telescope required.

The triangle shifts on Friday, April 23rd, as the Moon moves past Venus to a spot right beside Mars. This is the best night to find Mars, dim and red, using the Moon as a guidepost. Seen through a telescope Mars is not very impressive, not like it was in August 2003 when the planet made a historic close approach to Earth.

On Saturday, April 24th, the Moon glides away from Mars and toward Saturn, which looks like a bright yellow star. With the Moon beside Saturn to mark its location, you can’t miss it. Point your telescope at Saturn: Even a small ‘scope will show the planet’s lovely rings and it’s biggest moon Titan.

The NASA-ESA Cassini spacecraft is en route to Saturn now, due to arrive in July. Cassini will orbit for four years, studying Saturn’s rings, weather and magnetic field. Cassini will also drop a probe named Huygens through the thick orange clouds of Titan to discover what lies beneath.

Titan is one of the most mysterious worlds in the solar system. It has a nitrogen atmosphere denser than Earth’s and clouds laced with organic compounds. Some researchers believe there might be puddles, lakes or even oceans of liquid hydrocarbons sloshing around on the surface. These are places where organic molecules might get together for the first stirrings of simple life.

Through a backyard telescope Titan looks like an 8th magnitude star, an unremarkable pinprick. In fact, Titan is bigger than Mercury and Pluto. If it orbited the sun it would surely be considered a planet. What do the clouds of Titan hide? It’s something to think about while you’re peering through the eyepiece.

Finally on Thursday, April 29th, the Moon glides by Jupiter. You’ve probably noticed Jupiter before: it hangs almost directly overhead at sunset and outshines everything in the sky except Venus and the Moon. The Moon and Jupiter side by side are a pleasing sight.

Look at Jupiter through a telescope and you’ll see the planet’s rust-colored cloud belts and its four largest moons: Io, Europa, Callisto, and Ganymede. You might also see the Great Red Spot–a hurricane twice as wide as Earth and at least 100 years old. On April 29th it will be crossing Jupiter’s middle (as seen from Earth) at 09:12 p.m. PDT or 04:12 UT on April 30th.

Four planets, six moons, Earthshine, lunar mountains, the phases of Venus, a planet-sized hurricane and Saturn’s rings: Mark your calendar and see them all before April is done.

Original Source: NASA Science Story

Arecibo Gets an Upgrade

Image credit: Cornell
The Arecibo Observatory telescope, the largest and most sensitive single dish radio telescope in the world, is about to get a good deal more sensitive.

Today (Wednesday, April 21) the telescope got a new “eye on the sky” that will turn the huge dish, operated by Cornell University for the National Science Foundation, into the equivalent of a seven-pixel radio camera.

The complex new addition to the Arecibo telescope was hauled 150 meters (492 feet) above the telescope’s 1,000-foot-diameter (305 meters) reflector dish starting in the early morning hours. The device, the size of a washing machine, took 30 minutes to reach a platform inside the suspended Gregorian dome, where ultimately it will be cooled and then connected to a fiber optic transmission system leading to ultra-high speed digital signal processors. The new instrument is called ALFA (for Arecibo L-Band Feed Array) and is essentially a camera for making radio pictures of the sky. ALFA will conduct large-scale sky surveys with unprecedented sensitivity, enabling astronomers to collect data about seven times faster than at present, giving the telescope an even broader appeal to astronomers.

The ALFA receiver was built by the Australian research group, Commonwealth Scientific & Industrial Research Organisation, under contract to the National Astronomy and Ionosphere Center (NAIC) at Cornell, in Ithaca, N.Y. Development of ALFA was overseen by the observatory’s technical staff. The rest of the ALFA system, including ultra-fast data processing machines, are under development at NAIC.

Radio telescopes traditionally have been limited to seeing just one spot — a single pixel — on the sky at once. Pictures of the sky have been built up by painstakingly imaging one spot after another. But ALFA lets the telescope see seven spots — seven pixels — on the sky at once, slashing the time needed to make all-sky surveys. Steve Torchinsky, ALFA project manager at Arecibo Observatory, says the new device will make it possible to find many new fast-spinning, highly dense stars called pulsars and will improve the chances of picking up very rare kinds of systems — for instance, a pulsar orbiting a black hole.

It also will map the neutral hydrogen gas in our galaxy, the Milky Way, as well as in other galaxies. Hydrogen is the most abundant element in the universe. “A whole range of science is planned for ALFA, ” says Torchinsky. “Arecibo’s large collecting area is particularly well-suited to pulsar studies.”

NAIC commissioned CSIRO to build ALFA following the success of a ground-breaking “multibeam” instrument it had designed and built for the Parkes radio telescope in eastern Australia. That instrument increased the Parkes telescope’s view 13-fold, making it practical for the first time to search the whole sky for faint and hidden galaxies.

Original Source: Cornell News Release

Saturn in Four Wavelengths

Image credit: NASA/JPL/Space Science Institute
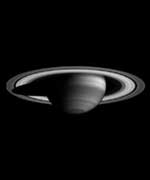
A montage of Cassini images, taken in four different regions of the electromagnetic spectrum from the ultraviolet to the near-infrared, demonstrates that there is more to Saturn than meets the eye.

The pictures show the effects of absorption and scattering of light at different wavelengths by both atmospheric gas and clouds of differing heights and thicknesses. They also show absorption of light by colored particles mixed with white ammonia clouds in the planet’s atmosphere. Contrast has been enhanced to aid visibility of the atmosphere.

Cassini’s narrow-angle camera took these four images over a period of 20 minutes on April 3, 2004, when the spacecraft was 44.5 million kilometers (27.7 million miles) from the planet. The image scale is approximately 267 kilometers (166 miles) per pixel. All four images show the same face of Saturn.

In the upper left image, Saturn is seen in ultraviolet wavelengths (298 nanometers); at upper right, in visible blue wavelengths (440 nanometers); at lower left, in far red wavelengths just beyond the visible-light spectrum (727 nanometers); and at lower right, in near-infrared wavelengths (930 nanometers).

All gases scatter sunlight efficiently at short wavelengths. That’s why the sky on Earth is blue. The effect is more pronounced in the ultraviolet than in the visible. On Saturn, helium and molecular hydrogen gases scatter ultraviolet light strongly, making the atmosphere appear bright. Only high altitude cloud particles, which tend to absorb ultraviolet light, appear dark against the bright background, explaining the dark equatorial band in the upper left ultraviolet image. The contrast is reversed in the lower left image taken in a spectral region where light is absorbed by methane gas but scattered by high clouds. The equatorial zone in this image is bright because the high clouds there reflect this long wavelength light back to space before much of it can be absorbed by methane.

Scattering by atmospheric gases is less pronounced at visible blue wavelengths than it is in the ultraviolet. Hence, in the top right image, the sunlight can make its way down to deeper cloud layers and back to the observer, and the high equatorial cloud particles, which are reflective at visible wavelengths, also are apparent. This view is closest to what the human eye would see. At bottom right, in the near-infrared, some methane absorption is present but to a much lesser degree than at 727 nanometers. Scientists are not certain whether the contrasts here are produced mainly by colored particles or by latitude differences in altitude and cloud thickness. Data from Cassini should help answer this question.

The sliver of light seen in the northern hemisphere appears bright in the ultraviolet and blue (top images) and is nearly invisible at longer wavelengths (bottom images). The clouds in this part of the northern hemisphere are deep, and sunlight is illuminating only the cloud-free upper atmosphere. The shorter wavelengths are consequently scattered by the gas and make the illuminated atmosphere bright at these wavelengths, while the longer wavelengths are absorbed by methane.

Saturn’s rings also appear noticeably different from image to image, whose exposure times range from two to 46 seconds. The rings appear dark in the 46-second ultraviolet image because they inherently reflect little light at these wavelengths. The differences at other wavelengths are mostly due to the differences in exposure times.

The Cassini-Huygens mission is a cooperative project of NASA, the European Space Agency and the Italian Space Agency. The Jet Propulsion Laboratory, a division of the California Institute of Technology in Pasadena, manages the Cassini-Huygens mission for NASA’s Office of Space Science, Washington, D.C. The Cassini orbiter and its two onboard cameras, were designed, developed and assembled at JPL. The imaging team is based at the Space Science Institute, Boulder, Colorado

For more information about the Cassini-Huygens mission, visit http://saturn.jpl.nasa.gov and the Cassini imaging team home page, http://ciclops.org.

Original Source: CICLOPS News Release