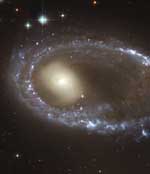
Wallpaper: Galaxy with a Ring of Star Formation

Image credit: Hubble
Resembling a diamond-encrusted bracelet, a ring of brilliant blue star clusters wraps around the yellowish nucleus of what was once a normal spiral galaxy in this new image from NASA’s Hubble Space Telescope (HST). This image is being released to commemorate the 14th anniversary of Hubble’s launch on April 24, 1990 and its deployment from the space shuttle Discovery on April 25, 1990.

The sparkling blue ring is 150,000 light-years in diameter, making it larger than our entire home galaxy, the Milky Way. The galaxy, cataloged as AM 0644-741, is a member of the class of so- called “ring galaxies.” It lies 300 million light-years away in the direction of the southern constellation Dorado.

Ring galaxies are an especially striking example of how collisions between galaxies can dramatically change their structure, while also triggering the formation of new stars. They arise from a particular type of collision, in which one galaxy (the “intruder”) plunges directly through the disk of another one (the “target”). In the case of AM 0644-741, the galaxy that pierced through the ring galaxy is out of the image but visible in larger-field images. The soft spiral galaxy that is visible to the left of the ring galaxy in the image is a coincidental background galaxy that is not interacting with the ring.

The resulting gravitational shock imparted due to the collision drastically changes the orbits of stars and gas in the target galaxy’s disk, causing them to rush outward, somewhat like ripples in a pond after a large rock has been thrown in. As the ring plows outward into its surroundings, gas clouds collide and are compressed. The clouds can then contract under their own gravity, collapse, and form an abundance of new stars.

The rampant blue star formation explains why the ring is so blue: It is continuously forming massive, young, hot stars, which are blue in color. Another sign of robust star formation is the pink regions along the ring. These are rarefied clouds of glowing hydrogen gas, fluorescing because of the strong ultraviolet light from the newly formed massive stars.

Anyone who lives on planets embedded in the ring would be treated to a view of a brilliant band of blue stars arching across the heavens. The view would be relatively short-lived because theoretical studies indicate that the blue ring will not continue to expand forever. After about 300 million years, it will reach a maximum radius, and then begin to disintegrate.

The Hubble Heritage Team used the Hubble Advanced Camera for Surveys to take this image in January 2004. The team used a combination of four separate filters that isolate blue, green, red, and near-infrared light to create the color image.

The Space Telescope Science Institute (STScI) is operated by the Association of Universities for Research in Astronomy, Inc. (AURA), for NASA, under contract with the Goddard Space Flight Center, Greenbelt, MD. The Hubble Space Telescope is a project of international cooperation between NASA and the European Space Agency (ESA).

Original Source: Hubble News Release

Not Getting the Newsletter?

In theory, I send out Universe Today every weekday (Mon-Fri) some time during the day. I do occasionally miss a day, but for the last year or so, that’s been pretty rare. If you find the newsletter just stops coming, you should be suspicious that your Internet service provider has gotten a little over-zealous in its attempts to block SPAM. This newsletter has images in it, and allows you to unsubscribe – and these are also key features of a lot of unsolicited mail.

So, if Universe Today doesn’t show up in your mailbox, wait a couple of days and then check the website. If the homepage hasn’t been updated, then it means I’m not working on the website… bad Fraser! But if I am being industrious and the homepage is current, that means the newsletter is going out. Time for you to nag your Internet service provider.

Check to see if the email is being dumped into your junk mail folder. It’s got a different name in Hotmail, AOL, Yahoo, etc. If it’s not there, you should have some way make sure that mail from me is never considered SPAM. If that doesn’t seem to be working, you’ll have to contact your ISP through email or on the phone and let them know that you really miss your subscription to Universe Today. Send me an email and I can try and work on them from my end as well.

Thanks!

Fraser Cain
Publisher
Universe Today

P.S. I’ve getting reports from Yahoo folks that the newsletter is being blocked as of April 14th. If anyone knows what happened, please enlighten me so I can fix it.

Are Jupiter’s Spots Disappearing?

Image credit: NASA/JPL
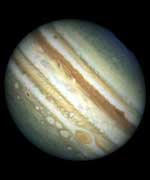
If a University of California, Berkeley, physicist’s vision of Jupiter is correct, the giant planet will be in for a major global temperature shift over the next decade as most of its large vortices disappear.

But fans of the Great Red Spot can rest easy. The most famous of Jupiter’s vortices – which are often compared to Earth’s hurricanes – will stay put, largely because of its location near the planet’s equator, says Philip Marcus, a professor at UC Berkeley’s Department of Mechanical Engineering.

Using whirlpools and eddies for comparison, Marcus bases his forecast on principals learned in junior-level fluid dynamics and on the observation that many of Jupiter’s vortices are literally vanishing into thin air.

“I predict that due to the loss of these atmospheric whirlpools, the average temperature on Jupiter will change by as much as 10 degrees Celsius, getting warmer near the equator and cooler at the poles,” says Marcus. “This global shift in temperature will cause the jet streams to become unstable and thereby spawn new vortices. It’s an event that even backyard astronomers will be able to witness.”

According to Marcus, the imminent changes signal the end of Jupiter’s current 70-year climate cycle. His surprising predictions are published in the April 22 issue of the journal Nature.

Jupiter’s stormy atmosphere has a dozen or so jet streams that travel in alternating directions of east and west, and that can clock speeds greater than 330 miles per hour. As on Earth, vortices on Jupiter that rotate clockwise in the northern hemisphere are considered anticyclones, while those that spin counterclockwise are cyclones. The opposite is true in the southern hemisphere, where clockwise vortices are cyclones and counterclockwise spinners are anticyclones.

The Great Red Spot, located in the southern hemisphere, holds title as Jupiter’s largest anticyclone; spanning 12,500 miles wide, it is large enough to swallow Earth two to three times over.

Unlike the cyclonic storms on Jupiter, Earth’s hurricanes and storms are associated with low-pressure systems and dissipate after days or weeks. The Great Red Spot, in comparison, is a high-pressure system that has been stable for more than 300 years, and shows no signs of slowing down.

About 20 years ago, Marcus developed a computer model showing how the Great Red Spot emerged out of and endured in the chaotic turbulence of Jupiter’s atmosphere. His efforts to explain the dynamics governing it and other vortices on Jupiter led to his current projection of the planet’s impending climate change.

He says the current 70-year cycle began with the formation of three distinct anticyclones – the White Ovals – that developed south of the Great Red Spot in 1939. “The birth of the White Ovals was seen through telescopes on Earth,” he says. “I believe we’re in for a similar treat within the next 10 years.”

Marcus says the first stage of the climate cycle involves the formation of vortex streets which straddle the westward jet streams. Anticyclones form on one side of the street, while cyclones form on the other side, with no two vortices rotating in the same direction directly adjacent to each other.

Most of the vortices slowly decay with turbulence. By stage two of the cycle, some vortices become weak enough to get trapped in the occasional troughs, or Rossby waves, that form in the jet stream. Multiple vortices can get caught in the same trough. When they do, they travel bunched together, and turbulence can easily make them merge. When the vortices are weak, trapping and merging continues until only one pair is left on each vortex street.

The noted disappearance of two White Ovals, one in 1997 or 1998 and a second in 2000, exemplified the merging of the vortices in stage two, and as such, signaled the “beginning of the end” of Jupiter’s current climate cycle, says Marcus.

Why would the merger of vortices affect global temperature? Marcus says the relatively uniform temperature of Jupiter – where the temperatures at the poles are nearly the same as they are at the equator – is due to the chaotic mixing of heat and airflow from the vortices.

“If you knock out a whole row of vortices, you stop all the mixing of heat at that latitude,” says Marcus. “This creates a big wall and prevents the transport of heat from the equator to the poles.”

Once enough vortices are gone, the planet’s atmosphere will warm at the equator and cool at the poles by as much as 10 degrees Celsius in each region, which is stage three of the climate cycle.

This temperature change destabilizes the jet streams, which will react by becoming wavy. The waves steepen and break up, like they do at the beach, but they then roll up into new large vortices in the cycle’s fourth stage. In the fifth and final stage of the climate cycle, the new vortices decrease in size, and they settle into the vortex streets to begin a new cycle.

The weakening of the vortices is due to turbulence and happens gradually over time. It takes about half a century for newly formed vortices to gradually shrink down enough to be caught up in a jet stream trough, says Marcus.

Fortunately, the Great Red Spot’s proximity to the equator saves it from destruction. Unlike Jupiter’s other vortices, the Great Red Spot survives by “eating” its neighboring anticyclones, says Marcus.

Marcus notes that his theory of Jupiter’s climate cycle relies on the existence of a roughly equal number of cyclones and anticyclones on the planet.

Since the telltale signs of vortices are the clouds they create, it was easy to miss the presence of long-lived cyclones, says Marcus. He explains that unlike an anticyclone’s distinct spot, cyclones create patterns of filamentary clouds that are less clearly defined.

“On the face of it, it is easy to think that Jupiter is dominated by anticyclones because their spinning clouds show up clearly as bull’s-eyes,” says Marcus.

In the paper in Nature, Marcus presents a computer simulation showing that the warm center and cooler perimeter of a cyclone creates the appearance of the filamentary clouds. In contrast, anticyclones have cold centers and warmer perimeters. Ice crystals that form in the anticyclone’s center swell up and move to the sides where they melt, creating a darker swirl surrounding a lighter colored center.

Marcus approaches the study of planetary atmospheres from the untraditional viewpoint of a fluid dynamicist. “I’m basing my predictions on the relatively simple laws of vortex dynamics instead of using voluminous amounts of data or complex atmospheric models,” says Marcus.

Marcus says the lesson of Jupiter’s climate could be that small disturbances can cause global changes. However, he cautions against applying the same model to Earth’s climate, which is influenced by many different factors, both natural and manmade.

“Still, it’s important to have different ‘labs’ for climate,” says Marcus. “Studying other worlds helps us better understand our own, even if they are not directly analogous.”

Marcus’s research is supported by grants from the NASA Origins Program, the National Science Foundation Astronomy and Plasma Physics Programs and the Los Alamos National Laboratory.

Original Source: UC Berkeley News Release
Satellites Show How the Earth is Warming Up

Image credit: NASA
Like thermometers in space, satellites are taking the temperature of the Earth’s surface or skin. According to scientists, the satellite data confirm the Earth has had an increasing “fever” for decades.

For the first time, satellites have been used to develop an 18- year record (1981-1998) of global land surface temperatures. The record provides additional proof that Earth’s snow-free land surfaces have, on average, warmed during this time period, according to a NASA study appearing in the March issue of the Bulletin of the American Meteorological Society. The satellite record is more detailed and comprehensive than previously available ground measurements. The satellite data will be necessary to improve climate analyses and computer modeling.

Menglin Jin, the lead author, is a visiting scientist at NASA’s Goddard Space Flight Center, Greenbelt, Md., and a researcher with the University of Maryland, College Park, Md. Jin commented until now global land surface temperatures used in climate change studies were derived from thousands of on-the- ground World Meteorological Organization (WMO) stations located around the world, a relatively sparse set of readings given Earth’s size. These stations actually measure surface air temperature at two to three meters above land, instead of skin temperatures. The satellite skin temperature dataset is a good complement to the traditional ways of measuring temperatures.

A long-term skin temperature data set will be essential to illustrate global as well as regional climate variations. Together with other satellite measurements, such as land cover, cloud, precipitation, and sea surface temperature measurements, researchers can further study the mechanisms responsible for land surface warming.

Furthermore, satellite skin temperatures have global coverage at high resolutions, and are not limited by political boundaries. The study uses Advanced Very High Resolution Radiometer Land Pathfinder data, jointly created by NASA and the National Oceanic and Atmospheric Administration (NOAA) through NASA’s Earth Observing System Program Office. It also uses recently available NASA Moderate Resolution Imaging Spectroradiometer skin temperature measurements, as well as NOAA TIROS Operational Vertical Sounder (TOVS) data for validation purposes. All these data are archived at NASA’s Distributed Active Archive Center.

Inter-annually, the 18-year Pathfinder data in this study showed global average temperature increases of 0.43 Celsius (C) (0.77 Fahrenheit (F)) per decade. By comparison, ground station data (2 meter surface air temperatures) showed a rise of 0.34 C (0.61 F) per decade, and a National Center for Environmental Prediction reanalysis of land surface skin temperature showed a similar trend of increasing temperatures, in this case 0.28 C (0.5 F) per decade. Skin temperatures from TOVS also prove an increasing trend in global land surface temperatures. Regional trends show more temperature variations.

“Although an increasing trend has been observed from the global average, the regional changes can be very different,” Jin said. “While many regions were warming, central continental regions in North America and Asia were actually cooling.”

One issue with the dataset is that it cannot detect surface temperatures over snow. In winter, most of the land areas in the mid to upper latitudes of the Northern Hemisphere are covered by snow. Of Earth’s land area, 90 percent of it is snow free in July, compared to only 65 percent in January. For this reason, the study only focused on snow free areas. Still, in mountainous areas that are hard to monitor, like Tibet, satellites can detect the extent of snow coverage and its variations.

The satellite dataset allows researchers to also look at daily trends on global and regional scales. The largest daily variation was above 35.0 C (63 F) at tropical and sub-tropical desert areas for a July 1988 sample, with decreasing daily ranges towards the poles, in general. Daily changes were also closely related to vegetation cover. The daily skin temperature range showed a decreasing global mean trend over the 18-year period, resulting from greater temperature increases at night compared to daytime.

Things like clouds, volcanic eruptions, and other factors gave false readings of land temperatures, but scientists factored those out to make the skin temperature data more accurate. Scientists are considering extending this 18-year satellite- derived skin temperature record up to 2003. The mission of NASA’s Earth Science Enterprise is to develop a scientific understanding of the Earth system and its response to natural or human-induced changes to enable improved prediction capability for climate, weather, and natural hazards. NASA funded the study.

Original Source: NASA News Release

Gravity Probe B Launches

Image credit: NASA
The NASA space vehicle designed to test two important predictions of Albert Einstein’s Theory of General Relativity launched today from Vandenberg Air Force Base, Calif., aboard a Boeing Delta II expendable launch vehicle.

The spacecraft is being inserted into an almost perfect circular polar orbit around the Earth at an altitude of 400 statute miles. “The solar arrays are deployed, and we have received initial data that indicates all systems are operating smoothly. We are very pleased,” said Gravity Probe B (GP-B) program manager Rex Geveden of NASA’s Marshall Space Flight Center (MSFC), Huntsville, Ala. “The Gravity Probe B space vehicle houses one of the most challenging science instruments ever devised and seeks to answer some of the most important questions about the structure of our universe,” he said.

The GP-B mission will use four ultra-precise gyroscopes to test Einstein’s theory that space and time are distorted by the presence of massive objects. To accomplish this, the mission will measure two factors, how space and time are very slightly warped by the presence of the Earth, and how the Earth’s rotation very slightly drags space-time around with it.

“This is a great moment and a great responsibility, the outcome of a unique collaboration of physicists and engineers to develop this near-perfect instrument to test Einstein’s theory of gravity,” said the experiment’s principal investigator Dr. Francis Everitt of Stanford University in Stanford, Calif. “We are very grateful for all the support we have received at NASA and elsewhere for this exacting effort, truly a new venture in fundamental physics.”

In-orbit checkout and calibration is scheduled to last 60 days, followed by a 12-month science-data acquisition period and a two-month post-science period for calibrations.

During the mission, data from GP-B will be received a minimum of twice daily. Either Earth-based ground stations or NASA’s data relay satellites can receive the information. Controllers will be able to communicate with the orbiting space vehicle from the Mission Operations Center at Stanford University.

Data will include space vehicle and instrument performance, as well as the very precise measurements of the gyroscopes’ spin-axis pointing. By 2005 the GP-B mission will be complete. A one-year period is planned for scientific analysis of the data.

MSFC manages the GP-B program. NASA’s prime contractor for the mission, Stanford University, conceived the experiment and is responsible for the design and integration of the science instrument, as well as for mission operations and data analysis. Lockheed Martin, a major subcontractor, designed, integrated and tested the space vehicle and some of its major payload components. NASA’s Kennedy Space Center and Boeing Expendable Launch Systems were responsible for the pre-launch preparations, countdown and launch of the Delta II.

For information about NASA and agency missions on the Internet, visit:

http://www.nasa.gov/

For information about the GP-B mission on the Internet, visit:

http://einstein.stanford.edu/ and http://www.gravityprobeb.com

Original Source: NASA News Release

Chandra Reveals a Supernova’s Power

Image credit: Chandra
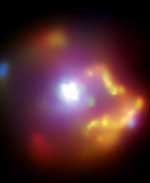
The NASA Chandra X-ray Observatory image of SNR 0540-69.3 clearly shows two aspects of the enormous power released when a massive star explodes. An implosion crushed material into an extremely dense (10 miles in diameter) neutron star, triggering an explosion that sent a shock wave rumbling through space at speeds in excess of 5 million mph.

The image reveals a central intense white blaze of high-energy particles about 3 light years across created by the rapidly rotating neutron star, or pulsar. Surrounding the white blaze is a shell of hot gas 40 light years in diameter that marks the outward progress of the supernova shock wave.

Whirling around 20 times a second, the pulsar is generating power at a rate equivalent to 30,000 Suns. This pulsar is remarkably similar to the famous Crab Nebula pulsar, although they are seen at vastly different distances, 160,000 light years versus 6,000 light years. Both SNR 0540-69.3 and the Crab pulsar rotating rapidly, and are about a thousand years old. Both pulsars are pumping out enormous amounts of X-radiation and high-energy particles, and both are immersed in magnetized clouds of high-energy particles that are a few light years in diameter. Both clouds are luminous X-ray sources, and in both cases the high-energy clouds are surrounded by a filamentary web of cool gas that shows up at optical wavelengths.

However, the extensive outer shell of 50 million degree Celsius gas in SNR 0540-69.3 has no counterpart in the Crab Nebula. This difference is thought to be due to environmental factors. The massive star that exploded to create SNR 0540-69.3 was evidently in a region where there was an appreciable amount of gas. The supernova shock wave swept up and heated the surrounding gas and created the extensive hot X-ray shell. A similar shock wave presumably exists around the Crab Nebula, but the amount of available gas is apparently too small to produce a detectable amount of X-radiation.

Original Source: Chandra News Release

NASA Turns Down Year Long Stays in the Station

NASA has rejected a Russian proposal to lengthen missions on board the International Space Station up to a year. By extending the mission times, cash-starved Russia could enable more tourists to visit the station, and help cover its costs – without the shuttle, Russian has shouldered the burden of sending people to and from the station. NASA didn’t reject the concept outright, but said that this wasn’t the best time to extend the stay, giving the Russians room for further negotiations.

Martian Dust Devils Could Be Charged Up

Image credit: NASA
Scientists have found clues that dust devils on Mars might have high-voltage electric fields, based on observations of their terrestrial counterpart. This research supports NASA’s Vision for Space Exploration by helping to understand what challenges the Martian environment presents to explorers, both robotic and eventually human.

NASA and university researchers discovered that dust devils on Earth have unexpectedly large electric fields, in excess of 4,000 volts per meter (yard), and can generate magnetic fields as well. Like detectives chasing down a suspect, the scientists attached instruments to a truck and raced across deserts in Nevada (2000) and Arizona (2001), driving through dust devils to get their measurements as part of the Martian Atmosphere and Dust in the Optical and Radio (MATADOR) activity. The Arizona observations also included a fixed base camp with a full suite of meteorological instruments (refer to Item 2 for a picture of the Arizona campaign).

Dust devils are like miniature tornadoes, about 10 to 100 meters wide with 20- to 60-mile-per-hour (32- to 96-km/hr) winds swirling around a hot column of rising air. “Dust devils are common on Mars, and NASA is interested in them as well as other phenomena as a possible nuisance or hazard to future human explorers,” said Dr. William Farrell of NASA’s Goddard Space Flight Center in Greenbelt, Md. “If Martian dust devils are highly electrified, as our research suggests, they might give rise to increased discharging or arcing in the low-pressure Martian atmosphere, increased dust adhesion to space suits and equipment, and interference with radio communications.” NASA’s Mars Testbed missions in the coming decade may be able to investigate whether such is the case. Farrell is lead author of a paper on this research published in the Journal of Geophysical Research April 20.

“Complex tracks, generated by the large Martian dust devils, are commonly found in many regions of Mars, and several dust devils have been photographed in the act of scouring the surface,” said MATADOR Principal Investigator Dr. Peter Smith of the University of Arizona (Tucson). “These Martian dust devils dwarf the 5- to 10-meter terrestrial ones and can be greater than 500 meters in diameter and several thousand meters high. The track patterns are known to change from season to season, so these huge dust pipes must be a large factor in transporting dust and could be responsible for eroding landforms.”

“Two ingredients, present on both Earth and Mars, are necessary for a dust devil to form: rising air and a source of rotation,” said Dr. Nilton Renno of the University of Michigan, a member of the research team who is an expert in the fluid dynamics of dust devils. “Wind shear, such as a change in wind direction and speed with altitude, is the source for rotation. Stronger updrafts have the potential to produce stronger dust devils, and larger wind shear produces larger dust devils.”

Dust particles become electrified in dust devils when they rub against each other as they are carried by the winds, transferring positive and negative electric charge in the same way you build up static electricity if you shuffle across a carpet. Scientists thought there would not be a high-voltage, large-scale electric field in dust devils because negatively charged particles would be evenly mixed with positively charged particles, so the overall electric charge in the dust devil would be in balance.

However, the team’s observations indicate that smaller particles become negatively charged, while larger particles become positively charged. Dust devil winds carry the small, negatively charged particles high into the air, while the heavier, positively charged particles remain near the base of the dust devil. This separation of charges produces the large-scale electric field, like the positive and negative terminals on a battery. Since the electrified particles are in motion, and a magnetic field is just the result of moving electric charges, the dust devil generates a magnetic field also.

If Martian dust grains have a variety of sizes and compositions, dust devils on Mars should become electrified in the same way as their particles rub against each other, according to the team (refer to Item 1 for an artist’s concept of an electrified Martian dust devil). We experience more static electricity on dry days because water molecules draw charge from electrified objects. Since the Martian atmosphere is extremely dry, the charging is expected to be strong, as there will be few atmospheric water molecules to steal charge from the dust grains. However, since the density of the Martian atmosphere is much lower than Earth’s, the near-surface electrical conductivity of the Martian atmosphere is expected to be 100 times higher. A Martian dust devil will therefore take longer to fully charge, since the increased atmospheric conductivity draws charge away from Martian dust grains.

To date, none of the robotic Mars landers and rovers that have operated on the Martian surface have experienced any consequences of this phenomena, including the rovers Spirit and Opportunity. However, more complex landed laboratories, such as the Mars Science Laboratory (MSL), slated to launch in 2009, may be far more sensitive to electrical disturbances than previous missions. As such, this research is a key stepping stone to more advanced robotic and human exploration of Mars.

Martian dust storms, which can cover the entire planet, are also expected to be strong generators of electric fields (Item 3 shows dust suspended in the Martian atmosphere as a result of Martian dust devil and dust storm activity). The team hopes to measure a large dust storm on Earth and have instruments to detect atmospheric electric and magnetic fields on future Mars landers.

The team includes researchers from NASA Goddard, NASA Glenn (Cleveland, Ohio), NASA Jet Propulsion Laboratory (Pasadena, Calif.), University of Arizona (Tucson), University of California (Berkeley), SETI Institute (Mountain View, Calif.), University of Washington (Seattle), University of Michigan (Ann Arbor), and Duke University (Durham, N.C.). This research was sponsored in part by the NASA Mars Fundamental Research Program, which is operated out of NASA Headquarters in Washington, DC.

Original Source: NASA News Release

Bounce Rock’s Mystery Ends

Image credit: NASA/JPL
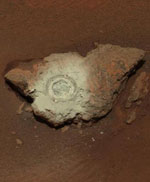
Steve Squyres, the principal investigator for the Mars Exploration Rover, wrote in his science journal for April 16 that “Well, the Battle of Bounce Rock is over.”

Squyres was referring not only to the odd rock that rests alone on the otherwise flat, rockless Meridiani plains, but also what battles had to be waged even to consider it a rock at all.

“Not everybody on the team was even convinced that it was a rock at first,” noted Squyres. “There was some speculation that it might actually have been one of the airbag covers, shaken off during the landing by a particularly sharp jolt. Before we got to it we had a little guessing game going, with the votes about evenly split between ‘Mars rock’ and ‘flight hardware’, along with a few brave souls who thought it might be a meteorite.” Flight hardware has presented a number of fantastic images in the landscape, from objects like airbag threads and parachutes to tiny paper bits.

“There was only one object anywhere outside Eagle crater that looked even remotely like a decent-sized rock. We named it ‘Bounce Rock’ because we could see that the airbags had bounced right on top of it as the landing took place,” wrote Squyres. “It figures that if there was only one rock for what seems like miles in every direction, we’d find a way to hit it!”

“It was fun, and it sure was interesting, but it was a bit of a struggle,” described Squyres. “What had us going for awhile there was a very nice Mini-TES spectrum that seemed to show a lot of hematite in the rock. We knew there was hematite in the soil at Meridiani, but this was the first time we’d gotten a hematite signal from rock… so it looked very interesting. We rolled up to it, whipped out the Moessbauer Spectrometer, took some good data, and to our surprise we found no hematite in the rock at all. In fact, the only mineral that the Moessbauer detected was pyroxene, which made this rock look very different from anything we’d ever seen, at either landing site. We put a hole in it with the RAT, looked again, and saw the same thing — lots of pyroxene and no hematite.”

“So what was going on?”, asked Squyres. “Turns out we’d been faked out on the Mini-TES data. We had been pretty far away from the rock when we had first looked it, and the Mini-TES field of view had also included a particularly hematite-rich patch of soil immediately behind the rock. Once we got close enough to see the rock better with Mini-TES, the Mini-TES data confirmed the absence of hematite, confirmed the pyroxene, and also showed some plagioclase, another mineral, in the rock. So the story was coming together.”

“Then came the most interesting part of all, the APXS data.” Squyres referred to the alpha proton spectrometer, an instrument to determine chemical composition. “The APXS measures elemental chemistry, and what we found was that, chemically, Bounce Rock is almost a dead ringer for a rock called EETA 79001-B. Odd name for a rock; 79001 actually is a rock from Mars that was found in Antarctica back in 1979. It was knocked off of Mars long ago, orbited the sun for awhile, and eventually hit the Earth in Antarctica, where it was found many years later by an expedition sent there to collect meteorites. There are more than a dozen such rocks that are believed to be from Mars on Earth. But until Bounce Rock, nobody had ever found a rock that was actually on Mars and that matched the chemistry of one of these rocks. Now we have.”

“We’re not quite sure where on Mars Bounce Rock came from, but we suspect that it might have been thrown out of a big impact crater that’s about 50 kilometers southwest of our landing site,” concluded Squyres. “So it’s not a meteorite, but it probably did fall from the sky. And it turned out to be a very interesting stop on our drive across Meridiani Planum.”

The rover team has two hills on the horizon, each approaching closer everyday, as Spirit drives towards the Columbia Hills and Opportunity motors towards Endurance Crater with a slightly raised lip that otherwise stands out as the closest thing to a hill on the flat plains.

On its way to the Columbia Hills, Spirit acquired new microscopic imager views of its capture magnet on sol 92 (April 6, 2004). Both Spirit and Opportunity are equipped with a number of magnets. The capture magnet, as seen right, has a stronger charge than its sidekick, the filter magnet. The lower-powered filter magnet captures only the most magnetic airborne dust with the strongest charges, while the capture magnet picks up all magnetic airborne dust.

The magnets’ primary purpose is to collect the martian magnetic dust so that scientists can analyze it with the rovers’ Moessbauer spectrometers. While there is plenty of dust on the surface of Mars, it is difficult to confirm where it came from, and when it was last airborne. Because scientists are interested in learning about the properties of the dust in the atmosphere, they devised this dust-collection experiment.

The capture magnet is about 4.5 centimeters (1.8 inches) in diameter and is constructed with a central cylinder and three rings, each with alternating orientations of magnetization. Scientists have been monitoring the continual accumulation of dust since the beginning of the mission with panoramic camera and microscopic imager images. They had to wait until enough dust accumulated before they could get a Moessbauer spectrometer analysis. The results of that analysis, performed on sol 92, have not been sent back to Earth yet.

The plains appear to be uniform in character from the rover’s current position all the way to Endurance Crater. Granules of various sizes blanket the plains. Spherical granules fancifully called blueberries are present – some intact and some broken. Larger granules pave the surface, while smaller grains, including broken blueberries, form small dunes. Randomly distributed 1-centimeter (0.4 inch) sized pebbles (as seen just left of center in the foreground of the image) make up a third type of feature on the plains. The pebbles’ composition remains to be determined. Scientists plan to examine these in the coming sols.

Examination of this part of Mars by NASA’s Mars Global Surveyor orbiter revealed the presence of hematite, which led NASA to choose Meridiani Planum as Opportunity’s landing site. The rover science conducted on the plains of Meridiani Planum serves to integrate what the rovers are seeing on the ground with what orbital data have shown. Opportunity will make stop at a small crater called “Fram” (seen in the upper left, with relatively large rocks nearby) before heading to the rim of Endurance Crater.

Original Source: NASA Astrobiology Magazine

Two Space Celebrations this Week

It’s time to celebrate the skies and reflect on ways to improve our stargazing experience. There are two events going on right now that you should consider; both running from April 19 to the 25th.

The first is Astronomy Week. Astronomical societies around the world are planning events all this week, so this should be a great time to meet other space enthusiasts and take a look through a telescope. Astronomy Day is on April 24th, with even more events happening that day.

The second is National Dark-Sky Week, which hopes to raise awareness about light pollution. It asks people to turn off unnecessary outdoor lights and consider low-glare alternatives to try and keep the skies as dark as possible.

Fraser Cain
Publisher
Universe Today