Image credit: LBL
By measuring polarized light from an unusual exploding star, an international team of astrophysicists and astronomers has worked out the first detailed picture of a Type Ia supernova and the distinctive star system in which it exploded.
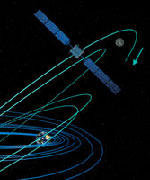
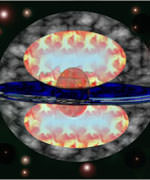
Using the European Southern Observatory’s Very Large Telescope in Chile, the researchers determined that supernova 2002ic exploded inside a flat, dense, clumpy disk of dust and gas, previously blown away from a companion star. Their work suggests that this and some other precursors of Type Ia supernovae resemble the objects known as protoplanetary nebulae, well known in our own Milky Way galaxy.
Lifan Wang of Lawrence Berkeley National Laboratory, Dietrich Baade of the European Southern Observatory (ESO), Peter H?flich and J. Craig Wheeler of the University of Texas at Austin, Koji Kawabata of the National Astronomical Observatory of Japan, and Ken’ichi Nomoto of the University of Tokyo report their findings in the 20 March 2004 issue of Astrophysical Journal Letters.
Casting supernovae to type
Supernovae are labeled according to the elements visible in their spectra: Type I spectra lack hydrogen lines, while Type II spectra have these lines. What makes SN 2002ic unusual is that its spectrum otherwise resembles a typical Type Ia supernova but exhibits a strong hydrogen emission line.
Type II and some other supernovae occur when the cores of very massive stars collapse and explode, leaving behind extremely dense neutron stars or even black holes. Type Ia supernovae, however, explode by a very different mechanism.
“A Type Ia supernova is a metallic fireball,” explains Berkeley Lab’s Wang, a pioneer in the field of supernova spectropolarimetry. “A Type Ia has no hydrogen or helium but lots of iron, plus radioactive nickel, cobalt, and titanium, a little silicon, and a bit of carbon and oxygen. So one of its progenitors must be an old star that has evolved to leave behind a carbon-oxygen white dwarf. But carbon and oxygen, as nuclear fuels, do not burn easily. How can a white dwarf explode?”
The most widely accepted Type Ia models assume that the white dwarf — roughly the size of Earth but packing most of the mass of the sun — accretes matter from an orbiting companion until it reaches 1.4 solar masses, known as the Chandrasekhar limit. The now superdense white dwarf ignites in a mighty thermonuclear explosion, leaving behind nothing but stardust.
Other schemes include the merger of two white dwarfs or even a lone white dwarf that re-accretes the matter shed by its younger self. Despite three decades of searching, however, until the discovery and subsequent spectropolarimetric studies of SN 2002ic, there was no firm evidence for any model.
In November of 2002, Michael Wood-Vasey and his colleagues in the Department of Energy’s Nearby Supernova Factory based at Berkeley Lab reported the discovery of SN 2002ic, shortly after its explosion was detected almost a billion light-years away in an anonymous galaxy in the constellation Pisces.
In August of 2003, Mario Hamuy from the Carnegie Observatories and his colleagues reported that the source of the copious hydrogen-rich gas in SN 2002ic was most likely a so-called Asymptotic Giant Branch (AGB) star, a star in the final phases of its life, with three to eight times the mass of the sun — just the sort of star that, after it has blown away its outer layers of hydrogen, helium, and dust, leaves behind a white dwarf.
Moreover, this seemingly self-contradictory supernova — a Type Ia with hydrogen — was in fact similar to other hydrogen-rich supernovae previously designated Type IIn. This in turn suggested that, while Type Ia supernovae are indeed remarkably similar, there may be wide differences among their progenitors.
Because Type Ia supernovae are so similar and so bright — as bright or brighter than whole galaxies — they have become the most important astronomical standard candles for measuring cosmic distances and the expansion of the universe. Early in 1998, after analyzing dozens of observations of distant Type Ia supernovae, members of the Department of Energy’s Supernova Cosmology Project based at Berkeley Lab, along with their rivals in the High-Z Supernova Search Team based in Australia, announced the astonishing discovery that the expansion of the universe is accelerating.
Cosmologists subsequently determined that over two-thirds of the universe consists of a mysterious something dubbed “dark energy,” which stretches space and drives the accelerating expansion. But learning more about dark energy will depend on careful study of many more distant Type Ia supernovae, including a better knowledge of what kind of star systems trigger them.
Picturing structure with spectropolarimetry
The spectropolarimetry of SN 2002ic has provided the most detailed picture of a Type Ia system yet. Polarimetry measures the orientation of light waves; for example, Polaroid sunglasses “measure” horizontal polarization when they block some of the light reflected from flat surfaces. In an object like a cloud of dust or a stellar explosion, however, light is not reflected from surfaces but scattered from particles or from electrons.
If the dust cloud or explosion is spherical and uniformly smooth, all orientations are equally represented and the net polarization is zero. But if the object is not spherical — shaped like a disk or a cigar, for example — more light will oscillate in some directions than in others.
Even for quite noticeable asymmetries, net polarization rarely exceeds one percent. Thus it was a challenge for the ESO spectropolarimetry instrument to measure faint SN 2002ic, even using the powerful Very Large Telescope. It took several hours of observation on four different nights to acquire the necessary high-quality polarimetry and spectroscopy data.
The team’s observations came nearly a year after SN 2002ic was first detected. The supernova had grown much fainter, yet its prominent hydrogen emission line was six times brighter. With spectroscopy the astronomers confirmed the observation of Hamuy and his associates, that ejecta expanding outward from the explosion at high velocity had run into surrounding thick, hydrogen-rich matter.
Only the new polarimetric studies, however, could reveal that most of this matter was shaped as a thin disk. The polarization was likely due to the interaction of high-speed ejecta from the explosion with the dust particles and electrons in the slower-moving surrounding matter. Because of the way the hydrogen line had brightened long after the supernova was first observed, the astronomers deduced that the disk included dense clumps and had been in place well before the white dwarf exploded.
“These startling results suggest that the progenitor of SN 2002ic was remarkably similar to objects that are familiar to astronomers in our own Milky Way, namely protoplanetary nebulae,” says Wang. Many of these nebulae are the remnants of the blown-away outer shells of Asymptotic Giant Branch stars. Such stars, if rotating rapidly, throw off thin, irregular disks.
A matter of timing
For a white dwarf to collect enough material to reach the Chandrasekhar limit takes a million years or so. By contrast, an AGB star loses copious amounts of matter relatively quickly; the protoplanetary-nebula phase is transitory, lasting only a few hundreds or thousands of years before the blown-off matter dissipates. “It’s a small window,” says Wang, not a long enough time for the leftover core (itself a white dwarf) to re-accrete enough material to explode.
Thus it’s more likely that a white dwarf companion in the SN 2002ic system was already busily collecting matter long before the nebula formed. Because the protoplanetary phase lasts only a few hundred years, and assuming a Type Ia supernova typically takes a million years to evolve, only about a thousandth of all Type Ia supernovae are expected to resemble SN 2002ic. Fewer still will exhibit its specific spectral and polarimetric features, although “it would be extremely interesting to search for other Type Ia supernovae with circumstellar matter,” Wang says.
Nevertheless, says Dietrich Baade, principal investigator of the polarimetry project that used the VLT, “it’s the assumption that all Type Ia supernovae are basically the same that permits the observations of SN 2002ic to be explained.”
Binary systems with different orbital characteristics and different kinds of companions at different stages of stellar evolution can still give rise to similar explosions, through the accretion model. Notes Baade, “The seemingly peculiar case of SN 2002ic provides strong evidence that these objects are in fact very much alike, as the stunning similarity of their light curves suggests.”
By showing the distribution of the gas and dust, spectropolarimetry has demonstrated why Type Ia supernovae are so much alike even though the masses, ages, evolutionary states, and orbits of their precursor systems may differ so widely.
The Berkeley Lab is a U.S. Department of Energy national laboratory located in Berkeley, California. It conducts unclassified scientific research and is managed by the University of California. Visit our website at http://www.lbl.gov.
Original Source: Berkeley Lab News Release