Image credit: ESA
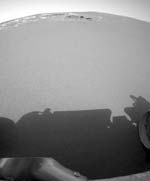
Astrobiology Magazine (AM): The first batch of images from Meridiani Planum, showing finely layered bedrock, have scientists pretty excited. What are your initial impressions?
Andrew Knoll (AK): We’ve known for several years, from orbital data, that there are layered rocks on Mars, but Opportunity gives us our first chance to actually go and work directly on some of these rocks in an outcrop. For geologists, you just can’t overemphasize the importance of that.
The fact that they’re sort of tabular suggests that they’re either fairly thin volcanic deposits or sediments. And the prospect of having in situ sedimentary rocks on Mars that we can go up and interrogate is about a best-case scenario, as far as I’m concerned.
AM: What if they turn out to be volcanic ash deposits? Will that make for a less interesting scenario?
AK: Not at all. I think one of the big questions is, What are the predominant processes that have given rise to layered rocks on Mars? There’s no reason to believe that every layered rock on Mars formed in the same way as the ones that Opportunity’s sitting in front of. But to know even how one of those layered rocks formed will be a step in the right direction.
We will also soon know whether the hematite signal in Meridiani that was detected from orbit is resident in those rocks. Remember the reason that we’re at Meridiani Planum is because of this strong signal for a particular form of iron oxide called hematite. It’s very difficult to think about making hematite without some liquid water interactions with rocks. So even if it’s a volcanic rock, it will help to constrain our thinking about one of the most interesting chemical anomalies on the planet.
AM: There’s a river in Spain, the Rio Tinto, where you’ve spent some time doing research. You’ve suggested that the way the iron minerals at Rio Tinto have degraded and transformed over time might shed some light on how the hematite at Meridiani formed. Can you explain the connection?
AK: Let me start at the beginning. The kinds of thinking we bring to the interpretation of iron on Mars will be informed by our experience with oxidized iron on the Earth’s surface. There are a number of ways that iron deposits have formed on our planet. It may be that no one of them is going to be an exact analog for what happened on Mars. But each of them might give tidbits of information that will help us think about Mars.
Now, Rio Tinto is a very interesting place. It’s in southwestern Spain, about an hour west of Seville, maybe another hour east of the Portuguese border. Rio Tinto is actually of historical interest to people in America since Columbus set sail in 1492 from a port at the mouth of the Rio Tinto. But it’s also of interest to mining geologists because it has been a mine at least since the time of the Romans.
What’s being mined there is iron ore. About 400 million years ago hydrothermal processes formed these iron ore deposits. Mostly the iron is in the form of iron sulfide, or fool’s gold. It’s very rich ore. As rainwater percolates down through these deposits, it oxidizes the pyrite and two things happen. One, it forms sulfuric acid. So the water in the river has a pH of about 1; it’s very acidic. And, two, the iron gets oxidized. So the water is about the color of rubies, because of this iron being carried around.
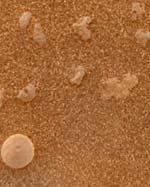
What’s interesting is that if you look at the deposits that are forming from the Rio Tinto today, most of the iron is coming out as iron sulfate minerals, that is, a combination of iron, sulfur and oxygen; and a little bit of it is coming out as a mineral called goethite, which is iron mixed with oxygen and a little bit of hydrogen. Goethite is basically rust.
That’s not what you see at Meridiani on Mars. But what’s interesting about the Rio Tinto deposit is that this process has been taking place for at least 2 million years. And there is a series of terraces that give us a sense of what happens to these deposits over time.
What we find is that after just a few thousand years, all of the sulfate minerals have disappeared and all of the iron is in this material called goethite. But as you go into older and older terraces, by the time you get to terraces that are 2 million years old, much of that goethite has been replaced by hematite, the mineral on Mars. And it’s a fairly coarse-grained hematite, which is also what we see at Mars.
So the first thing we learn at Rio Tinto is that one doesn’t need to think only about processes that deposit coarse-grained hematite from the get-go. It can form during what geologists call diagenesis. That is, it can form by processes that affect the rocks through time, and it can actually do that at low temperatures and without being deeply buried and subjected to high pressure. So in that sense, Rio Tinto shows us another way in which the hematite in Meridiani could have gotten there. It expands the options we consider.
AM: When geologists say things like “low temperature,” they often mean something different than the rest of us do.
AK: When I say “low temperature,” I’m talking about the temperatures that you and I experience on a daily basis, room temperature. I would guess that most of the Rio Tinto groundwaters are between 20 and 30 degrees Celsius, maybe 70 to 80 degrees Farenheit.
AM: Does the texture of the rock change over time as a mineral goes through the process of diagenesis?
AK: Yes, it does. Although what’s interesting is that while texture at the level of what the microscopic imager can see definitely changes through diagenetic history, larger scale features of deposition that you would see by looking closely at the outcrop with Pancam appear to be persistent. So, even though the rock is going through these changes, it retains sedimentary signatures of its formation, which is exciting. That’s important.
AB: You say that at Rio Tinto you can see a 2-million-year slice that shows you the diagenetic process over time. But the outcrops that Opportunity has seen at Meridiani could be 2 billion years old. Would they still retain any useful information after that long?
AK: Here’s the good news about geology: For sedimentary rocks, in particular, most of the changes that a rock undergoes it undergoes very early in its history. Unless a rock undergoes metamorphism, getting buried and subjected to high pressures and temperature, within at most a few million years of its formation it stabilizes into a form that it will retain indefinitely.
I work, in my day job, on Precambrian rocks on this planet. And I can guarantee you that when I look at a sedimentary rock that’s a billion years old, most of the changes that that rock underwent happened within the first 200 thousand years of its life. And then it stabilizes, and just waits for a geologist.
AM: And we have no reason to believe that physics behaves differently on Mars?
AK: That’s what we have going for us. I’ve said this before in terms of astrobiology: When you’re looking for life beyond our planet, you have no assurance that biology somewhere else will be the same as it is here. But you have pretty good assurance that physics and chemistry will be the same.
AM: Part of what makes Meridiani interesting is that it’s unlike just about any place else on Mars. Even if you’re able to figure out the history of Meridiani, to what extent will you be able to generalize that knowledge to Mars as a whole?
AK: I think it will certainly constrain the way we think about Mars as a whole planet. It may be that, in terms of the overall chemical and rock signature of Mars, that Gusev will turn out to be a better standard-issue Mars surface. That is, most of Mars – in fact, almost all of Mars – is surfaced with basalt, and then covered with fine dust. And that’s what we see at Gusev.
Now, it turns out that if you strip away the signal of hematite from the signatures of surface materials in Meridiani that we’ve gotten from orbit, it’s also mainly basalt. So it’s not a completely anomalous part of the planet. It appears to be a representative part of the planet at heart, with this unique hematite signal layered onto it.
One of the features of the Meridiani iron deposit is that, while it’s local with respect to the whole planet, it’s geographically widespread in that you have thousands of square kilometers that give this signature.
Many people think that hydrothermal processes and groundwater processes will give only small local iron signals, but in fact, the hematite-rich layers in the Rio Tinto deposit, go for several thousand square kilometers. Because these groundwaters spread out in a layer over a wide area.
So the Rio Tinto iron deposits do several things that we should keep in mind at Meridiani. They combine ancient hydrothermal and younger low-temperature processes; they need water; they can be layer forming; and they can be widespread.
They’re not the only set of processes that could to that, by any means. I’m not particularly prejudiced in favor of Rio Tinto as a better analog to Meridiani than anything else. I just think that as we go into this exploration we need to at least keep in our memory file as many different products and processes dealing with iron as we can.
All of the different settings for iron deposition and processes of iron deposition we see on this planet carry chemical and textural signals that Opportunity could detect on Meridiani. We can use those comparisons to help us to figure out how the Meridiani hematite formed.
AM: One of the intriguing aspects of Rio Tinto as a research site is that even though the water in the river is highly acidic, there are bacteria living in it. When you look at the ancient hematite deposits in that region, do you see fossil bacteria?
AK: Yes, you do. In fact, one of the things that attracted me to work with my Spanish colleagues was not that it’s an oddball environment today. While it’s kind of fun to be interested in life on the environmental fringes today, most life – and much of what you can learn about biology today – comes from ordinary organisms living in ordinary circumstances. That’s where 99 percent of the diversity of life is.
On the other hand, there’s a great question that can be asked at Rio Tinto. We can see the processes that formed the Rio Tinto iron deposits going on today; we can see the chemical processes; we can see what biology is in the environment. But the real question that one wants to keep in mind when thinking about Meridiani is: What, if any, signatures of that biology actually get preserved in diagenetically stable rocks?
One is that. If you were lucky enough to have access to a microscope – this would probably be at a resolution beyond what you could hope for from the microscopic imager – you could see individual microbial filaments that have been beautifully preserved. So that’s the first good news is that diagenetically stabilized iron can retain a microscopic imprint of biology.
The better news is that there are two features of biology that get preserved in the more eyeball-level textures in these rocks.
One is that you sometimes get little bubbles forming because of gas emanation from metabolism. And some of those will actually roof over with iron minerals and can be preserved through diagenesis. And that’s pretty much true through most sedimentary rocks that we find in the geologic column. You can get preserved gas spaces and those gas spaces are invariably associated with biological production of gases.
AM: How invariably?
AK: In our experience on Earth, it’s pretty much 100 percent. What you’d want to ask is: What processes other than biology might give rise to gases within a sediment on a planet? That’s something that you can do experiments on. I don’t know that anyone’s bothered to do them on this planet. Because, frankly, biology is so pervasive that that’s the main game in town, anyway. But one could do the experiments.
The other thing, which I feel even more strongly about, is that many times, where there are microbial populations, they form these beautiful groups of filaments that just string out across the surface. They almost look like the mane of a horse. Now the great thing is that, when minerals are deposited in these environments, they actually nucleate on these strings of filaments, and you get beautiful sedimentary textures that, again, look like the mane of a horse.
You can see them in Yellowstone Park, in both siliceous and carbonate-precipitating strings. If you go to places like Mammoth Springs, you can see it happening today. And if you hike into the hinterland, you can see ancient examples of that, beautiful signatures preserved in the rock.
In Rio Tinto, you can see iron depositing on these filaments; and in the 2 million year old terraces, you can see these filamentous iron textures. And there, again, I know of no process other than biology that could form those. So that’s truly something to keep your eyes out for whenever you’re looking at a precipitated rock on Mars.
AM: And you could see these with Pancam?
AK: If you took a Pancam to Rio Tinto or Yellowstone Park, they would jump out at you. Absolutely.
AM: If it turns out that the bedrock at the Opportunity landing site is made up of sedimentary deposits, does that mean that when those sediments were laid down, there had to be liquid water around?
AK: Very likely.
AM: So if they were sedimentary, and Pancam saw some sort of texture that on Earth is indicative of biology, would that mean that Opportunity had come close to finding evidence of life on Mars?
AK: Those are big ifs, but it would be a big day.
Let’s back up a second, because it gets to a little bit of philosophy about how you actually look for these things. A couple of years ago, NASA embarked on a funding campaign to essentially try and anticipate any kind of suggestively biological signature that might be found in any kind of exploration of another planet so that we wouldn’t be seen to be scratching our heads.
But the plain fact is that you can’t anticipate anything you might see. So what I think is a more realistic scenario is that you do your exploration, and if, in the course of that exploration, you find a signal that is (a) not easily accounted for by physics and chemistry or (b) reminiscent of signals that are closely associated with biology on Earth, then you get excited.
What will happen then, I can guarantee you, is that 100 enterprising scientists will go into the lab and see how, if at all, they can simulate what you see – without using biology. And I think that’s the right thing to do. For things where the stakes are so high, I think one wants to be as careful and sober about this as you can be. And certainly that means knowing a lot more about the generative capacity of physical and chemical processes to implant both chemical and textural signatures in a rock than we know about today.
Absent astrobiology, nobody would waste their time doing these things because, on Earth, we know that there has been biology for most of the planet’s history. Biology is everywhere. Biology is pre-eminent in the signals that it imparts to sedimentary rocks. So who is going to spend five years of their time as a young scientist trying to generate a signal by abiological means that’s closely associated with biology? However, you switch to Mars and there are a lot more reasons to do that kind of thing.
AM: If one of the MER rovers found a rock that seemed to contain evidence of martian biology, would NASA want go back to that spot and bring it home?
AK: You bet. Depending on what we find in Meridiani – not to prejudice what we find – it may make it either a very high-priority site for NASA to return with more sophisticated equipment and be a very top priority site for sample return; or we may write it off.
That’s the whole reason for this sort of incremental work. I actually like the whole architecture of NASA’s plan to go one step at a time, do each step carefully, and in step two build on what you learned in step one. It makes sense.
AM: I realize I’m asking you to speculate, here, but what do you think are the odds that Mars was once a living world?
AK: I really don’t know. But everything we’ve learned in the last few years suggests to me that water may have been episodic rather than persistent on Mars. And that lowers the probability for biology.
If water is present on the Martian surface for 100 years every 10 million years, that’s not very interesting for biology. If it’s present for 10 million years, that’s very interesting.
It is certainly not a given that we will find that Mars was a biological planet. Half of my brain keeps trying to throw out a percentage, and I know it’s such a meaningless thing to do – I think I’m just going to not do it.
But I can tell you that one of the best chances we’re going to get for a number of years to address that question is right here in the iron deposits of Meridiani.
Original Source: Astrobiology Magazine