ICEsat’s View of the Earth

Image credit: NASA

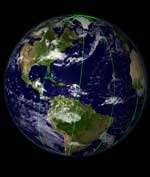
NASA’s Ice, Cloud and land Elevation Satellite (ICESat) has been churning out spectacular 3-D images of the Earth’s icecaps, clouds, mountains and forests as part of its mission to help understand how our planet is affected by climate change. ICESat’s principal mission is to measure the surface elevations of large ice sheets to determine how much they’re changing. The spacecraft’s images of Antarctica revealed details of ice streams along several glaciers, and megadunes in the continent’s interior.

NASA’s Ice, Cloud and land Elevation Satellite (ICESat) is sending home important scientific data and spectacular 3-D views of Earth’s polar ice sheets, clouds, mountains, and forestlands. The data are helping scientists understand how life on Earth is affected by changing climate.

The principal objective of the ICESat mission, and its Geoscience Laser Altimeter System (GLAS) instrument, is to measure the surface elevations of the large ice sheets covering Antarctica and Greenland and determine how they are changing. Much of an ice sheet’s behavior and response to changes in climate are apparent in their shape and how that shape changes with time. The laser sends short pulses of green and infrared light to Earth 40 times a second and collects the reflected laser light with a one-meter telescope.

The measurements have provided revolutionary accuracy and detail about the elevation of ice sheets and the elevation structure of land surfaces. ICESat is providing scientists with the most accurate measurements to date of the heights of clouds. It is also providing critical observations of atmospheric particles, called aerosols, over the ice sheets and the rest of the world. These help climate modelers, who reconstruct the past and project future climate.

“NASA has developed tremendous capabilities over the last several decades for observing our Earth in two dimensions. With ICESat, we can see the critical third-dimension, that is, the vertical dimension of land, water, and the atmosphere, in new and innovative ways,” said Waleed Abdalati, ICESat Program Scientist, NASA Headquarters, Washington. “The first few months of ICESat data have really been phenomenal. We can see detail in ice and land features that were never visible before from space.”

Scientists are using ICESat data to develop what are called “Digital Elevation Models,” 3-D high-resolution images of ice sheets in Greenland and Antarctica. Gathering these data from space will allow scientists, to obtain an unprecedented view of how and where ice sheets are growing and shrinking. This information is critical to understanding how the Earth’s changing ice cover affects sea level.

Earlier this year, ICESat’s first topographic profiles across Antarctica revealed details never before seen of features such as the ice streams of the Siple Coast, the Amery Ice Shelf, and megadunes in the Antarctic interior.

“The amount and coverage of heavy dust and pollution loading in many regions of the Earth that we are seeing in the initial ICESat data are unexpected,” said James Spinhirne, principal atmospheric scientist for ICESat at NASA’s Goddard Space Flight Center, Greenbelt, Md. These include the rivers of dust from the Sahara desert, massive dust storms, and large-scale smoke from burning vegetation. The observations tie smoke, dust and clouds directly to winds and global transport.

ICESat was launched January 12, 2003. It is the latest in a series of NASA Earth observation spacecraft designed to study the environment of our home planet and how it may be changing. NASA’s Earth Science Enterprise is dedicated to understanding the Earth as an integrated system and applying Earth System Science to improve prediction of climate, weather and natural hazards using the unique vantage point of space.

ICESat scientists will present the latest results from ICESat during a press conference on December 9 at 3:00 pm PT in Room 2012 Moscone West, at the 2003 Fall Meeting of the American Geophysical Union in San Francisco. They will also convene special sessions C31A and C31D detailing these results on December 10, beginning at 10:20am PT in the Moscone Center, Room MCC 3010.

Original Source: NASA News Release

Ancient Collision Leaves a Debris of Black Holes

Image credit: Chandra

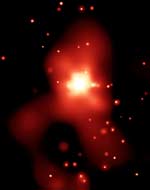
A new image from the Chandra X-Ray Observatory shows a trail of black holes and neutron stars that stretch into space for fifty-thousand light years. Astronomers believe that these objects are the evidence that two galaxies collided a few billion years ago. When the galaxies collided, material from the smaller galaxy was pulled into long tidal tails which created new areas of large star formation. Over millions of years these large stars evolved into black holes and neutron stars which are visible in the X-ray spectrum.

An image of an elliptical galaxy by NASA’s Chandra X-ray Observatory has revealed a trail of black holes and neutron stars stretching more than fifty thousand light years across space. The trail of intense X-ray sources is evidence that this apparently sedate galaxy collided with another galaxy a few billion years ago.

“This discovery shows that X-ray observations may be the best way to identify the ancient remains of mergers between galaxies,” said Lars Hernquist of the Harvard-Smithsonian Center for Astrophysics in Cambridge (CfA), Massachusetts, and a coauthor on an article on the galaxy NGC 4261 in an upcoming issue of The Astrophysical Journal Letters. “It could be a significant tool for probing the origin of elliptical galaxies.”

“From the optical and radio images, we knew something unusual was going on in the nucleus of this galaxy, but the real surprise turned out to be on the outer edges of the galaxy,” said Andreas Zezas, also of CfA, and lead-author of the paper on NGC 4261. “Dozens of black holes and neutron stars were strung out across space like beads on a necklace.”

The spectacular structure is thought to represent the aftermath of the destruction of a smaller galaxy that was pulled apart by gravitational tidal forces as it fell into NGC 4261. As the doomed galaxy fell into the larger one, large streams of gas were pulled out into long tidal tails.

Shock waves generated as these tidal tails fell into the larger galaxy triggered the formation of large numbers of massive stars which over the course of a few million years evolved into neutron stars or black holes. A few of these extremely compact objects had companion stars, and became bright X-ray sources as gas from the companions was captured by the intense gravitational fields of the neutron stars and black holes.

The origin of elliptical galaxies has long been a subject of intense debate among astronomers. The currently favored view is that they are produced by collisions between spiral galaxies. Computer simulations of galaxy collisions support this idea, and optical evidence of tails, shells, ripples, arcs and other structures have been interpreted as evidence for this theory. However the optical evidence rather quickly fades into the starry background of the galaxy, whereas the NGC 4261 X-ray observations show that the X-ray signature may linger for hundreds of millions of years.

NGC 4261 is approximately 100 million light years away from Earth. The data for these results were taken from the Chandra archive. NGC 4261 was originally observed with the Advanced CCD Imaging Spectrometer on May 6, 2000. Other members of the research team were Pepi Fabbiano and Jon Miller, both from the CfA.

NASA’s Marshall Space Flight Center, Huntsville, Ala., manages the Chandra program for the Office of Space Science, NASA Headquarters, Washington. Northrop Grumman of Redondo Beach, Calif., formerly TRW, Inc., was the prime development contractor for the observatory. The Smithsonian Astrophysical Observatory controls science and flight operations from the Chandra X-ray Center in Cambridge, Mass.

Original Source: Chandra News Release

Recycling Extends Ring Lifetimes

Image credit: NASA/JPL

New research from the University of Colorado shows how recycling of material can extend the lifetime of a ring system, such as those around Jupiter, Saturn, Neptune and Uranus. The small moons near the gas giants have long been known to sculpt the shape of the rings. It’s now believed that they’re piles of loosely-collected rubble which pull material out of the rings and then feed it back in when they collide with another object. NASA’s Cassini spacecraft is on its way to Saturn now and should provide more details when it arrives in July 2004.

Although rings around planets like Jupiter, Saturn, Uranus and Neptune are relatively short-lived, new evidence implies that the recycling of orbiting debris can lengthen the lifetime of such rings, according to University of Colorado researchers.

Strong evidence now implies small moons near the giant planets like Saturn and Jupiter are essentially piles of rubble, said Larry Esposito, a professor at CU-Boulder’s Laboratory for Atmospheric and Space Physics. These re-constituted small bodies are the source of material for planetary rings.

Previous calculations by Esposito and LASP Research Associate Joshua Colwell showed the short lifetimes for such moons imply that the solar system is nearly at the end of the age of rings. “These philosophically unappealing results may not truly describe our solar system and the rings that may surround giant extra-solar planets,” said Esposito. “Our new calculations of models explain how inclusion of recycling can lengthen the lifetime of rings and moons.”

The observations from the Voyager and Galileo space missions showed a variety of rings surrounding each of the giant planets, including Jupiter, Saturn, Uranus and Neptune. The rings are mixed in each case with small moons.

“It is clear that the small moons not only sculpt the rings through their gravity, but are also the parents of the ring material,” said Esposito. “In each ring system, destructive processes like grinding, darkening and spreading are acting so rapidly that the rings must be much younger than the planets they circle.”

Numerical models by Esposito and Colwell from the 1990’s showed a “collisional cascade,” where a planet’s moons are broken into smaller moons when struck by asteroids or comets. The fragments then are shattered to form the particles in new rings. The rings themselves are subsequently ground to dust, which is swept away.

But according to Colwell, “Some of the fragments that make up the rings may be re-accreted instead of being ground to dust. New evidence shows some debris has accumulated into moons or moonlets rather than disappearing through collisional erosion.”

“This process has proceeded rapidly,” said Esposito. “The typical ring is younger than a few hundred million years, the blink of an eye compared to the planets, which are 4.5 billion years old. The question naturally arises why rings still exist, to be photographed in such glory by visiting human spacecraft that have arrived lately on the scene,” he said.

“The answer now likely seems to be cosmic recycling,” said Esposito. Each time a moon is destroyed by a cosmic impact, much of the material released is captured by other nearby moons. These recycled moons are essentially collections of rubble, but by recycling material through a series of small moons, the lifetime of the ring system may be longer than we initially thought.”

Esposito and former LASP Research Associate Robin Canup, now with the Southwest Research Institute’s Boulder branch, showed through computer modeling that smaller fragments can be recaptured by other moons in the system. “Without this recycling, the rings and moons are soon gone,” said Esposito.

But with more recycling, the lifetime is longer, Esposito said. With most of the material recycled, as now appears to be the case in most rings, the lifetime is extended by a large factor.

“Although the individual rings and moons we now see are ephemeral, the phenomenon persists for billions of years around Saturn,” said Esposito. “Previous calculations ignored the collective effects of the other moons in extending the persistence of rings by recapturing and recycling ring material.”

Esposito, the principal investigator on a $12 million spectrograph on the Cassini spacecraft slated to arrive at Saturn in July 2004, will look closely at the competing processes of destruction and re-capture in Saturn’s F ring to confirm and quantify this explanation. Esposito discovered the F Ring using data from NASA’s Voyager 2 mission to the outer planets launched in 1978.

Original Source: University of Colorado News Release

Foale Breaks US Space Endurance Record

Image credit: NASA

NASA astronaut Michael Foale beat the current US record for endurance in space today when he surpassed 230 cumulative days – a record set by Carl Walz back in June 2002. Foale has been a member of six space shuttle crews and two space station crews. One of his longest times in orbit was when he served as a flight engineer aboard the Mir space station in 1997. Russian cosmonaut Sergei Avdeyev holds the record with 748 cumulative days in space, and Valery Polyakov’s 438-day mission was the most consecutive days in space. Foale has some catching up to do.

NASA astronaut Michael Foale, International Space Station Expedition 8 Commander and NASA Science Officer, is the new U.S. space endurance record holder, and he’s not finished yet.

Just before 2 p.m. EST Monday, Foale surpassed the previous U.S. record of 230 days, 13 hours, three minutes and 37 seconds. NASA astronaut Carl Walz set the old record in June 2002. By the time Foale returns to Earth next April, he will have accrued 375 cumulative days in space. Walz made an ultra-long-distance phone call from NASA Headquarters in Washington Monday to congratulate Foale on his accomplishment. Walz is still co-holder of the U.S. record for the longest single U.S. spaceflight during Expedition 4. He and NASA astronaut Daniel Bursch spent nearly 196 days aboard the Space Station.

Foale has been a member of six Space Shuttle crews and two Space Station crews. He flew aboard Shuttle missions in 1992, 1993, 1995 and 1999. He flew as a flight engineer aboard the Russian Mir Space Station in 1997, traveling to and from the station aboard the Shuttle. For Expedition 8, Foale traveled to the Station on board a Russian Soyuz spacecraft.

Foale’s Expedition 8 crewmate, Russian cosmonaut and Flight Engineer Alexander Kaleri, is also among the most experienced space travelers. By the end of their mission, Kaleri will have logged 610 days in orbit on four flights, placing him fifth on the all-time space endurance list. Another Russian cosmonaut, Sergei Avdeyev, holds the all-time record for time spent in space, with 748 days accumulated on three flights. Cosmonaut Valery Polyakov set the world single-flight endurance record in 1995, when he completed a 438-day mission.

American Shannon Lucid holds the single flight and cumulative record for time in space by a woman. She had a 188-day flight aboard the Russian Mir Space Station contributing to a cumulative total of 223 days in space on five flights.

Walz’s call to Foale, along with b-roll, will be replayed at noon EST today during the NASA Television Video File. NASA TV is available on AMC-9, transponder 9C, C-Band, located at 85 degrees west longitude. The frequency is 3880.0 MHz. Polarization is vertical, and audio is monaural at 6.80 MHz. For information about NASA TV on the Internet, visit:

Original Source: NASA News Release
Cocoon of Hydrogen Around a Young Star

Image credit: JACH

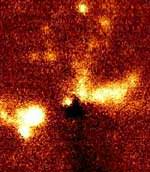
A young, hot star has been found nestled inside a cocoon of molecular hydrogen gas half a light-year across. The star is called IRAS 07427-2400, and it’s sending out a solar wind so fast (360,000 km/h) that the shock waves are heating up the gas so it’s visible to Earth-based telescopes. Astronomers believe that these massive stars have so much energy that they blast their environment so that planets aren’t able to form the way they do around more “normal” stars, like our own Sun.

Astronomers have discovered a giant envelope or disk of glowing gas more than half a light year across, illuminated by shockwaves caused by winds travelling at up to 360,000 km/hour (220,000 miles/hour). The disk is orbiting a massive star 20,000 light years from Earth. This is the first time such a disk has been found emitting its own light. The discovery is reported today (8 December 2003) in the journal “Astronomy and Astrophysics”.

The work, led by Dr Nanda Kumar of the Centre for Astrophysics of the University of Porto (CAUP), Portugal, used the United Kingdom Infrared Telescope (UKIRT) in Hawaii, and other telescopes. The team used the new UKIRT Imager Spectrometer (UIST) on UKIRT, to study the young stellar object (YSO) known as IRAS 07427-2400. Their results show that the envelope or disk around the young star is glowing in the light of molecular hydrogen and ionised iron.

Dr Stan Kurtz of the National Autonomous University of Mexico (UNAM), who is an expert in studies of solar system sized disks around massive stars, said “Protostellar disks are known to exist around Sun-like stars, but they are usually seen in silhouette against background light from nebulae. In this case, however, the molecules in the disk are hot enough to shine brightly themselves.”

Dr Kumar adds “This is the first time an envelope like this has been seen in molecular hydrogen emission. It tells us that massive stars form with very different conditions and physical aspects when compared to Sun-like stars.”

The central star itself is very young, at roughly 100,000 years old. By comparison, our middle-aged Sun is about 5 billion years old. The surrounding gas disk is huge – its diameter is one thousand times larger than Pluto’s orbit in our own Solar System. The young star is rapidly changing as gas and dust spiral down onto its surface through the disk, a process called “accretion”. The star is already more than one thousand times more luminous than our Sun.

Dr Amadeu Fernandes of CAUP, Porto states “The UKIRT results show that the glow from the disk is not due to the intense light from the central star, but is instead caused by powerful shock waves”. Dr Chris Davis of the Joint Astronomy Centre in Hawaii explains “The disk is possibly being shocked by supersonic winds driven by the central star. These winds, travelling at hundreds of thousands of kilometres per hour, crash into the disk and heat the gas to thousands of degrees.”

Dr Kumar adds “It is also possible that the shocks are powered by large amounts of gas and dust collapsing through the disk onto the young star. Further investigation is required to understand their origin.”

Disks around young, Sun-like stars are known to be the birth places of planets, which can condense out of the gas and dust after the star has formed. This disk has about 150 times the mass of our Sun – enough gas and dust to make a hundred Sun-like stars, or many thousands of planets. However, the results suggest that it will not produce new planets or stars in the future. The intense shock waves have made the gas far too hot to condense. Dr Davis says “This tells us that massive stars like this may not be able to form planets, as their surrounding gas is too hot.”

Instead of forming a cluster of stars, or a family of orbiting planets, the disk will ultimately be destroyed by the intense ultraviolet radiation from the central star. The radiation is already at work, gnawing at the inner edges of the disk and evaporating the gas. Dr Kumar says “We’ve seen open rings of gas around similar stars, also with UKIRT. We think they may be the remnants of large disks that have been almost completely evaporated.”

The complete destruction of the disk will take many thousands of years. Before this happens, the size and brightness of the disk allow researchers to study it with powerful ground-based telescopes such as UKIRT, without the need for a space telescope.

Dr Davis says “We now have the task of searching for other hot, molecular disks around massive young stars, and of fitting the existence of this super-disk into our theories on the birth of massive stars.”

The disk was first discovered in January 2001 by UKIRT, but further observations were needed to confirm its nature. The team used the Caltech Submillimeter Observatory in Hawaii to provide supporting evidence to prove the rotating nature of the disk. Stan Kurtz used the Very Large Array radio telescope in New Mexico to image the central massive star at radio wavelengths. The team returned to use UKIRT in December 2002.

The work described is published on 8th December 2003 in “Astronomy and Astrophysics” volume 412.

Original Source: JACH News Release

Our Second Baby Has Arrived

Sorry for the lack of newsletters at the end of last week, we were a little busy having a new baby. 🙂

I’m proud to announce the arrival of our second child, Logan Cain, who made his appearance on Thursday, December 4 at 1:27 pm. He was originally supposed to arrive on December 24, so we were a little surprised when Katrina went into labour three weeks early. So far, he’s been a little angel, sleeping well and barely crying – unless we’re too slow with the feeding.

It goes without saying that Universe Today could be a little sporadic over the next few weeks while we settle into our new routines.

Thanks for your understanding.

Fraser Cain
Publisher
Universe Today

Hubble’s View of Starbirth

Image credit: Hubble

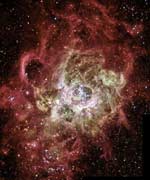
The Hubble Space Telescope took this incredible photograph of nebula NGC 604, which is a huge area of newly forming stars in galaxy M33. The area is similar to the star forming region in the Orion Nebula, but it’s 100 times larger. The most massive stars in the nebula are 120 times the mass of the Sun and their surface temperatures exceed 40,000 degrees Kelvin. Intense ultraviolet radiation floods out of these stars, which lights up the surrounding gas. NGC 604 is 2.7 million light-years away in the constellation Triangulum.

This festively colorful nebula, called NGC 604, is one of the largest known seething cauldrons of star birth in a nearby galaxy. NGC 604 is similar to familiar star-birth regions in our Milky Way galaxy, such as the Orion Nebula, but it is vastly larger in extent and contains many more recently formed stars.

This monstrous star-birth region contains more than 200 brilliant blue stars within a cloud of glowing gases some 1,300 light-years across, nearly 100 times the size of the Orion Nebula. By contrast, the Orion Nebula contains just four bright central stars. The bright stars in NGC 604 are extremely young by astronomical standards, having formed a mere 3 million years ago.

Most of the brightest and hottest stars form a loose cluster located within a cavity near the center of the nebula. Stellar winds from these hot blue stars, along with supernova explosions, are responsible for carving out the hole at the center. The most massive stars in NGC 604 exceed 120 times the mass of our Sun, and their surface temperatures are as hot as 72,000 degrees Fahrenheit (40,000 Kelvin). Ultraviolet radiation floods out from these hot stars, making the surrounding nebular gas fluoresce.

NGC 604 lies in a spiral arm of the nearby galaxy M33, located about 2.7 million light-years away in the direction of the constellation Triangulum. M33, a member of the Local Group of galaxies that also includes the Milky Way and the Andromeda Galaxy, can be seen easily with binoculars. NGC 604 itself can be seen with a small telescope, and was first noted by the English astronomer William Herschel in 1784. Within our Local Group, only the Tarantula Nebula in the Large Magellanic Cloud exceeds NGC 604 in the number of young stars, even though the Tarantula Nebula is slightly smaller in size.

NGC 604 provides Hubble astronomers with a nearby example of a giant star-birth region. Such regions are small-scale versions of more distant “starburst” galaxies, which undergo an extremely high rate of star formation. Starbursts are believed to have been common in the early universe, when the star-formation rate was much higher. Supernovae exploding in these galaxies created the first chemical elements heavier than hydrogen and helium.

The image of NGC 604 was assembled from observations taken with Hubble’s Wide Field Planetary Camera 2 in 1994, 1995, and 2001. Color filters were used to isolate light emitted by hydrogen, oxygen, nitrogen, and sulfur atoms in the nebula and ultraviolet, visible and infrared light from the stars within NGC 604 and the nearby spiral arms of M33. Image processors from the Hubble Heritage team at the Space Telescope Science Institute combined these various filter images to create this color picture.

Original Source: Hubble News Release

235 Days to Saturn

Image credit: NASA/JPL

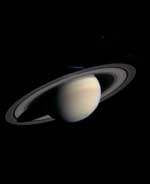
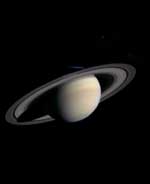
NASA’s Cassini spacecraft is on final approach to Saturn, and so far, the view is just getting better and better. The Saturn-bound spacecraft captured this photograph of the Ringed Planet on November 9th at a distance of 114 million km. The smallest features visible are 668 kilometres across, so the resolution is going to get much better as it gets closer. Five of the planet’s many moons can also be seen in this photograph (they were digitally enhanced to be easier to see). Cassini will finally arrive at Saturn on July 1, 2004.

A cold, dusky Saturn looms in the distance in this striking, natural color view of the ringed planet and five of its icy satellites. This image was composed of exposures taken by Cassini’s narrow angle camera on November 9, 2003 at 08:54 UTC (spacecraft event time) from a distance of 111.4 million km (69.2 million mi) — about three-fourths the distance of the Earth from the Sun — and 235 days from insertion into Saturn orbit. The smallest features visible here are about 668 km (415 mi) across, which is a marked improvement over the last Cassini Saturn image released on November 1, 2002. New features such as intricate cloud patterns and small moons near the rings should become visible over the next several months as the spacecraft speeds toward its destination.

Some details within Saturn’s massive ring system are already visible. Structure is evident in the B ring, the middle and brightest of Saturn’s three main rings. The 4800 km (2980 mi)-wide Cassini Division is the distinctive dark, central band that separates the outermost A ring from the brighter B ring. Interestingly, the outer edge of the B ring is maintained by a strong gravitational resonance with the moon Mimas, also visible in this image (see below). The 325 km (200 mi)-wide Encke gap in the A ring, near the outer edge of the ring system, is also visible, as is the fainter C ring, interior to the B ring.

With a thickness of only a few tens of meters or less, the main rings span 274,000 km (171,000 mi) from one end to the other? about three-quarters of the distance between the Earth and the Moon.

Saturn’s multi-banded, multi-hued atmosphere is also apparent at this distance. In this composite made of images taken through broadband blue, green, and red spectral filters, the color is very close to what the human eye would see. The different hues of yellow, brown and red seen in the illuminated southern hemisphere are more delicate and subtle than the colors on Jupiter. Coloration on both Jupiter and Saturn is caused by small colored particles mixed with the white ammonia clouds. The ammonia clouds on Saturn are deeper and thicker than those on Jupiter because ammonia gas condenses at a deeper level in Saturn’s colder atmosphere. The composition of the colored particles is not known but is thought to include sulfur and nitrogen as key constituents at middle and low latitudes.

In the southern polar region, a dusky haze is visible, more gray than the light-brown at middle latitudes. This polar haze may be produced by energetic electrons and protons in the aurorae which destroy methane gas, leading to the formation of a haze of complex hydrocarbons.

Most of Saturn’s northern hemisphere is in shadow of the rings, with the exception of a small sliver visible on the limb. (Light passing through the Cassini Division illuminates the higher altitudes in the atmosphere.) This sliver appears bluer than the visible southern hemisphere, probably due to molecular scattering by hydrogen at these altitudes above the haze and clouds. As the Cassini tour unfolds over the next five years and beyond, we will have an opportunity to see how the colors change with time, whether due to changing seasonal heating or to some other mechanism.

Five Saturnian satellites can also be seen in this image. The brightnesses of these bodies have been increased three- to ten-fold to enhance visibility. The satellites are, on the left, from brightest to faintest, Rhea (1530 km, 951 mi across), Dione (1120 km, 696 mi), and Enceladus (520 km, 323 mi); and on the right, from brightest to faintest, Tethys (1060 km, 659 mi) and Mimas (392 km, 244 mi).

From the Voyager encounters in 1980 and 1981, we know that each of Saturn’s icy moons possesses intriguing features. Enceladus is the most reflective body in the solar system; both Mimas and Tethys exhibit large craters on their surfaces; Dione and Rhea have curious streaks of bright, wispy material. Cassini will make very close approaches to Rhea, Dione and Enceladus, returning images in which features as small as 50 meters or less will be detectable. Images with details finer than those seen by Voyager (~ 2 km, 1.3 mi) will be returned from all five moons.

Cassini will enter Saturn orbit on July 1, 2004.

The Cassini-Huygens mission is a cooperative mission of NASA, the European Space Agency and the Italian Space Agency. JPL, a division of the California Institute of Technology in Pasadena, manages the mission for NASA’s Office of Space Science, Washington, D.C.

Original Source: NASA/JPL News Release

Distant Galaxy is Furiously Making Stars

Image credit: NRAO

One of the most distant galaxies ever seen seems to be in the midst of extremely active star formation. The galaxy has been dubbed the Cloverleaf, and it’s 11 billion light-years away, so astronomers are seeing it when the Universe was less than 3 billion years old. It has a rate of star formation 300 times greater than our own Milky Way – 1,000 new stars are being formed each year. The discovery was made using the National Science Foundation’s Very Large Array radio telescope.

Astronomers have discovered a key signpost of rapid star formation in a galaxy 11 billion light-years from Earth, seen as it was when the Universe was only 20 percent of its current age. Using the National Science Foundation’s Very Large Array (VLA) radio telescope, the scientists found a huge quantity of dense interstellar gas — the environment required for active star formation — at the greatest distance yet detected.

A furious spawning of the equivalent of 1,000 Suns per year in a distant galaxy dubbed the Cloverleaf may be typical of galaxies in the early Universe, the scientists say.

“This is a rate of star formation more than 300 times greater than that in our own Milky Way and similar spiral galaxies, and our discovery may provide important information about the formation and evolution of galaxies throughout the Universe,” said Philip Solomon, of Stony Brook University in New York.

While the raw material for star formation has been found in galaxies at even greater distances, the Cloverleaf is by far the most distant galaxy showing this essential signature of star formation. That essential signature comes in the form of a specific frequency of radio waves emitted by molecules of the gas hydrogen cyanide (HCN).

“If you see HCN, you are seeing gas with the high density required to form stars,” said Paul Vanden Bout of the National Radio Astronomy Observatory (NRAO).

Solomon and Vanden Bout worked with Chris Carilli of NRAO and Michel Guelin of the Institute for Millimeter Astronomy in France. They reported their results in the December 11 issue of the scientific journal Nature.

In galaxies like the Milky Way, dense gas traced by HCN but composed mainly of hydrogen molecules is always associated with regions of active star formation. What is different about the Cloverleaf is the huge quantity of dense gas along with very powerful infrared radiation from the star formation. Ten billion times the mass of the Sun is contained in dense, star-forming gas clouds.

“At the rate this galaxy is seen to be forming stars, that dense gas will be used up in only about 10 million years,” Solomon said.

In addition to giving astronomers a fascinating glimpse of a huge burst of star formation in the early Universe, the new information about the Cloverleaf helps answer a longstanding question about bright galaxies of that era. Many distant galaxies have super-massive black holes at their cores, and those black holes power “central engines” that produce bright emission. Astronomers have wondered specifically about those distant galaxies that emit large amounts of infrared light, galaxies like the Cloverleaf which has a black hole and central engine.

“Is this bright infrared light caused by the black-hole-powered core of the galaxy or by a huge burst of star formation? That has been the question. Now we know that, in at least one case, much of the infrared light is produced by intense star formation,” Carilli said.

The rapid star formation, called a starburst, and the black hole are both generating the bright infrared light in the Cloverleaf. The starburst is a major event in the formation and evolution of this galaxy.

“This detection of HCN gives us a unique new window through which we can study star formation in the early Universe,” Carilli said.

The National Radio Astronomy Observatory is a facility of the National Science Foundation, operated under cooperative agreement by Associated Universities, Inc.

Original Source: NRAO News Release

New Water Map of the Atmosphere

Image credit: NASA/JPL

One aspect of the Earth’s climate, the distribution of water vapour, might have significant implications for climate change and ozone depletion. To understand its significance, NASA scientists are using special aircraft to build a detailed map of how water vapour moves around in the atmosphere, from the surface of the Earth up to an altitude of 40 km, where the air completely dries out. They were able to tell which vapour was created at high altitudes and which was moved up by air currents.

NASA scientists have opened a new window for understanding atmospheric water vapor, its implications for climate change, and ozone depletion.

The scientists have created the first detailed map of water containing heavy hydrogen and heavy oxygen atoms in and out of clouds, from the surface of Earth to some 25 miles upward, to better understand the dynamics of how water gets into the stratosphere.

Only small amounts of water reach the arid stratosphere, 10 to 50 kilometers (6 to 25 miles) above Earth, so any increase in the water content could potentially lead to destruction of some ozone-shielding capability in this part of the atmosphere. This could produce larger ozone depletions over the North and South Poles as well as at mid-latitudes.

Water shapes Earth’s climate. The large amount of it in the lower atmosphere, the troposphere, controls how much sunlight gets through to the planet, how much is trapped in our skies, and how much goes back out to space. Higher in the stratosphere, where most of the Earth’s ozone shield protects the surface from harmful ultraviolet rays, there is very little water (less than .001 of the surface concentration). Scientists don’t fully understand how air is dried before it gets to this region.

In the troposphere, water exists as vapor in air, as liquid droplets in clouds, and as frozen ice particles in high altitude cirrus clouds. Since there is so much water closer to Earth and so few miles above, it is important to understand how water enters and leaves the stratosphere. The “isotopic content,” the natural fingerprint left by the heavy forms of water, is key to understanding the process. An isotope is any of two or more forms of an element having the same or very closely related chemical properties and the same atomic number, but different atomic weights. An example is oxygen 16 versus oxygen 18– both are oxygen, but one is heavier than the other.

Heavy water is more readily condensed or frozen out from its vapor, causing the nature of its distribution to differ somewhat from the usual isotopic form of water. A measurement of the isotopic make-up of water vapor enables scientists to determine how water gets into the stratosphere.

“For the first time, we have water isotope content mapped in incredible detail,” said Dr. Christopher R. Webster, a senior research scientist at NASA’s Jet Propulsion Laboratory, Pasadena, Calif. Webster is principal author of a scientific paper announcing the new findings in the journal Science. Dr. Andrew J. Heymsfield, of the National Center for Atmospheric Research, Boulder, Colo., is co-author.

Measuring water isotopes is extremely challenging, because they represent only a small fraction, less than one percent, of the total water in the atmosphere. Detailed measurements were made using an Aircraft laser infrared absorption spectrometer (Alias) flying aboard NASA’s WB-57F high- altitude jet aircraft in July 2002. This new laser technique enables mapping of water isotopes with sufficient resolution to help researchers understand both water transport and the detailed microphysics of clouds, key parameters for understanding atmospheric composition, storm development and weather prediction.

“The laser technique gives us the ability to measure the different types of isotopes found in all water,” said Webster. “With the isotopic fingerprint, we discovered the ice particles found under the stratosphere were lofted from below, and some were grown there in place.”

The data help explain how the water content of air entering the stratosphere is reduced, and show that gradual ascent and rapid upward motion associated with tall cloud systems (convective lofting) both play roles in establishing the dryness of the stratosphere.

The purpose of the aircraft mission was to understand the formation, extent and processes associated with cirrus clouds. The mission used six aircraft from NASA and other federal agencies to make observations above, in and below the clouds. By combining aircraft data with ground-based data and satellites, scientists have a better picture of the relationship between clouds, water vapor and atmospheric dynamics than previously. They also can better interpret satellite measurements routinely made by NASA.

The mission was funded by NASA’s Earth Science Enterprise. The Enterprise is dedicated to understanding the Earth as an integrated system and applying Earth System Science to improve prediction of climate, weather and natural hazards using the unique vantage point of space. For more information about Alias, visit: http://laserweb.jpl.nasa.gov.

For information about NASA, visit: http://www.nasa.gov.

JPL is managed for NASA by the California Institute of Technology in Pasadena

Original Source: NASA/JPL News Release