Our Second Baby Has Arrived

Sorry for the lack of newsletters at the end of last week, we were a little busy having a new baby. 🙂

I’m proud to announce the arrival of our second child, Logan Cain, who made his appearance on Thursday, December 4 at 1:27 pm. He was originally supposed to arrive on December 24, so we were a little surprised when Katrina went into labour three weeks early. So far, he’s been a little angel, sleeping well and barely crying – unless we’re too slow with the feeding.

It goes without saying that Universe Today could be a little sporadic over the next few weeks while we settle into our new routines.

Thanks for your understanding.

Fraser Cain
Publisher
Universe Today

Hubble’s View of Starbirth

Image credit: Hubble

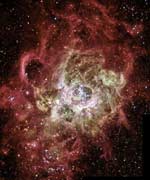
The Hubble Space Telescope took this incredible photograph of nebula NGC 604, which is a huge area of newly forming stars in galaxy M33. The area is similar to the star forming region in the Orion Nebula, but it’s 100 times larger. The most massive stars in the nebula are 120 times the mass of the Sun and their surface temperatures exceed 40,000 degrees Kelvin. Intense ultraviolet radiation floods out of these stars, which lights up the surrounding gas. NGC 604 is 2.7 million light-years away in the constellation Triangulum.

This festively colorful nebula, called NGC 604, is one of the largest known seething cauldrons of star birth in a nearby galaxy. NGC 604 is similar to familiar star-birth regions in our Milky Way galaxy, such as the Orion Nebula, but it is vastly larger in extent and contains many more recently formed stars.

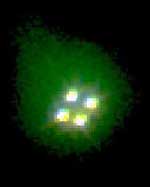
This monstrous star-birth region contains more than 200 brilliant blue stars within a cloud of glowing gases some 1,300 light-years across, nearly 100 times the size of the Orion Nebula. By contrast, the Orion Nebula contains just four bright central stars. The bright stars in NGC 604 are extremely young by astronomical standards, having formed a mere 3 million years ago.

Most of the brightest and hottest stars form a loose cluster located within a cavity near the center of the nebula. Stellar winds from these hot blue stars, along with supernova explosions, are responsible for carving out the hole at the center. The most massive stars in NGC 604 exceed 120 times the mass of our Sun, and their surface temperatures are as hot as 72,000 degrees Fahrenheit (40,000 Kelvin). Ultraviolet radiation floods out from these hot stars, making the surrounding nebular gas fluoresce.

NGC 604 lies in a spiral arm of the nearby galaxy M33, located about 2.7 million light-years away in the direction of the constellation Triangulum. M33, a member of the Local Group of galaxies that also includes the Milky Way and the Andromeda Galaxy, can be seen easily with binoculars. NGC 604 itself can be seen with a small telescope, and was first noted by the English astronomer William Herschel in 1784. Within our Local Group, only the Tarantula Nebula in the Large Magellanic Cloud exceeds NGC 604 in the number of young stars, even though the Tarantula Nebula is slightly smaller in size.

NGC 604 provides Hubble astronomers with a nearby example of a giant star-birth region. Such regions are small-scale versions of more distant “starburst” galaxies, which undergo an extremely high rate of star formation. Starbursts are believed to have been common in the early universe, when the star-formation rate was much higher. Supernovae exploding in these galaxies created the first chemical elements heavier than hydrogen and helium.

The image of NGC 604 was assembled from observations taken with Hubble’s Wide Field Planetary Camera 2 in 1994, 1995, and 2001. Color filters were used to isolate light emitted by hydrogen, oxygen, nitrogen, and sulfur atoms in the nebula and ultraviolet, visible and infrared light from the stars within NGC 604 and the nearby spiral arms of M33. Image processors from the Hubble Heritage team at the Space Telescope Science Institute combined these various filter images to create this color picture.

Original Source: Hubble News Release

235 Days to Saturn

Image credit: NASA/JPL

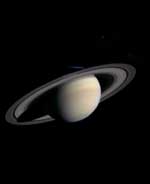
NASA’s Cassini spacecraft is on final approach to Saturn, and so far, the view is just getting better and better. The Saturn-bound spacecraft captured this photograph of the Ringed Planet on November 9th at a distance of 114 million km. The smallest features visible are 668 kilometres across, so the resolution is going to get much better as it gets closer. Five of the planet’s many moons can also be seen in this photograph (they were digitally enhanced to be easier to see). Cassini will finally arrive at Saturn on July 1, 2004.

A cold, dusky Saturn looms in the distance in this striking, natural color view of the ringed planet and five of its icy satellites. This image was composed of exposures taken by Cassini’s narrow angle camera on November 9, 2003 at 08:54 UTC (spacecraft event time) from a distance of 111.4 million km (69.2 million mi) — about three-fourths the distance of the Earth from the Sun — and 235 days from insertion into Saturn orbit. The smallest features visible here are about 668 km (415 mi) across, which is a marked improvement over the last Cassini Saturn image released on November 1, 2002. New features such as intricate cloud patterns and small moons near the rings should become visible over the next several months as the spacecraft speeds toward its destination.

Some details within Saturn’s massive ring system are already visible. Structure is evident in the B ring, the middle and brightest of Saturn’s three main rings. The 4800 km (2980 mi)-wide Cassini Division is the distinctive dark, central band that separates the outermost A ring from the brighter B ring. Interestingly, the outer edge of the B ring is maintained by a strong gravitational resonance with the moon Mimas, also visible in this image (see below). The 325 km (200 mi)-wide Encke gap in the A ring, near the outer edge of the ring system, is also visible, as is the fainter C ring, interior to the B ring.

With a thickness of only a few tens of meters or less, the main rings span 274,000 km (171,000 mi) from one end to the other? about three-quarters of the distance between the Earth and the Moon.

Saturn’s multi-banded, multi-hued atmosphere is also apparent at this distance. In this composite made of images taken through broadband blue, green, and red spectral filters, the color is very close to what the human eye would see. The different hues of yellow, brown and red seen in the illuminated southern hemisphere are more delicate and subtle than the colors on Jupiter. Coloration on both Jupiter and Saturn is caused by small colored particles mixed with the white ammonia clouds. The ammonia clouds on Saturn are deeper and thicker than those on Jupiter because ammonia gas condenses at a deeper level in Saturn’s colder atmosphere. The composition of the colored particles is not known but is thought to include sulfur and nitrogen as key constituents at middle and low latitudes.

In the southern polar region, a dusky haze is visible, more gray than the light-brown at middle latitudes. This polar haze may be produced by energetic electrons and protons in the aurorae which destroy methane gas, leading to the formation of a haze of complex hydrocarbons.

Most of Saturn’s northern hemisphere is in shadow of the rings, with the exception of a small sliver visible on the limb. (Light passing through the Cassini Division illuminates the higher altitudes in the atmosphere.) This sliver appears bluer than the visible southern hemisphere, probably due to molecular scattering by hydrogen at these altitudes above the haze and clouds. As the Cassini tour unfolds over the next five years and beyond, we will have an opportunity to see how the colors change with time, whether due to changing seasonal heating or to some other mechanism.

Five Saturnian satellites can also be seen in this image. The brightnesses of these bodies have been increased three- to ten-fold to enhance visibility. The satellites are, on the left, from brightest to faintest, Rhea (1530 km, 951 mi across), Dione (1120 km, 696 mi), and Enceladus (520 km, 323 mi); and on the right, from brightest to faintest, Tethys (1060 km, 659 mi) and Mimas (392 km, 244 mi).

From the Voyager encounters in 1980 and 1981, we know that each of Saturn’s icy moons possesses intriguing features. Enceladus is the most reflective body in the solar system; both Mimas and Tethys exhibit large craters on their surfaces; Dione and Rhea have curious streaks of bright, wispy material. Cassini will make very close approaches to Rhea, Dione and Enceladus, returning images in which features as small as 50 meters or less will be detectable. Images with details finer than those seen by Voyager (~ 2 km, 1.3 mi) will be returned from all five moons.

Cassini will enter Saturn orbit on July 1, 2004.

The Cassini-Huygens mission is a cooperative mission of NASA, the European Space Agency and the Italian Space Agency. JPL, a division of the California Institute of Technology in Pasadena, manages the mission for NASA’s Office of Space Science, Washington, D.C.

Original Source: NASA/JPL News Release

Distant Galaxy is Furiously Making Stars

Image credit: NRAO

One of the most distant galaxies ever seen seems to be in the midst of extremely active star formation. The galaxy has been dubbed the Cloverleaf, and it’s 11 billion light-years away, so astronomers are seeing it when the Universe was less than 3 billion years old. It has a rate of star formation 300 times greater than our own Milky Way – 1,000 new stars are being formed each year. The discovery was made using the National Science Foundation’s Very Large Array radio telescope.

Astronomers have discovered a key signpost of rapid star formation in a galaxy 11 billion light-years from Earth, seen as it was when the Universe was only 20 percent of its current age. Using the National Science Foundation’s Very Large Array (VLA) radio telescope, the scientists found a huge quantity of dense interstellar gas — the environment required for active star formation — at the greatest distance yet detected.

A furious spawning of the equivalent of 1,000 Suns per year in a distant galaxy dubbed the Cloverleaf may be typical of galaxies in the early Universe, the scientists say.

“This is a rate of star formation more than 300 times greater than that in our own Milky Way and similar spiral galaxies, and our discovery may provide important information about the formation and evolution of galaxies throughout the Universe,” said Philip Solomon, of Stony Brook University in New York.

While the raw material for star formation has been found in galaxies at even greater distances, the Cloverleaf is by far the most distant galaxy showing this essential signature of star formation. That essential signature comes in the form of a specific frequency of radio waves emitted by molecules of the gas hydrogen cyanide (HCN).

“If you see HCN, you are seeing gas with the high density required to form stars,” said Paul Vanden Bout of the National Radio Astronomy Observatory (NRAO).

Solomon and Vanden Bout worked with Chris Carilli of NRAO and Michel Guelin of the Institute for Millimeter Astronomy in France. They reported their results in the December 11 issue of the scientific journal Nature.

In galaxies like the Milky Way, dense gas traced by HCN but composed mainly of hydrogen molecules is always associated with regions of active star formation. What is different about the Cloverleaf is the huge quantity of dense gas along with very powerful infrared radiation from the star formation. Ten billion times the mass of the Sun is contained in dense, star-forming gas clouds.

“At the rate this galaxy is seen to be forming stars, that dense gas will be used up in only about 10 million years,” Solomon said.

In addition to giving astronomers a fascinating glimpse of a huge burst of star formation in the early Universe, the new information about the Cloverleaf helps answer a longstanding question about bright galaxies of that era. Many distant galaxies have super-massive black holes at their cores, and those black holes power “central engines” that produce bright emission. Astronomers have wondered specifically about those distant galaxies that emit large amounts of infrared light, galaxies like the Cloverleaf which has a black hole and central engine.

“Is this bright infrared light caused by the black-hole-powered core of the galaxy or by a huge burst of star formation? That has been the question. Now we know that, in at least one case, much of the infrared light is produced by intense star formation,” Carilli said.

The rapid star formation, called a starburst, and the black hole are both generating the bright infrared light in the Cloverleaf. The starburst is a major event in the formation and evolution of this galaxy.

“This detection of HCN gives us a unique new window through which we can study star formation in the early Universe,” Carilli said.

The National Radio Astronomy Observatory is a facility of the National Science Foundation, operated under cooperative agreement by Associated Universities, Inc.

Original Source: NRAO News Release

New Water Map of the Atmosphere

Image credit: NASA/JPL

One aspect of the Earth’s climate, the distribution of water vapour, might have significant implications for climate change and ozone depletion. To understand its significance, NASA scientists are using special aircraft to build a detailed map of how water vapour moves around in the atmosphere, from the surface of the Earth up to an altitude of 40 km, where the air completely dries out. They were able to tell which vapour was created at high altitudes and which was moved up by air currents.

NASA scientists have opened a new window for understanding atmospheric water vapor, its implications for climate change, and ozone depletion.

The scientists have created the first detailed map of water containing heavy hydrogen and heavy oxygen atoms in and out of clouds, from the surface of Earth to some 25 miles upward, to better understand the dynamics of how water gets into the stratosphere.

Only small amounts of water reach the arid stratosphere, 10 to 50 kilometers (6 to 25 miles) above Earth, so any increase in the water content could potentially lead to destruction of some ozone-shielding capability in this part of the atmosphere. This could produce larger ozone depletions over the North and South Poles as well as at mid-latitudes.

Water shapes Earth’s climate. The large amount of it in the lower atmosphere, the troposphere, controls how much sunlight gets through to the planet, how much is trapped in our skies, and how much goes back out to space. Higher in the stratosphere, where most of the Earth’s ozone shield protects the surface from harmful ultraviolet rays, there is very little water (less than .001 of the surface concentration). Scientists don’t fully understand how air is dried before it gets to this region.

In the troposphere, water exists as vapor in air, as liquid droplets in clouds, and as frozen ice particles in high altitude cirrus clouds. Since there is so much water closer to Earth and so few miles above, it is important to understand how water enters and leaves the stratosphere. The “isotopic content,” the natural fingerprint left by the heavy forms of water, is key to understanding the process. An isotope is any of two or more forms of an element having the same or very closely related chemical properties and the same atomic number, but different atomic weights. An example is oxygen 16 versus oxygen 18– both are oxygen, but one is heavier than the other.

Heavy water is more readily condensed or frozen out from its vapor, causing the nature of its distribution to differ somewhat from the usual isotopic form of water. A measurement of the isotopic make-up of water vapor enables scientists to determine how water gets into the stratosphere.

“For the first time, we have water isotope content mapped in incredible detail,” said Dr. Christopher R. Webster, a senior research scientist at NASA’s Jet Propulsion Laboratory, Pasadena, Calif. Webster is principal author of a scientific paper announcing the new findings in the journal Science. Dr. Andrew J. Heymsfield, of the National Center for Atmospheric Research, Boulder, Colo., is co-author.

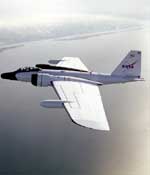
Measuring water isotopes is extremely challenging, because they represent only a small fraction, less than one percent, of the total water in the atmosphere. Detailed measurements were made using an Aircraft laser infrared absorption spectrometer (Alias) flying aboard NASA’s WB-57F high- altitude jet aircraft in July 2002. This new laser technique enables mapping of water isotopes with sufficient resolution to help researchers understand both water transport and the detailed microphysics of clouds, key parameters for understanding atmospheric composition, storm development and weather prediction.

“The laser technique gives us the ability to measure the different types of isotopes found in all water,” said Webster. “With the isotopic fingerprint, we discovered the ice particles found under the stratosphere were lofted from below, and some were grown there in place.”

The data help explain how the water content of air entering the stratosphere is reduced, and show that gradual ascent and rapid upward motion associated with tall cloud systems (convective lofting) both play roles in establishing the dryness of the stratosphere.

The purpose of the aircraft mission was to understand the formation, extent and processes associated with cirrus clouds. The mission used six aircraft from NASA and other federal agencies to make observations above, in and below the clouds. By combining aircraft data with ground-based data and satellites, scientists have a better picture of the relationship between clouds, water vapor and atmospheric dynamics than previously. They also can better interpret satellite measurements routinely made by NASA.

The mission was funded by NASA’s Earth Science Enterprise. The Enterprise is dedicated to understanding the Earth as an integrated system and applying Earth System Science to improve prediction of climate, weather and natural hazards using the unique vantage point of space. For more information about Alias, visit: http://laserweb.jpl.nasa.gov.

For information about NASA, visit: http://www.nasa.gov.

JPL is managed for NASA by the California Institute of Technology in Pasadena

Original Source: NASA/JPL News Release

Force on Asteroids Measured for the First Time

Image credit: NASA/JPL

NASA scientists have measured a tiny force for the first time which is known to act on asteroids; subtly changing their orbits and speed of rotation. The force, called the Yarkovsky Effect, is produced by the way an asteroid absorbs energy from the Sun, and then radiates it back into space as heat – the force is tiny, only a few grams, but over time it can make a significant change. Asteroid 6489 has been tracked by astronomers since 1991, and they’ve found that it’s shifted its orbit 15 km since then.

NASA scientists have for the first time detected a tiny but theoretically important force acting on asteroids by measuring an extremely subtle change in a near-Earth asteroid?s orbital path. This force, called the Yarkovsky Effect, is produced by the way an asteroid absorbs energy from the sun and re-radiates it into space as heat. The research will impact how scientists understand and track asteroids in the future.

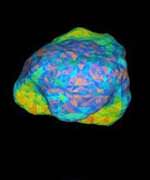
Asteroid 6489 “Golevka” is relatively inconspicuous by near- Earth asteroid standards. It is only one half-kilometer (.33 mile) across, although it weighs in at about 210 billion kilograms (460 billion pounds). But as unremarkable as Golevka is on a celestial scale it is also relatively well characterized, having been observed via radar in 1991, 1995, 1999 and this past May. An international team of astronomers, including researchers from NASA’s Jet Propulsion Laboratory in Pasadena, Calif., have used this comprehensive data set to make a detailed analysis of the asteroid?s orbital path. The team’s report appears in the December 5 issue of “Science.”

“For the first time we have proven that asteroids can literally propel themselves through space, albeit very slowly,” said Dr. Steven Chesley, a scientist at NASA?s Jet Propulsion Laboratory and leader of the study.

The idea behind the Yarkovsky Effect is the simple notion that an asteroid?s surface is heated by the sun during the day and then cools off during the night. Because of this the asteroid tends to emit more heat from its afternoon side, just as the evening twilight on Earth is warmer than the morning twilight. This unbalanced thermal radiation produces a tiny acceleration that has until now gone unmeasured.

“The amount of force exerted by the Yarkovsky Effect, about an ounce in the case of Golevka, is incredibly small, especially considering the asteroid?s overall mass,” said Chesley. “But over the 12 years that Golevka has been observed, that small force has caused a shift of 15 kilometers (9.4 miles). Apply that same force over tens of millions of years and it can have a huge effect on an asteroid?s orbit. Asteroids that orbit the Sun between Mars and Jupiter can actually become near-Earth asteroids.”

The Yarkovsky Effect has become an essential tool for understanding several aspects of asteroid dynamics. Theoreticians have used it to explain such phenomena as the rate of asteroid transport from the main belt to the inner solar system, the ages of meteorite samples, and the characteristics of so-called “asteroid families” that are formed when a larger asteroid is disrupted by collision. And yet, despite its profound theoretical significance, the force has never been detected, much less measured, for any asteroid until now.

“Once a near-Earth asteroid is discovered, radar is the most powerful astronomical technique for measuring its physical characteristics and determining its exact orbit,” said Dr. Steven Ostro, a JPL scientist and a contributor to the paper. “To give you an idea of just how powerful ? our radar observation was like pinpointing to within a half inch the distance of a basketball in New York using a softball-sized radar dish in Los Angeles.”

To obtain their landmark findings, the scientists utilized an advanced model of the Yarkovsky Effect developed by Dr. David Vokrouhlick? of Charles University, Prague. Vokrouhlick? led a 2000 study that predicted the possibility of detecting the subtle force acting on Golevka during its 2003 approach to Earth.

“We predicted that the acceleration should be detectable, but we were not at all certain how strong it would be,” said Vokrouhlick?. “With the radar data we have been able to answer that question.”

Using the measurement of the Yarkovsky acceleration the team has for the first time determined the mass and density of a small solitary asteroid using ground-based observations. This opens up a whole new avenue of study for near-Earth asteroids, and it is only a matter of time before many more asteroids are “weighed” in this manner.

In addition to Chesley, Ostro and Vokrouhlick?, authors of the report include Jon Giorgini, Dr. Alan Chamberlin and Dr. Lance Benner of JPL; David ?apek, Charles University, Prague, Dr. Michael Nolan, Arecibo Observatory, Puerto Rico, Dr. Jean-Luc Margot, University of California, Los Angeles, and Alice Hine, Arecibo Observatory, Puerto Rico.

Arecibo Observatory is operated by Cornell University under a cooperative agreement with the National Science Foundation and with support from NASA. NASA?s Office of Space Science, Washington, DC supported the radar observations. JPL is managed for NASA by the California Institute of Technology in Pasdena.

More information about NASA’s planetary missions, astronomical observations, and laboratory measurements are available on the Internet at: http://neo.jpl.nasa.gov/

Information about NASA programs is available on the Internet at: www.nasa.gov

JPL is managed for NASA by the California Institute of Technology in Pasadena

Original Source: NASA/JPL News Release
Astronauts Announced for STS-121

Image credit: NASA

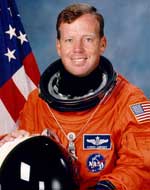
NASA has announced four astronauts who will launch on the space shuttle for mission STS-121; the mission after the shuttle returns to flight in late 2004. STS-121 was added to the schedule to help take over some of the tasks that were originally required on the Return to Flight mission. Commander Steven W. Lindsey, pilot Mark E. Kelly and mission specialists Carlos I. Noriega and Michael E. Fossum will be joined by three more unnamed crew members. They will re-supply the International Space Station and continue testing new hardware developed as part of the return to flight process.

Four NASA astronauts have been chosen to fly on the newly created Space Shuttle mission, STS-121. It is the mission following the Space Shuttle’s Return to Flight.

Veteran astronaut Steven W. Lindsey (Col., USAF) is the commander of STS-121. Mark E. Kelly (Cmdr., USN) is the pilot; Carlos I. Noriega (Lt. Col., USMC, Ret.) and Michael E. Fossum are the mission specialists. Other crewmembers will be named later.

STS-121 was added to the flight schedule to help accommodate the growing list of requirements originally assigned to the Return to Flight mission. The crew will re-supply the International Space Station with equipment and consumables. They will also continue the testing and development of new hardware and procedures designed to make Space Shuttle flight safer.

The crew recently began their pre-mission training together at NASA’s Johnson Space Center, Houston. Initial activities focus on general procedural training on Shuttle and Station systems, preliminary spacewalk development and robotics training.

Lindsey is a three-time Shuttle astronaut, including commanding the STS-104 mission in 2001. Kelly has flown in space once, and Noriega twice. Fossum is making his first trip.

For crew biographies visit:

http://www.jsc.nasa.gov/Bios/

For information about NASA and the human space flight program on the Internet, visit:

http://www.nasa.gov

Original Source: NASA News Release

Astronomers Find a Pair of Neutron Stars

Image credit: CSIRO

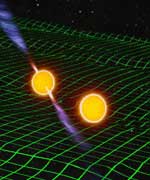
Astronomers have discovered a pair of neutron stars that could assist in the search for the long theorized “gravity waves”, first predicted by Einstein. Separated by only 800,000 kilometres, the twin objects take only two hours to rotate each other. The theory is that the pair is losing energy in the form of gravity waves, and will eventually slow down and merge with a blast of energy. This new discovery tells astronomers that these twin neutron stars are more common than previously believed, and new gravity wave detectors should locate a merger every year or two, and not once a decade.

Neutron star pairs may merge and give off a burst of gravity waves about six times more often than previously thought, scientists report in today?s issue of the journal Nature [4 December]. If so, the current generation of gravity-wave detectors might be able to register such an event every year or two, rather than about once a decade ? the most optimistic prediction until now.

Gravity waves were predicted by Einstein?s general theory of relativity. Astronomers have indirect evidence of their existence but have not yet detected them directly.

The revised estimate of the neutron-star merger rate springs from the discovery of a double neutron-star system, a pulsar called PSR J0737-3039 and its neutron-star companion, by a team of scientists from Italy, Australia, the UK and the USA using the 64-m CSIRO Parkes radio telescope in eastern Australia.

Neutron stars are city-sized balls of a highly dense, unusual form of matter. A pulsar is a special type ? a spinning neutron star that emits radio waves.

PSR J0737-3039 and its companion are just the sixth known system of two neutron stars. They lie 1600-2000 light-years (500-600 pc) away in our Galaxy.

Separated by 800,000 km ? about twice the distance between the Earth and Moon ? the two stars orbit each other in just over two hours.

Systems with such extreme speeds have to be modelled with Einstein?s general theory of relativity.

?That theory predicts that the system is losing energy in the form of gravity waves,? said lead author Marta Burgay, a PhD student at the University of Bologna.

?The two stars are in a ?dance of death?, slowly spiralling together.?

In 85 million years the doomed stars will fuse, rippling spacetime with a burst of gravity waves.

?If the burst happened in our time, it could be picked up by one of the current generation of gravitational wave detectors, such as LIGO-I, VIRGO or GEO? said team leader Professor Nicol? D?Amico, Director of the Cagliari Astronomical Observatory in Sardinia.

The previous estimate of the neutron-star merger rate was strongly influenced by the characteristics of just one system, the pulsar B1913+16 and its companion. PSR B1913+16 was the first relativistic binary system discovered and studied, and the first used to show the existence of gravitational radiation.

PSR J0737-3039 and its companion are an even more extreme system, and now form the best laboratory for testing Einstein?s prediction of orbital shrinking.

The new pulsar also boosts the merger rate, for two reasons.

It won?t live as long as PSR B1913+16, the astronomers say. And pulsars like it are probably more common than ones like PSR B1913+16.

?These two effects push the merger rate up by a factor of six or seven,? said team member Dr Dick Manchester of CSIRO.

But the actual numerical value of that rate depends on assumptions about how pulsars are distributed in our Galaxy.

?Under the most favourable distribution model, we can say at the 95% confidence level that this first generation of gravitational wave detectors could register a neutron star merger every one to two years,? said Dr Vicky Kalogera, Assistant Professor of Physics and Astronomy at Northwestern University in Illinois, USA.

Dr Kalogera and colleagues Chunglee Kim and Duncan Lorimer have modelled binary coalescence rates using a range of assumptions.

The new result is ?good news for gravity-wave astronomers,? according to team member Professor Andrew Lyne, Director of the Jodrell Bank Observatory of the University of Manchester in the UK.

?They may get to study one of these cosmic catastrophes every few years, instead of having to wait half a career,? he said.

Original Source: CSIRO News Release

The Gamble of Getting to Mars

Image credit: NASA/JPL

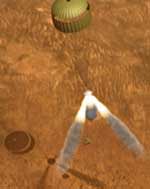
The odds aren’t great. For every three missions sent to Mars, two fail. With NASA’s twin rovers, Spirit and Opportunity, now only a few weeks away from their encounter with the Red Planet, it’s important to appreciate the challenges they still have to face. Already in space for five months, they’ve endured several solar storms. But the hardest work is still to come: they have to decelerate through the atmosphere, deploy their parachutes, and then land on their airbags.

Two out of three missions to the red planet have failed. One reason there have been so many losses is that there have been so many attempts. “Mars is a favorite target,” says Dr. Firouz Naderi, manager of the Mars Program Office at the Jet Propulsion Laboratory. “We — the United States and former USSR — have been going to Mars for 40 years. The first time we flew by a planet, it was Mars. The first time we orbited a planet, it was Mars. The first time we landed on a planet it was Mars, and the first time we roved around the surface of a planet, it was Mars. We go there often.”

Another reason is that getting to Mars is hard.

To get there, Spirit and Opportunity, the two Mars Exploration Rovers launched this past June and July, will have to fly through about 483 million kilometers (300 million miles) of deep space and target a very precise spot to land. Adjustments to their flight paths can be made along the way, but a small trajectory error can result in a big detour and or even missing the planet completely.

The space environment isn’t friendly. Hazards range from what engineers call “single event upsets,” as when a stray particle of energy passes through a chip in the spacecraft’s computer causing a glitch and possibly corrupting data, to massive solar flares, such as the ones that occurred this fall, that can damage or even destroy spacecraft electronics.

The road to the launch pad is nearly as daunting as the journey to Mars. Even before the trip to Mars can begin, a craft must be built that not only can make the arduous trip but can complete its science mission once it arrives. Nothing less than exceptional technology and planning is required.

If getting to Mars is hard, landing there is even harder. “One colleague describes the entry, descent and landing as six minutes of terror,” says Naderi.

Spirit and Opportunity will enter the martian space traveling 19,300 kilometers per hour (12,000 miles per hour). “During the first four minutes into descent, we use friction with the atmosphere to slow us down considerably,” says Naderi. “However, at the end of this phase, we’re still traveling at 1,600 kilometers per hour (1,000 miles per hour), but now we have only 100 seconds left and are at the altitude that a commercial airliner typically flies. Things need to happen in a hurry. A parachute opens to slow the spacecraft down to ‘only’ 321 kilometers per hour (200 miles per hour), but now we have only 6 seconds left and are only 91 meters (100 yards) off the ground. Now, the retro rockets fire to bring the spacecraft down to zero velocity, and we’re the height of a four-story building above the surface. The spacecraft freefalls the rest of the way cocooned in airbags to cushion the blow. It hits the ground at 48 kilometers per hour (30 miles per hour) or 80 kilometers per hour (50 miles per hour) if it is windy. It bounces as high as a four-story building and continues to bounce afterward, perhaps 30 times all together. What’s inside the airbag weighs 453 kilograms (half a ton). So, the challenge of entry, descent and landing is how to get something that massive traveling at 19,300 kilometers per hour (12,000 miles per hour) slowed down in six minutes to have a chance of survival.”

Mars doesn’t exactly put out a welcome mat. Landing is complicated by difficult terrain. The martian surface is full of obstacles–massive impact craters, cliffs, cracks and jagged boulders. Even the toughest airbag can be punctured if it hits a bad rock. Unpredictable winds can also stir up further complications.

No matter how hard it is, getting to Mars is just the beginning. “The challenge after we land,” says Rob Manning, manager of Mars Exploration Rovers entry, descent and landing operations, “is how to get the vehicle out of its cramped cocoon and into a vehicle roving in such a way as to please the scientists.”

The rewards are great. “Mars is the most Earth-like of the planets in our solar system,” says Naderi. “It has the potential to have been an abode of life.”

The risks are also great. “We do everything humanly possible and try to avoid human mistakes,” says Naderi. “That’s why we check, double check, test and test again and then have independent eyes check everything again. Humans, even very smart humans, are fallible particularly when many thousands of parameters are involved. But even if you have done the best engineering possible, you still don’t know what Mars has in store for you on the day your arrive. Mars can get you.”

“We are in a tough business,” says Naderi. “It is like climbing Mt. Everest. No matter how good you are, you are going to lose your grip sometimes and fall back. Then you have a choice, either retreat to the relative comfort and safety of the base camp, or get up, dust yourself off, get a firmer grip and a surer toehold and head back up for the summit. The space business is not about base camps. It is about summits. And, the exhilaration of discoveries you make once you get there. That is what drives you on.”

Original Source: NASA/JPL News Release
Earth’s Field Opens Up for the Solar Wind

Image credit: NASA

Researchers have discovered that temporary cracks can form in the Earth’s magnetic field that can permit some of the solar wind’s energy to slip through and disrupt electronics and communications. These observations were made using NASA’s Imager for Magnetopause to Aurora Global Exploration (IMAGE) satellite, which tracked a large aurora for several hours. The ESA’s Cluster satellites flew over the same location and spotted a stream of ions slipping through a crack which normally should have been deflected by the Earth’s magnetosphere.

Immense cracks in the Earth’s magnetic field remain open for hours, allowing the solar wind to gush through and power stormy space weather, according to new observations from the IMAGE and Cluster satellites.

The cracks were detected before but researchers now know they can remain open for long periods, rather than opening and closing for just very brief intervals. This new discovery about how the Earth’s magnetic shield is breached is expected to help space physicists give better estimates of the effects of severe space weather.

“We discovered that our magnetic shield is drafty, like a house with a window stuck open during a storm,” said Dr. Harald Frey of the University of California, Berkeley, lead author of a paper on this research published Dec. 4 in Nature. “The house deflects most of the storm, but the couch is ruined. Similarly, our magnetic shield takes the brunt of space storms, but some energy continually slips through its cracks, sometimes enough to cause problems with satellites, radio communication, and power systems.”

“The new knowledge that the cracks are open for long periods, instead of opening and closing sporadically, can be incorporated into our space weather forecasting computer models to more accurately predict how our space weather is influenced by violent events on the Sun,” said Dr. Tai Phan, also of UC Berkeley, co-author of the Nature paper.

The solar wind is a stream of electrically charged particles (electrons and ions) blown constantly from the Sun (Image 1). The solar wind transfers energy from the Sun to the Earth through the magnetic fields it carries and its high speed (hundreds of miles/kilometers per second). It can get gusty during violent solar events, like Coronal Mass Ejections (CMEs), which can shoot a billion tons of electrified gas into space at millions of miles per hour.

Earth has a magnetic field that extends into space for tens of thousands of miles, surrounding the planet and forming a protective barrier to the particles and snarled magnetic fields the Sun blasts toward it during CMEs. However, space storms, which can dump 1,000 billion watts — more than America’s total electric generating capacity — into the Earth’s magnetic field, indicated that the shield was not impenetrable.

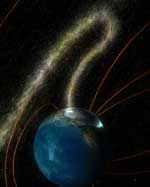
In 1961, Dr. Jim Dungey of the Imperial College, United Kingdom, predicted that cracks might form in the magnetic shield when the solar wind contained a magnetic field that was oriented in the opposite direction to a portion of the Earth’s field. In these regions, the two magnetic fields would interconnect through a process known as “magnetic reconnection,” forming a crack in the shield through which the electrically charged particles of the solar wind could flow. (Image 2 illustrates the crack formation, and Animation 1 shows how solar wind particles flow through the crack by following invisible magnetic field lines.) In 1979, Dr. Goetz Paschmann, of the Max Planck Institute for Extraterrestrial Physics, Germany, detected the cracks using the International Sun Earth Explorer (ISEE) spacecraft. However, since this spacecraft only briefly passed through the cracks during its orbit, it was unknown if the cracks were temporary features or if they were stable for long periods.

In the new observations, the Imager for Magnetopause to Aurora Global Exploration (IMAGE) satellite revealed an area almost the size of California in the arctic upper atmosphere (ionosphere) where a 75-megawatt “proton” aurora flared for hours (Image 4). This aurora, energetic enough to power 75,000 homes, was different from the visible aurora known as the Northern and Southern lights. It was generated by heavy particles (ions) hitting the upper atmosphere and causing it to emit ultraviolet light, which is invisible to the human eye but detectable by the Far Ultraviolet Imager on IMAGE. (Image 6 and Animation 4 show IMAGE’s observations of the proton aurora).

While the aurora was being recorded by IMAGE, the 4-satellite Cluster constellation flew far above IMAGE, directly through the crack, and detected solar wind ions streaming through (Image 5). Normally, these solar wind ions would be deflected by Earth’s shield (Image 3), so Cluster’s observation showed a crack was present. This stream of solar wind ions bombarded our atmosphere in precisely the same region where IMAGE saw the proton aurora. The fact that IMAGE was able to view the proton aurora for more than 9 hours, until IMAGE progressed in its orbit to where it could not observe the aurora, implies that the crack remained continuously open. (Animation 2 shows how the spacecraft worked together to reveal the crack.) Estimating from the IMAGE and Cluster data, the crack was twice the size of the Earth at the boundary of our magnetic shield, about 38,000 miles (60,000 km) above the planet’s surface. Since the magnetic field converges as it enters the Earth in the polar regions, the crack narrowed to about the size of California down near the upper atmosphere.

IMAGE is a NASA satellite launched March 25, 2000 to provide a global view of the space around Earth influenced by the Earth’s magnetic field. The Cluster satellites, built by the European Space Agency and launched July 16, 2000, are making a three-dimensional map of the Earth’s magnetic field.

Original Source: NASA News Release