
After considering the possibility of giving away a flight to the International Space Station, Florida Lottery officials have decided people would probably just want the cash. The idea of a space lottery had been suggested by Space Adventures, an Arlington, VA company with a contract to sell two seats on upcoming Soyuz flights to the station. Florida Lottery officials didn’t reject the idea outright, but said that prize-based lotteries are never successful – even space enthusiasts would probably take $20 million in cash over a trip to space.
Russia Will Be Supplying Station Crews
Russian space officials confirmed this week that they will be delivering new crews to the International Space Station for at least the next year. Russia is planning to launch two missions to the station next year, with guaranteed spots for a Russian cosmonaut and American astronaut on each flight. A Soyuz in April will also carry an astronaut from the European Space Agency, but later flights could be available for tourist flights. Russia is considering five potential tourist candidates.
Cassini Collects Particles Accelerated by the Sun
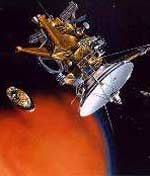
Image credit: NASA/JPL
NASA’s Saturn-bound spacecraft, Cassini, has made the first observation of interstellar pickup ions beyond the orbit of Jupiter. These are neutral particles in the solar system that get ionized when they get too close to the Sun, and then travel outwards with the solar wind. These ions have been seen near the Earth, but never out past the orbit of Jupiter. By measuring these particles, astronomers will have a better understanding of the low-density gas and dust that exists between the stars.
More than a year before the Cassini spacecraft arrives at Saturn, the Cassini Plasma Spectrometer (CAPS) has made the first in situ observations of interstellar pickup ions beyond the orbit of Jupiter. This is the first major discovery using data gathered by CAPS, destined to reach Saturn in July 2004.
Pickup ions are neutral particles in the solar system that become ionized near the Sun and join the solar wind, the supersonic stream of charged particles flowing out from the Sun. By observing these pickup ions, researchers can better understand the interstellar medium, the low-density gas and dust that fill the space between stars.
Astronomers have observed interstellar pickup ions as early as 1985 from a distance of 1 astronomical unit (AU, the distance from the Earth to the Sun), but never before have they seen pickup ions beyond 5 AU — Jupiter’s orbit. The CAPS team uploaded software that allowed the instrument to collect and transmit detections of the relatively rare pickup ions it encounters on its journey to Saturn.
During the observation period of October 2001 to February 2003 at distances of 6.4 to 8.2 AU, the instrument collected 2,627 samples. Analyses revealed that there is a strong depletion of hydrogen pickup ions compared to helium pickup ions in the region behind the Sun. The team determined that this newly observed depletion, or “interstellar hydrogen shadow,” is produced by radiation pressure and ionization of the neutrals. Most hydrogen atoms cannot penetrate into the downstream shadow region because they must pass near the Sun where they have a high probability of being ionized and swept out with the solar wind.
“These are very hard particles to measure because there are so few of them,” says Dr. David J. McComas, senior executive director of the SwRI Space Science and Engineering Division. “Previous models have included something like this interstellar hydrogen shadow, but these are the first direct measurements of it.”
Institute Scientist Dr. David T. Young is principal investigator of the CAPS instrument, the largest, most complex space plasma instrument flown to date, which will detect and analyze plasma (electrons and ions) found throughout the solar system. The overall mission of the Cassini spacecraft is to image the Saturn system at infrared, ultraviolet and visible wavelengths and to directly sample the dust, neutral and charged particle environment. Cassini also carries the Huygens probe, built by the European Space Agency, to study Saturn’s moon, Titan.
“This is certainly the first of many new discoveries to come by the Cassini spacecraft, and the Cassini Plasma Spectrometer in particular,” says McComas. “To have been able to make such an important contribution to heliospheric phenomenon on the way out to Saturn has been a great treat.”
SwRI also leads a feasibility study for the proposed Interstellar Boundary Explorer (IBEX) program, one of five candidates vying to fill two NASA mission slots. If selected, the program would launch a pair of energetic neutral atom cameras to directly image the interaction between the solar system and the interstellar medium – the region that the interstellar neutrals must flow through to enter the heliosphere.
The paper “The Interstellar Hydrogen Shadow: Observations of Interstellar Pickup Ions Beyond Jupiter,” is being presented December 9 at the American Geophysical Union (AGU) meeting in San Francisco and is in press in the Journal of Geophysical Research.
Original Source: SWRI News Release
Shuttle’s Wings Will Detect When They’re Damaged
NASA is planning to embed special sensors into the wings of the space shuttle fleet that will detect when they’ve been damaged – it was a foam strike like this that led to the destruction of Columbia nearly a year ago. A member of the safety oversight panel said that the sensors would be able to detect a hit, but not the extent of the damage, so astronauts would still need to spacewalk outside the shuttle to inspect it. Installing these sensors isn’t a requirement for the shuttle’s return to flight, but NASA believes it can have the work done by September 2004 – when the first shuttle is expected to lift off again.
New Doubts Over Dark Energy
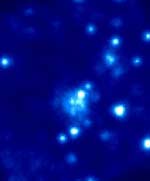
Image credit: ESA
It was only a few years ago that astronomers shook up current models of the Universe with the theory of dark energy; which says that the expansion of the Universe is actually accelerating. But new evidence gathered by the ESA’s XMM-Newton X-ray observatory has cast some doubt on the theory. By looking at distant galaxy clusters – up to 10 billion light-years away – the ESA astronomers found they contained more concentrated matter than the theory of dark energy would predict. If matter was so concentrated, the Universe can’t be 70% dark energy.
ESA’s X-ray observatory, XMM-Newton, has returned tantalising new data about the nature of the Universe. In a survey of distant clusters of galaxies, XMM-Newton has found puzzling differences between today’s clusters of galaxies and those present in the Universe around seven thousand million years ago. Some scientists claim that this can be interpreted to mean that the ‘dark energy’ which most astronomers now believe dominates the Universe simply does not exist?
Observations of eight distant clusters of galaxies, the furthest of which is around 10 thousand million light years away, were studied by an international group of astronomers led by David Lumb of ESA’s Space Research and Technology Centre (ESTEC) in the Netherlands. They compared these clusters to those found in the nearby Universe. This study was conducted as part of the larger XMM-Newton Omega Project, which investigates the density of matter in the Universe under the lead of Jim Bartlett of the College de France.
Clusters of galaxies are prodigious emitters of X-rays because they contain a large quantity of high-temperature gas. This gas surrounds galaxies in the same way as steam surrounds people in a sauna. By measuring the quantity and energy of X-rays from a cluster, astronomers can work out both the temperature of the cluster gas and also the mass of the cluster.
Theoretically, in a Universe where the density of matter is high, clusters of galaxies would continue to grow with time and so, on average, should contain more mass now than in the past.
Most astronomers believe that we live in a low-density Universe in which a mysterious substance known as ‘dark energy’ accounts for 70% of the content of the cosmos and, therefore, pervades everything. In this scenario, clusters of galaxies should stop growing early in the history of the Universe and look virtually indistinguishable from those of today.
In a paper soon to be published by the European journal Astronomy and Astrophysics, astronomers from the XMM-Newton Omega Project present results showing that clusters of galaxies in the distant Universe are not like those of today. They seem to give out more X-rays than today. So clearly, clusters of galaxies have changed their appearance with time.
In an accompanying paper, Alain Blanchard of the Laboratoire d’Astrophysique de l’Observatoire Midi-Pyr?n?es and his team use the results to calculate how the abundance of galaxy clusters changes with time. Blanchard says, “There were fewer galaxy clusters in the past.”
Such a result indicates that the Universe must be a high-density environment, in clear contradiction to the ‘concordance model,’ which postulates a Universe with up to 70% dark energy and a very low density of matter. Blanchard knows that this conclusion will be highly controversial, saying, “To account for these results you have to have a lot of matter in the Universe and that leaves little room for dark energy.”
To reconcile the new XMM-Newton observations with the concordance models, astronomers would have to admit a fundamental gap in their knowledge about the behaviour of the clusters and, possibly, of the galaxies within them. For instance, galaxies in the faraway clusters would have to be injecting more energy into their surrounding gas than is currently understood. That process should then gradually taper off as the cluster and the galaxies within it grow older.
No matter which way the results are interpreted, XMM-Newton has given astronomers a new insight into the Universe and a new mystery to puzzle over. As for the possibility that the XMM-Newton results are simply wrong, they are in the process of being confirmed by other X-ray observations. Should these return the same answer, we might have to rethink our understanding of the Universe.
The contents of the Universe
The content of the Universe is widely thought to consist of three types of substance: normal matter, dark matter and dark energy. Normal matter consists of the atoms that make up stars, planets, human beings and every other visible object in the Universe. As humbling as it sounds, normal matter almost certainly accounts for a small proportion of the Universe, somewhere between 1% and 10%.
The more astronomers observed the Universe, the more matter they needed to find to explain it all. This matter could not be made of normal atoms, however, otherwise there would be more stars and galaxies to be seen. Instead, they coined the term dark matter for this peculiar substance precisely because it escapes our detection. At the same time, physicists trying to further the understanding of the forces of nature were starting to believe that new and exotic particles of matter must be abundant in the Universe. These would hardly ever interact with normal matter and many now believe that these particles are the dark matter. At the present time, even though many experiments are underway to detect dark matter particles, none have been successful. Nevertheless, astronomers still believe that somewhere between 30% and 99% of the Universe may consist of dark matter.
Dark energy is the latest addition to the contents of the Universe. Originally, Albert Einstein introduced the idea of an all-pervading ‘cosmic energy’ before he knew that the Universe is expanding. The expanding Universe did not need a ‘cosmological constant’ as Einstein had called his energy. However, in the 1990s observations of exploding stars in the distant Universe suggested that the Universe was not just expanding but accelerating as well. The only way to explain this was to reintroduce Einstein’s cosmic energy in a slightly altered form, called dark energy. No one knows what the dark energy might be.
In the currently popular ‘concordance model’ of the Universe, 70% of the cosmos is thought to be dark energy, 25% dark matter and 5% normal matter.
Original Source: ESA News Release
Best Ultraviolet Image of Andromeda Galaxy

Image credit: NASA
NASA’s Galaxy Evolution Explorer (GALEX) has captured the most sensitive and comprehensive ultraviolet images ever taken of the Andromeda galaxy, M31. By studying the galaxy in the ultraviolet spectrum, astronomers can study some of the fundamental processes that lead the formation of new stars. A new collection of images included Andromeda, as well as the globular cluster M2, and the sky in the constellation of Bootes. GALEX was launched in April, 2003, and will map the sky in the ultraviolet spectrum, looking back to 10 billion years ago.
The most sensitive and comprehensive ultraviolet image ever taken of the Andromeda Galaxy, our nearest large neighbor galaxy, has been captured by NASA?s Galaxy Evolution Explorer. The image is one of several being released to the public as part of the mission?s first collection of pictures.
“The Andromeda image gives us a snapshot of the most recent star formation episode,” said Dr. Christopher Martin, Galaxy Evolution Explorer principal investigator and an astrophysics professor at the California Institute of Technology in Pasadena, which leads the mission. ?By studying this view of the galaxy in the process of forming stars, we can better understand how that fundamental process works, such as where stars form, how fast and why.?
The image of Andromeda, the most distant object the naked eye can see, is a mosaic of nine images taken in September and October of 2003. It combines two ultraviolet colors, one near ultraviolet (red) and one far ultraviolet (blue).
For comparison, a second image shows the Andromeda Galaxy, also called Messier 31, in visible light. Both images, along with other new pictures from the Galaxy Evolution Explorer, are available online at http://www.galex.caltech.edu and http://photojournal.jpl.nasa.gov/mission/GALEX . The new collection of images also includes views of several nearby galaxies; Stephan’s Quintet of Galaxies; an all-sky survey image of the globular star cluster M2; and a deep image of the sky in the constellation Bootes. The Galaxy Evolution Explorer team is also releasing the first batch of scientific data, so the science community can propose additional observations for the mission. These images and data display the power of the Galaxy Evolution Explorer to collect sensitive ultraviolet images of large parts of the sky.
“It?s very rewarding and exciting for the team to see the fruits of their labors,” said Kerry Erickson, the mission?s project manager at NASA?s Jet Propulsion Laboratory, Pasadena, Calif. ?Because people are accustomed to seeing objects in visible light, it?s amazing to see how different the universe looks in ultraviolet and how much information is revealed to us by those observations.?
Scientists are interested in learning more about the Andromeda galaxy, including its brightness, mass, age, and the distribution of young star clusters in its spiral arms. This will provide a tremendous amount of information about the mechanisms of star formation in galaxies, and will help them interpret ultraviolet and infrared observations of other, more distant galaxies.
The Galaxy Evolution Explorer launched on April 28, 2003. Its goal is to map the celestial sky in the ultraviolet and determine the history of star formation in the universe over the last 10 billion years. From its orbit high above Earth, the spacecraft will sweep the skies for up to 28 months using state-of-the-art ultraviolet detectors. Looking in the ultraviolet singles out galaxies dominated by young, hot, short-lived stars that give off a great deal energy at that wavelength. These galaxies are actively creating stars, and therefore provide a window into the history and causes of galactic star formation.
In addition to leading the mission, Caltech is also responsible for science operations and data analysis. JPL, a division of Caltech, manages the mission and led the science instrument development. The mission is part of NASA’s Explorers Program, managed by the Goddard Space Flight Center, Greenbelt, Md. The mission’s international partners are France and South Korea. Caltech manages JPL for NASA
Original Source: NASA News Release
Nozomi Has Failed
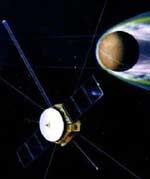
Image credit: JAXA
The Japan Aerospace Exploration Agency (JAXA) has reportedly given up their efforts to have their Mars-bound spacecraft Nozomi reach the Red Planet. A solar flare in 2002 damaged the spacecraft’s electronics and prevented its thrusters from working properly. Engineers were working up until the last minute, but in the end they weren’t able to get the equipment working again. Nozomi will now follow a wide orbit around Mars and then slingshot out into space. Spacecraft from NASA and the European Space Agency will arrive at Mars over the next couple of months.
The Canadian Space Agency (CSA) today confirmed that the Japanese satellite Nozomi has been rerouted away from Mars by JAXA, the Japan Aerospace Exploration Agency. Crucial orbit insertion manoeuvers were impossible to achieve because of defective equipment onboard and the mission has been canceled. Nozomi will now follow a harmless large elliptic solar orbit.
Canada was a partner in this international Mars mission with a $ 5 million Canadian-built scientific instrument onboard — the Thermal Plasma Analyser (TPA). The TPA was designed to analyse the Martian atmosphere to better understand its origin and composition. The University of Calgary was leading the TPA research team and Canadian firms COM DEV International (Cambridge, Ont.), Pakwa Engineering (Saskatoon, Sask.), CAL Corp. (Ottawa, Ont.) and CompAS Electronics (Kanata, Ont.) were involved in the design and building of the instrument.
“This is not a total loss for the Canadian Space Program”, said Alain Berinstain, CSA’s acting Director of Planetary Exploration and Space Astronomy. TPA has positioned Canada as a preferred supplier of state-of-the-art science and technology. It has opened doors to current and future collaborations with Japan and with other countries involved in the exploration of the solar system. Our thoughts are with our colleagues and friends from Japan and we look forward to working with them again in the future.”
In April 2002, on its way to Mars, NOZOMI had experienced a very strong solar energetic proton event associated with a strong solar flare. This caused a short circuit in one of the subsystems and a loss of telemetry signal, which made the Mars orbit insertion impossible.
Original Source: Canadian Space Agency News Release
Mars Express Has Nearly Arrived
After traveling for more than 400 million kilometres, the European Space Agency’s Mars Express spacecraft has nearly arrived at the Red Planet. Things are about to get pretty busy. On December 19, the Beagle 2 lander will detach from the spacecraft and plunge through the Martian atmosphere six days later. At the same time that Beagle 2 is making its way down to the surface, the Mars Express orbiter will begin its aerobraking maneuvers to get into its final orbit around the Red Planet.
After a journey of 400 million km, ESA’s Mars Express is now approaching its final destination. On 19 December, the spacecraft is scheduled to release the Beagle 2 lander it has been carrying since its launch on 2 June.
At 9:31 CET, ESA’s ground control team at Darmstadt (Germany) will send the command for the Beagle 2 lander to separate from Mars Express. A pyrotechnic device will be fired to slowly release a loaded spring, which will gently push Beagle 2 away from the mother spacecraft.
Data on the spacecraft’s position and speed will be used by mission engineers to assess whether the lander was successfully released. In addition, the onboard Visual Monitoring Camera (VMC) should provide an image showing the lander slowly moving away. The image is expected to be available mid-afternoon.
Beagle 2 will then continue its journey towards the surface of Mars, where it is expected to land on 25 December, early in the morning. At the same time, the Mars Express orbiter should be manoeuvring to enter into orbit around Mars.
In view of the complexity of this operation, the Mars Express control team has been trained to deal with the eventuality that separation might not be achieved at the first attempt. If that did turn out to be the case, there is a series of procedures that has already been set up and tested for completing the manoeuvre successfully within the subsequent 40 hours.
The “separation” event can be followed live at ESA/ESOC on Friday 19 December from 8:30 to 15:00. A videoconference will link the control centre at Darmstadt with ESA Headquarters in Paris (F), and ESA/ESRIN at Frascati (I). Media wishing to attend are asked to complete the attached reply form and fax it to the Communication Office at the establishment of their choice.
Highlights of this event will be streamed over the Internet at http://mars.esa.int at the following times:
09:09 UT – 09:32 UT
11:25 UT – 11.47 UT
12:00 UT – 12:10 UT
As well as live streaming of key events, the Mars Express site will have daily news, features, images, videos and more.
Original Source: ESA News Release
SMART-1 at Full Speed
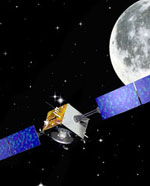
Image credit: ESA
The European Space Agency’s SMART-1 spacecraft is continuing to function well on its long roundabout mission to the Moon. The spacecraft recently completed its 139th orbit and everything seems to be functioning properly, despite the recent solar storms that damaged a few other satellites. It’s running its solar-powered ion drive full time now, and incrementally raising its distance with each orbit around the Earth. SMART-1 will reach its final orbit around the Moon in March 2005.
The spacecraft is now in its 139th orbit, in good operational status and with all functions performing nominally. As previously, the spacecraft was operated in electric propulsion mode almost continuously.
This week we had no flame-outs, probably due to the adopted strategy not to thrust when the orbital altitude is less than 10 000 km. The procedure to automatically re-start the engine after a flame-out will be uploaded to the on-board software this week. Once this is in place, the thrust phase will no longer be interrupted.
The total cumulated thrust time is now more than 946 hours and SMART-1 has consumed almost 15 kg of Xenon. Even with such a low fuel consumption the electric propulsion engine has so far provided a velocity increment of about 665 ms-1 (equivalent to about 2400 km per hour). The electric propulsion engine’s performance, periodically monitored from telemetry data and by ground stations tracking, continues to show a small over performance in thrust, varying from 1.1% to 1.5% over the last week.
The newly adopted strategy to thrust in a direction perpendicular to the position vector in the orbital plane has produced a large perigee increase in the last week of more than 1200 kilometres (see orbital elements and orbit picture).
The degradation of the electrical power produced by the solar arrays is now slowing down considerably. As a matter of fact the available power has remained more or less constant in the last 15 days. This means that the degradation by radiation has matched the increase of solar irradiance due to the nearing of the Earth’s perihelion, so that the net effect is zero. This is explained by the fact that no direct proton radiation from solar activity was experienced and the fact that the spacecraft now stays outside of the radiation belts for a considerable part of its orbit.
The communication, data handling and on-board software subsystems have been performing very well in the last week.
The thermal subsystem continues to perform well and all the temperatures are as expected. The temperature of the optical head on star tracker #1 is now lower than before. This is due to the changed thrust attitude which reduces the exposure to the Sun of the ?Z side of the spacecraft. Other attitudes are being considered in order to test the dependence of the star tracker’s temperature upon the spacecraft’s attitude.
Orbital/Trajectory information
The SMART-1 orbit is continuously modified by the effects of the electric propulsion low thrust. The osculating orbital elements are periodically computed by the ESOC specialists. These elements define the so called osculating orbit which would be travelled by the spacecraft if at that instant all perturbations, including EP thrust, would cease. So it is an image of the situation at that epoch. In reality the path travelled by the spacecraft is a continuous spiral leading from one orbit to another. The most recent osculating elements are as follows:
From the start, the electric propulsion system has managed to increase the semi-major axis of the orbit by 6750 km, increasing the perigee altitude from the original 656 km to 7012 km and the orbital period by more than four and a half hours, from the initial 10 hours 41 minutes to the present 15 hours 22 minutes.
Original Source: ESA News Release
Spring Thaws are Getting Earlier

Image credit: NASA
Using data from several NASA satellites, scientists believe that the Spring thaws in the Northern latitudes are arriving earlier and earlier each year. The change is so dramatic, that the thawing has come on average one day earlier each year since 1988. The shorter Winter warms up areas that were previously permafrost (permanently frozen), and this releases additional carbon dioxide into the atmosphere. Scientists are just starting to understand what role the polar areas have in the regulation of the Earth’s climate.
Using a suite of microwave remote sensing instruments aboard satellites, scientists at NASA’s Jet Propulsion Laboratory (JPL), Pasadena, Calif., and the University of Montana, Missoula, have observed a recent trend of earlier thawing across the northern high latitudes.
This regional thawing trend, advancing almost one day a year since 1988, has the potential to alter the cycle of atmospheric carbon dioxide intake and release by vegetation and soils across the region, potentially resulting in changes in Earth’s climate. The lengthening growing season appears to be promoting more carbon uptake by the vegetation than is being released into the atmosphere for the region. How long this trend will occur depends on whether soils continue to remain cold and wet.
Research scientists have been studying freeze/thaw dynamics in North America and Eurasia’s boreal forests and tundra to decipher effects on the timing and length of the growing season. These regions encompass almost 30 percent of global land area. They store a major portion of Earth’s carbon in vegetation, in seasonally frozen and permafrost soils. Large expanses of boreal forest and tundra are underlain by permafrost, a layer of permanently frozen soil found underneath the active, seasonally thawed soil.
“Frozen soil can store carbon for hundreds to thousands of years,” said lead author Dr. Kyle McDonald of JPL, “but when the permafrost thaws and begins to dry out, it releases the carbon back into the atmosphere.” The concern is that eventually carbon released from the soil will prevail over the amount being taken in by growing plants. Carbon dioxide levels in the atmosphere would increase at an accelerated rate, fostering even greater warming of the region and affecting global climate.
With help from NASA radars and other orbiting satellite microwave remote sensing instruments, including the National Oceanic and Atmospheric Administration’s Special Scanning Microwave/Imager, scientists can monitor growing season dynamics of the global boreal forest and tundra daily. These instruments sense the electrical properties of water in the landscape, allowing scientists to determine exactly when and where the springtime thaw occurs.
Because of the large extent and location of boreal forest and tundra, and the global reservoir of carbon stored in their vegetation and soils, this region is extremely sensitive to environmental change. It has the capacity to dramatically impact Earth’s climate.
“If global climate change is happening, here’s where you would expect to see it first,” McDonald said.
As the research team observed, the earlier the spring thaw occurs, the longer the growing season. These changes appear to be promoting plant growth for the region. The longer growing season allows plants to remove more carbon dioxide from the atmosphere over a longer period of time.
Carbon dioxide is an important greenhouse gas that, if left in the atmosphere, would promote additional warming. The plants release oxygen and store the carbon as biomass that eventually decomposes and transfers the carbon into the soil. Soil microbes decompose dead plant material, returning a portion of the soil carbon back into the atmosphere. The rate which soil microbes decompose plant material and release carbon to the atmosphere is also very sensitive to temperature. It could potentially increase with warming temperatures and longer growing seasons.
>From this general study, McDonald, Dr. John Kimball of the University of Montana, and JPL’s Erika Podest have lead three different investigations, each focusing on different noticeable changes in the boreal region. Results of three related papers on this research will be presented to the American Geophysical Union’s Fall Meeting this week in San Francisco.
The research is funded by NASA’s Earth Science Enterprise. The Enterprise is dedicated to understanding the Earth as an integrated system and applying Earth System Science to improve prediction of climate, weather, and natural hazards using the unique vantage point of space. The California Institute of Technology, Pasadena, manages JPL for NASA.
Original Source: NASA News Release