Hubble Snaps Closest Picture of Mars

Image credit: Hubble

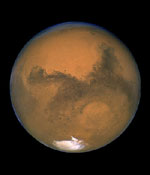
NASA’s Hubble Space Telescope snapped this beautiful picture of the Planet Mars when our two planets were only 56 million kilometres apart. The picture was actually assembled from a series of exposures taken between 2220-2312 GMT (6:20 – 7:12 pm EDT) – 11 hours before the moment of opposition. The picture shows many details on the planet’s surface, including impact craters, clouds, and dust storms. The next opportunity for a picture like this will be in 26 months, when our two planets are reasonably close again.

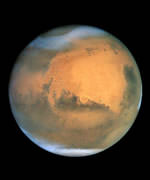
NASA’s Hubble Space Telescope snapped this portrait of Mars within minutes of the planet’s closest approach to Earth in nearly 60,000 years. This image was made from a series of exposures taken between 5:35 a.m. and 6:20 a.m. EDT Aug. 27 with Hubble’s Wide Field and Planetary Camera 2. In this picture, the red planet is 34,647,420 miles (55,757,930 km) from Earth.

This sharp, natural-color view of Mars reveals several prominent Martian features, including the largest volcano in the solar system, Olympus Mons; a system of canyons called Valles Marineris; an immense dark marking called Solis Lacus; and the southern polar ice cap.

Olympus Mons [the oval-shaped feature just above center] is the size of Arizona and three times higher than Mount Everest. The dormant volcano resides in a region called the Tharsis Bulge, which is about the size of the U.S. and home to several extinct volcanoes. The three Tharsis Montes volcanoes are lined up just below Olympus Mons. Faint clouds are hovering over Arsia Mons, the southernmost of these volcanoes.

The long, dark scar, below and to the right of the Tharsis Bulge, is Valles Marineris, a 2,480-mile (4,000-km) system of canyons. Just below Valles Marineris is Solis Lacus, also known as the “Eye of Mars.” The dark features to the left of Solis Lacus are the southern highlands, called Terra Sirenum, a region riddled with impact craters. The diameters of these craters range from 31 to 124 miles (50 to 200 km).

The image was taken during the middle of summer in the Southern Hemisphere. During this season the Sun shines continuously on the southern polar ice cap, causing the cap to shrink in size [bottom of image]. The orange streaks are indications of dust activity over the polar cap. The cap is made of carbon dioxide ice and water ice, but only carbon dioxide ice is seen in this image. The water ice is buried beneath the carbon dioxide ice. It will only be revealed when the cap recedes even more over the next two months. By contrast, the Northern Hemisphere is in the midst of winter. A wave of clouds covers the northern polar ice cap and the surrounding region [top of image].

This view of Mars reveals a striking contrast between the Northern and Southern hemispheres. The Northern Hemisphere is home to volcanoes that may have been active about 1 billion years ago. These volcanoes resurfaced the north’s landscape, perhaps filling in many impact craters. The Southern Hemisphere is pockmarked with ancient impact craters, which appear dark because many are filled with coarser sand-sized particles.

Mars and Earth make a “close encounter” about every 26 months. These periodic encounters are due to the differences in the two planets’ orbits. Earth goes around the Sun twice as fast as Mars, lapping the red planet about every two years. Both planets have elliptical orbits, so their close encounters are not always at the same distance. In its close encounter with Earth in 2001, for example, Mars was about 9 million miles farther away. Because Mars was much closer during this year’s rendezvous, the planet will appeared 23 percent larger in the sky. Mars will not be this close again until 2287.

This photograph is a color composite generated from observations taken with blue, green, and red filters. A total of 11 filters, spanning a wide wavelength range?-from blue to near infrared?-were used during the observations. The shorter wavelengths show clouds and other atmospheric changes. The longer wavelengths, including the near infrared, reveal Martian surface features.

Original Source: Hubble News Release

Cloudless Europe Seen From Space

Image credit: ESA

As the weather is starting to cool in Europe after a particularly hot summer, the European Space Agency snapped this picture of the continent with pretty much cloudless skies. The composite image was built up from a series of pictures snapped by the ESA’s Meteosat Second Generation 1 (MSG-1). The satellite was launched almost exactly a year ago and is positioned above Europe in geostationary orbit.

As most Europeans breathe a sigh of relief as this record-breaking summer draws to a close, the extreme weather conditions experienced in recent weeks have given us a rare view of an almost cloud-free Europe, taken by Europe?s weather satellite MSG-1, launched a year ago this week.

This enhanced composite image was taken on 10 August 2003, at midday (12:00 UT) and shows a virtually cloud-free Europe. Only the UK and Finland are partially obscured by cloud. Meteosat Second Generation 1 (MSG-1) is the first of a new generation of weather satellites, developed in close cooperation between the European Space Agency (ESA) and EUMETSAT, the European Organisation for the Exploitation of Meteorological Satellites.

Built by ESA and operated by EUMETSAT, MSG-1 was launched by Ariane, a year ago on 28 August at 22:45 UT, from Europe?s spaceport in French Guiana. MSG-1 is positioned in geostationary orbit, at 10.5?W 36 000 kilometres above the Earth. This image illustrates the excellent performance of the innovative radiometer carried by MSG-1.

The MSG system will provide an essential service for weather experts for at least the next 12 years. This continuity of service is important not only to make short-term forecasts, but also to investigate global weather trends in the longer term.

Original Source: ESA News Release

Mars Closest Tomorrow

On Wednesday, August 27 at 0951 GMT (5:51 am EDT) Mars and Earth will be only 56 million kilometres apart; the closest they’ve been in almost 60,000 years. Mars looks best in a telescope, where features like its polar ice cap and dust storms are visible, the planet is easy to spot with the naked eye. Just look to the south in the late evening and you can’t miss it; it currently outshines any other object in the sky other than the Moon. Astronomy clubs and observatories around the world are hosting events to give the public a chance to see the Red Planet – it will remain bright and close for several months.

Columbia Accident Report Released

Image credit: CAIB

The Columbia Accident Investigation Board released its final report today, which was officially accepted by NASA Administrator Sean O’Keefe. The 250-page document contains an overview of the shuttle program in general, as well as STS-107. The report discusses the suspected cause of the Columbia accident – that foam falling from the fuel tank on liftoff smashed a hole in the shuttle’s left wing and allowed hot gas to enter during re-entry – but it also places a lot of emphasis on the weaknesses of NASA’s culture.

WASHINGTON, D.C. – The Columbia Accident Investigation Board today presented its final report on the causes of the Feb. 1, 2003 Space Shuttle accident to the White House, Congress and the National Aeronautics and Space Administration.

The CAIB report concludes that while NASA’s present Space Shuttle is not inherently unsafe, a number of mechanical fixes are required to make the Shuttle safer in the short term. The report also concludes that NASA’s management system is unsafe to manage the shuttle system beyond the short term and that the agency does not have a strong safety culture.

The Board determined that physical and organizational causes played an equal role in the Columbia accident – that the NASA organizational culture had as much to do with the accident as the foam that struck the Orbiter on ascent. The report also notes other significant factors and observations that may help prevent the next accident.

The Board crafted the report to serve as a framework for a national debate about the future of human space flight, but suggests that it is in the nation’s interest to replace the Shuttle as soon as possible as the primary means for transporting humans to and from Earth orbit.

The Board makes 29 recommendations in the 248-page final report, including 15 return-to-flight recommendations that should be implemented before the Shuttle Program returns to flight.

The report, which consists of 11 chapters grouped into three main sections, was the result of a seven-month-long investigation by the CAIB’s 13 board members, more than 120 investigators, 400 NASA and contractor employees, and more than 25,000 searchers who recovered Columbia’s debris.

Over the next several weeks, the Board expects to publish several additional volumes containing technical documents cited in the report or referenced as part of the investigation, as well as transcripts of the board’s public hearings.

The report can be viewed on our website at: www.caib.us

Please watch the NASA website for information about how to obtain hard copies or CDs of the Report.

Original Source: CAIB News Release

NASA Releases a Map of the Whole Earth

Image credit: NASA

NASA has released a new image of the entire Earth based on images taken during the Shuttle Radar Topography Mission. The global data set greatly improves maps of the Earth’s surface between 60-degrees North and South of the equator – 80% of the globe. Previous maps of the United States have a similar resolution as the SRTM30 data – about 1 km – but the rest of the world is often inaccurate. SRTM is capable of producing even higher-resolution maps, down to 30 metres.

A brand new look and understanding of the place we call home. That’s what you’ll get in a complete global topographic data set generated by NASA and the National Imagery and Mapping Agency (NIMA).

Produced by the Shuttle Radar Topography Mission, the global data set, called “SRTM30,” greatly improves maps of Earth’s land mass located between 60 degrees north and 60 degrees south of the equator. That’s roughly from the southern tip of Greenland to below the southern tip of South America.

Until now, the primary source of digital elevation data for scientists and analysts involved in global studies has been the U.S. Geological Survey’s “GTOPO30,” published in 1996, it consists of elevation measurements spaced every 30-arc-seconds. An arc-second is a measure of latitude and longitude used by geographers that corresponds to about 30.9 meters, or 101.4 feet, at the equator. This allows identification of features roughly the size of Disneyland in California. The SRTM30 map matches the GTOPO30 resolution, but with its seamless quality, the map represents a leap in global-scale accuracy.

“SRTM30 is a powerful demonstration of the benefits which accrue from NASA’s human space flight program and satellite radar mapping technology,” said John LaBrecque, manager, Solid Earth and Natural Hazards Program, NASA Headquarters, Washington.

“The quality of previous maps of the Earth varied considerably, because they were compiled from various data gathered by generations of explorers and surveyors. In some places these maps are inaccurate. Using NASA technology, six Space Shuttle astronauts mapped 80 percent of Earth’s land surface in just 10 days to produce the first 3-D map of the Earth’s surface at a known and uniform accuracy,” he said.

The need for accurate topographic maps is everywhere from planning a hike to building a new highway. Knowing the exact shape and location of mountain peaks and river valleys is as important to the safe and efficient flight of aircraft as it is to the management of water resources and the control of forest fires.

Newly released images, representing the new SRTM30 data products, depict Earth in two ways: as an image with all the continents shown (a common map-making method known as a Mercator projection); and as three globe images of Earth as viewed from points in space centered over the Americas, Africa and the western Pacific. Two visualization methods were combined to produce the images: shading and color-coding of topographic height. The shaded image was derived by computing topographic slope in the northwest-southeast direction, so northwest slopes appear bright and southeast slopes appear dark. Color-coding depicts the lowest elevations in green, rising through yellow and tan, to white at the highest elevations.

The SRTM30 map is one of a series of land surface products emerging from the very successful Shuttle Radar Topography Mission (SRTM). SRTM has produced more detailed topographic data for North and South America that resolves features approximately 90 feet square, or 10 times the global SRTM30 database.

The SRTM data were processed at NASA’s Jet Propulsion Laboratory, Pasadena, Calif., into research-quality digital elevation data. NIMA is providing additional processing to develop official mapping products. The U.S. Geological Survey Earth Resources Observation Systems Data Center in Sioux Falls, S.D. provides final archiving and distribution of the SRTM data products.

The SRTM mission is a cooperative project of NASA, NIMA, German and Italian space agencies. The project is part of NASA’s mission to understand and protect our home planet.

The new images are available on the JPL Planetary Photojournal at:

http://photojournal.jpl.nasa.gov/catalog/PIA03394

http://photojournal.jpl.nasa.gov/catalog/PIA03395

http://photojournal.jpl.nasa.gov/catalog/PIA03396
Information about the Shuttle Radar Topography Mission is available at:

http://www.jpl.nasa.gov/srtm/

Original Source: NASA News Release

NASA SIRTF Launches on Board a Delta II Rocket


NASA’s Space Infrared Telescope Facility (SIRTF) successfully launched on board a Delta II rocket from Florida’s Cape Canaveral Air Force Station at 0535 GMT (1:35 am EDT). The Deep Space Network station in Canberra, Australia reported the first data from the observatory 64 minutes after launch. The last of the Great Observatories, SIRTF will use infrared detectors to help expand astronomers’ knowledge of many objects in the sky, including brown dwarfs, planet-forming discs of debris around other stars, and distant galaxies. The observatory will undergo two months of testing followed by another month of science verification; after that, SIRFT will be ready for use.

NASA’s Space Infrared Telescope Facility (SIRTF) successfully launched from Florida’s Cape Canaveral Air Force Station at 1:35:39 a.m. Eastern Daylight Time (10:35:39 p.m. Pacific Daylight Time, August 24) aboard a Delta II launch vehicle.

Flying eastward over the Atlantic Ocean, the new observatory entered an Earth-trailing orbit the first of its kind at about 43 minutes after launch. Five minutes later, the spacecraft separated from the Delta?s second and final stage. At about 2:39 a.m. Eastern Daylight Time (11:39 p.m. Pacific Daylight Time, Aug. 24), about 64 minutes after take-off, the NASA Deep Space Network station in Canberra, Australia received the first data from the spacecraft.

“All systems are operating smoothly, and we couldn?t be more delighted,” said David Gallagher, project manager for the mission at NASA?s Jet Propulsion Laboratory, Pasadena, Calif.

The last of NASA?s suite of Great Observatories, the Space Infrared Telescope Facility will use infrared detectors to pierce the dusty darkness enshrouding many of the universe?s most fascinating objects, including brown dwarfs, planet-forming debris discs around stars and distant galaxies billions of light years away. Past Great Observatories include the Hubble Space Telescope, Chandra X-ray Observatory and Compton Gamma Ray Observatory.

The two-and-one-half to five-year mission is an important bridge to NASA?s Origins Program, which seeks to answer the questions: “Where did we come from? Are we alone?”

In-orbit checkout and calibration is scheduled to last 60 days, followed by a 30-day science verification period, after which the observatory is expected to begin its regular science mission.

For more information about the Space Infrared Telescope Facility, visit their Web site at http://sirtf.caltech.edu/>.

Original Source: NASA News Release

Brazilian Rocket Explodes, at Least 20 Killed

At least 20 people were killed and more injured when a rocket exploded at the Brazilian Alcantara Launch Center. One of the VLS-3 rocket’s engines is believed to have caught on fire, triggering an explosion that caused the launch pad to collapse. The two research satellites atop the rocket were also destroyed. This disaster is just the latest in a series of setbacks which have plagued the Brazilian rocket launch program – two rockets in 1997 and 1999 had to be destroyed shortly after take off.

Columbia Report Will Be Released August 26

Image credit: NASA

The Columbia Accident Investigation Board will hold a press briefing on August 26 and discuss its final 250-page report on the cause of the space shuttle Columbia’s destruction on February 1, 2003. The report will be made available from the CAIB’s website at 1400 GMT (10:00 am EDT) and a live webcast will begin at 1500 GMT (11:00 am EDT). The 13-member board has already concluded that foam dislodged from the shuttle’s fuel tank struck the left wing on takeoff and create a crack that allowed hot gas to enter the wing on re-entry.

ARLINGTON, VA – The Columbia Accident Investigation Board will hold a press briefing to discuss its final report on the cause of the February 1, 2003 Space Shuttle accident on Tuesday, August 26, 2003 at 11 a.m. EDT at the National Transportation Safety Board boardroom at 429 L’Enfant Plaza in Washington, D.C.

Board Chairman retired Admiral Harold W. “Hal” Gehman Jr. and other board members will review the contents of the report and will answer questions from the press. The briefing is open to credentialed media only.

Only one printed copy of the report and a CD containing a .pdf file of the report will be provided to each credentialed news organization. Reporters and photographers who plan to attend the briefing are encouraged to send an email to notify CAIB Public Affairs at [email protected].

The report also will be posted to the CAIB website, www.caib.us, at 10 a.m. that morning. The 11 a.m. press briefing will be webcast from the same website.

The CAIB will provide a pooled, three-camera switched feed of the press briefing, with distribution on site. Still photography will not be pooled.

Questions about parking for satellite trucks should be directed to Terry Williams at the NTSB on Monday, August 25, 2003 at 202-314-6100.

Directions to NTSB Board Room: Front door located on Lower 10th Street, directly below L’Enfant Plaza. From Metro, exit L’Enfant Plaza station at 9th and D Streets escalator, walk through shopping mall, at CVS store take escalator down one level. Board Room will be to your left.

Original Source: CAIB News Release

Maybe There Wasn’t Water on Mars in the Past

Image credit: NASA

Since it arrived at Mars in 1997, the Mars Global Surveyor has been searching the surface of the Red Planet for carbonate minerals. Large quantities of this substance would be evidence that the planet was once warm and wet, with large oceans and seas on the surface. Surveyor has found trace quantities of the mineral spread evenly in the dust of the planet, but no deposits, indicating that the planet was probably always icy and cold.

After a decades-long quest, scientists analyzing data from NASA’s Mars Global Surveyor spacecraft have at last found critical evidence the spacecraft’s infrared spectrometer instrument was built to search for: the presence of water-related carbonate minerals on the surface of Mars.

However, the discovery also potentially contradicts what scientists had hoped to prove: the past existence of large bodies of liquid water on Mars, such as oceans. How this discovery relates to the possibility of ephemeral lakes on Mars is not known at this time.

The thermal emission spectrometer on Global Surveyor found no detectable carbonate signature in surface materials at scales ranging from three to 10 kilometers (two to six miles) during its six-year Mars mapping mission. However, the sensitive instrument has detected the mineral’s ubiquitous presence in martian dust in quantities between two and five percent. Planetary geologists Timothy Glotch Dr. Joshua Bandfield, and Dr. Philip Christensen of Arizona State University, Tempe, analyze the data from dust-covered areas of Mars in a report to be published Aug. 22 in the journal Science.

“We have finally found carbonate, but we’ve only found trace amounts in dust, not in the form of outcroppings as originally suspected. This shows that the thermal emission spectrometer can see carbonates — if they are there ? and that carbonates can exist on the surface today,” said Christensen, principal investigator for the instrument.

“We believe that the trace amounts that we see probably did not come from marine deposits derived from ancient martian oceans, but from the atmosphere interacting directly with dust,” Christensen said. “Tiny amounts of water in Mars’ atmosphere can interact with the ubiquitous dust to form the small amounts of carbonate that we see. This seems to be the result of a thin atmosphere interacting with dust, not oceans interacting with the big, thick atmosphere that many people have thought once existed there.”

“What we don’t see is massive regional concentrations of carbonates, like limestone,” said Bandfield, who spent a year refining the techniques that allowed the group to separate carbonate’s distinctive infrared signature from the spectrometer’s extensive database of infrared spectra, despite the mineral’s low concentrations and the masking effects of the martian atmosphere.

“We’re not seeing the white cliffs of Dover or anything like that,” he said. “We’re not seeing high concentrations, we’re just seeing ubiquitously low levels. Wherever we see the dust, we see the signature that is due to the carbonate.”

Because there are known to be deposits of frozen water on Mars, the findings have important implications for Mars’ past climate history.

“This really points to a cold, frozen, icy Mars that has always been that way, as opposed to a warm, humid, ocean-bearing Mars sometime in the past,” said Christensen. “People have argued that early in Mars history, maybe the climate was warmer and oceans may have formed and produced extensive carbonate rock layers. If that was the case, the rocks formed in those purported oceans should be somewhere.”

Although ancient carbonate rock deposits might have been buried by later layers of dust, Christensen pointed out that the global survey found no strong carbonate signatures anywhere on the planet, despite clear evidence of geological processes that have exposed ancient rocks.

Bandfield said that carbonate deposits in dust could be partially responsible for Mars’ atmosphere growing even colder, to become as cold, thin and dry as it is today.

“If you store just a couple percent of carbonate in the upper crust, you can easily account for several times the Earth’s atmospheric pressure,” Bandfield said. “You can store a lot of carbon dioxide in a little bit of rock. If you form enough carbonates, pretty soon your atmosphere goes away. If that happens, you can no longer have liquid water on the surface because you get to the point where liquid water is not stable.”

“The significance of these dramatic results may have to wait for the discoveries to be made by the Mars Exploration Rovers in 2004 and the Mars Reconnaissance Orbiter in 2006 and beyond,” stated Dr. Jim Garvin, NASA’s lead scientist for Mars exploration. What’s important is that we have found carbon-bearing minerals at Mars, which may be linked to the history of liquid water and hence to our quest to understand whether Mars has ever been an abode for life.”

The Mars Global Surveyor mission is managed for NASA’s Office of Space Science, Washington, D.C. by the Jet Propulsion Laboratory, a division of the California Institute of Technology, Pasadena. Arizona State University built and operates the Thermal Emission Spectrometer on Mars Global Surveyor. Lockheed Martin Space Systems, Denver, developed and operates the spacecraft.

Original Source: NASA/JPL News Release

Satellites Could Provide Early Warning for Forest Fires

Image credit: NASA

New software developed at NASA’s Jet Propulsion Laboratory may give firefighters a new tool for spotting forest fires before they get a chance to really get going. The software will link various NASA Earth science satellites together into a virtual web of sensors. If one satellite spots a blaze, it can instruct the other satellites to take more detailed photographs of the area. Controllers can then report the fire to officials as well as scientists interested in how early forest fires behave. Similar software is being considered for other natural events, like floods.

If a forest catches fire and no one is around to see it, can it call for help? The forest cannot call, but thanks to new technology developed by NASA, firefighters may get the word faster through new, high-tech eyes in the sky.

New software developed by NASA’s Jet Propulsion Laboratory, Pasadena, Calif., helps link NASA’s Earth science satellites together to form a virtual web of sensors with the ability to monitor the globe far better than individual satellites. An imaging instrument flying on one satellite can detect a fire or other hazard, and automatically instruct a different satellite that has the ability to take more detailed pictures to take a closer look. If the images show that a potential hazard does exist, the responding satellite provides data to ground controllers, who then report the fire to forest officials and to an interested science team.

“Essentially, we are adding the response mechanism to the detection process,” said Dr. Steve Chien, JPL principal scientist in artificial intelligence. “This is a first step to enabling users of satellite remote sensing data to specify the kind of data they want, such as forest fires or floods, rather than the traditional request to, say, look at northern Montana.”

One of the core components in this collaborative effort is the Science Goal Monitor system being developed at NASA’s Goddard Space Flight Center, Greenbelt, Md. The system enables scientists to specify what to look for and how to react in descriptive rather than technical terms. Then the system monitors science streams of data to identify occurrences of the key events previously specified by the scientist.

“When an event occurs, the system autonomously coordinates the execution of the scientist’s desired reactions between different observatories or satellites,” said Jeremy Jones, Goddard’s task leader for the monitor system. “This is designed to be adaptable to many different types of phenomena and supports a wide variety of sensor web configurations.”

Using the sensor web method, investigators no longer have to rely on after-the-fact data analysis to determine what happened. The information can be used to rapidly respond to hazardous events such as forest fires.

For example, moderate-resolution imaging instruments that fly on both NASA’s Terra and Aqua spacecraft observe the entire globe every day. The instruments’ data are automatically processed on the ground within hours of acquisition by the Rapid Response System at the Goddard Space Flight Center. If this processing detects a hot spot, scientific criteria can be used to automatically redirect the Earth Observing 1 satellite to provide high-resolution images. When that information comes back to a scientist for interpretation, it is made available to forest officials to determine the appropriate response. All this can happen in 24 to 48 hours, compared to a typical lead time of 14 days for preplanned observations.

The satellite sensor web demonstration is a collaborative effort between JPL and the Goddard Space Flight Center. The Rapid Response project is a joint Goddard Space Flight Center effort with the University of Maryland, College Park, led by Dr. Chris Justice.

Original Source: NASA/JPL News Release