Book Review: Entanglement

Entanglement is the unusual behavior of elementary particles where they become linked so that when something happens to one, something happens to the other; no matter what the distance. Two entangled particles could be separated by the entire distance of the Universe and yet they can still communicate instantly with each other. Confused? Well, you’re in good company – this stuff is hard, and weird, and it defies common sense. In his latest book, “Entanglement”, Amir D. Aczel hopes to shed some light on this puzzling behavior.

With Entanglement, Aczel covers a pretty tough topic – the bizarre behavior of particles that become inextricably linked together; what Einstein called “spooky action at a distance.” In order to set the groundwork, the book begins with a series of one-chapter biographies, covering each of the major players in the research to uncover the nature of quantum entanglement, from Thomas Young (1773 – 1829) to physicists who only did their experiments in the last couple of years.

The book then moves into a detailed description of the major experiments that physicists have done to push the field of quantum theory forward. Some of these experiments will blow your mind when you consider the amazing stuff that’s going on in the world of the very small. Each time we encounter the concepts of entanglement, Aczel tries to present them differently hoping something will eventually stick in the reader’s mind.

The test of a good science writer is the ability of walk the line when including difficult concepts, and it’s here that Aczel really excels – he can explain complex scientific and mathematic concepts without baffling you; but also without dumbing it down too much. My eyes glazed over some of the formulae, but most of the time I could follow the points that Aczel was trying to get across.

I’ve got a special place in my heart for quantum theory; I really feel that it encapsulates what’s great about science. Here’s a field of study that defies common sense at every turn. Every advancement was made through experimentation, studying the results, and then working out the math to help describe what’s going on. The human mind can’t really conceive of what’s going on, and yet the science keeps uncovering more and more details about how the universe seems to work on the smallest scale. I wish other disciplines could leave their preconceived notions at the door like the quantum scientists. Nature seems to give up her secrets more willingly when we don’t try to force them one way or the other. (That’s a quantum pun there… )

I’ll warn you in advance, I’ve got some university math under my belt and I’ve read my share of quantum theory books, so the concepts were a little more accessible to me. This isn’t an introduction to quantum theory, but it’s not overly complex either; a nice compromise in my opinion. If this kind of thing interests you, then I recommend you give “Entanglement” a read – you won’t be disappointed.

Here’s more information from Amazon.comAmazon.co.uk

Sloan Builds 3D Map of the Universe

Image credit: SDSS

Astronomers from the Sloan Digital Sky Survey have gathered data to build a precise 3-dimensional map that details the clusters of galaxies and dark matter. The map includes images of 200,000 galaxies up to 2 billion light-years away, accounting for six percent of the sky. The SDSS team – 200 astronomers in 13 countries – measured the Universe to contain 70% dark energy (a mysterious force that repels galaxies apart), 25% dark matter, and 5% normal matter.

Astronomers from the Sloan Digital Sky Survey (SDSS) have made the most precise measurement to date of the cosmic clustering of galaxies and dark matter, refining our understanding of the structure and evolution of the Universe.

“From the outset of the project in the late 80’s, one of our key goals has been a precision measurement of how galaxies cluster under the influence of gravity”, explained Richard Kron, SDSS’s director and a professor at The University of Chicago.

SDSS Project spokesperson Michael Strauss from Princeton University and one of the lead authors on the new study elaborated that: “This clustering pattern encodes information about both invisible matter pulling on the galaxies and about the seed fluctuations that emerged from the Big Bang.”

The findings are described in two papers submitted to the Astrophysical Journal and to the Physical review D; they can be found on the physics preprint Web site, www.arXiv.org, on October 28.

MAPPING FLUCTUATIONS
The leading cosmological model invokes a rapid expansion of space known as inflation that stretched microscopic quantum fluctuations in the fiery aftermath of the Big Bang to enormous scales. After inflation ended, gravity caused these seed fluctuations to grow into the galaxies and the galaxy clustering patterns observed in the SDSS.

Images of these seed fluctuations were released from the Wilkinson Microwave Anisotropy Probe (WMAP) in February, which measured the fluctuations in the relic radiation from the early Universe.

“We have made the best three-dimensional map of the Universe to date, mapping over 200,000 galaxies up to two billion light years away over six percent of the sky”, said another lead author of the study, Michael Blanton from New York University. The gravitational clustering patterns in this map reveal the makeup of the Universe from its gravitational effects and, by combining their measurements with that from WMAP, the SDSS team measured the cosmic matter to consist of 70 percent dark energy, 25 percent dark matter and five percent ordinary matter.

The SDSS is two separate surveys in one: galaxies are identified in 2D images (right), then have their distance determined from their spectrum to create a 2 billion lightyears deep 3D map (left) where each galaxy is shown as a single point, the color representing the luminosity – this shows only those 66,976 our of 205,443 galaxies in the map that lie near the plane of Earth’s equator. (Click for high resolution jpg, version without lines.)
They found that neutrinos couldn’t be a major constituent of the dark matter, putting among the strongest constraints to date on their mass. Finally, the SDSS research found that the data are consistent with the detailed predictions of the inflation model.

COSMIC CONFIRMATION
These numbers provide a powerful confirmation of those reported by the WMAP team. The inclusion of the new SDSS findings helps to improve measurement accuracy, more than halving the uncertainties from WMAP on the cosmic matter density and on the Hubble parameter (the cosmic expansion rate). Moreover, the new measurements agree well with the previous state-of-the-art results that combined WMAP with the Anglo-Australian 2dF galaxy redshift survey.

“Different galaxies, different instruments, different people and different analysis – but the results agree”, says Max Tegmark from the University of Pennsylvania, first author on the two papers. “Extraordinary claims require extraordinary evidence”, Tegmark says, “but we now have extraordinary evidence for dark matter and dark energy and have to take them seriously no matter how disturbing they seem.”
The new SDSS results (black dots) are the most accurate measurements to date of how the density of the Universe fluctuates from place to place on scales of millions of lightyears. These and other cosmological measurements agree with the theoretical prediction (blue curve) for a Universe composed of 5% atoms, 25% dark matter and 70% dark energy. The larger the scales we average over, the more uniform the Universe appears. (Click for high resolution jpg, no frills version.)

“The real challenge is now to figure what these mysterious substances actually are”, said another author, David Weinberg from Ohio State University.

SDSS LARGE-SCALE UNDERTAKING
The SDSS is the most ambitious astronomical survey ever undertaken, with more than 200 astronomers at 13 institutions around the world.

“The SDSS is really two surveys in one”, explained Project Scientist James Gunn of Princeton University. On the most pristine nights, the SDSS uses a wide-field CCD camera (built by Gunn and his team at Princeton University and Maki Sekiguchi of the Japan Participation Group) to take pictures of the night sky in five broad wavebands with the goal of determining the position and absolute brightness of more than 100 million celestial objects in one-quarter of the entire sky. When completed, the camera was the largest ever built for astronomical purposes, gathering data at the rate of 37 gigabytes per hour.

On nights with moonshine or mild cloud cover, the imaging camera is replaced with a pair of spectrographs (built by Alan Uomoto and his team at The Johns Hopkins University). They use optical fibers to obtain spectra (and thus redshifts) of 608 objects at a time. Unlike traditional telescopes in which nights are parceled out among many astronomers carrying out a range of scientific programs, the special-purpose 2.5m SDSS telescope at Apache Point Observatory in New Mexico is devoted solely to this survey, to operate every clear night for five years.

The first public data release from the SDSS, called DR1, contained about 15 million galaxies, with redshift distance measurements for more than 100,000 of them. All measurements used in the findings reported here would be part of the second data release, DR2, which will be made available to the astronomical community in early 2004.

Strauss said the SDSS is approaching the halfway point in its goal of measuring one million galaxy and quasar redshifts.

“The real excitement here is that disparate lines of evidence from the cosmic microwave background (CMB), large-scale structure and other cosmological observations are all giving us a consistent picture of a Universe dominated by dark energy and dark matter”, said Kevork Abazajian of the Fermi National Accelerator Laboratory and the Los Alamos National Laboratory.

Original Source: Sloan Digital Sky Survey News Release

Additional Columbia Documents Coming

Image credit: CAIB

The Columbia Accident Investigation Board announced on Friday that they will be releasing volumes II through VI of their analysis and recommendations. The documents can be downloaded will be available for download on Tuesday, and printed copies can be ordered through an official government printer. The new volumes contain appendices and supporting documentation for Volume I, which was released back in August, and is still considered their formal recommendations on the accident.

The Columbia Accident Investigation Board will release Vols. II-VI of the CAIB’s Final Report at 10 a.m. on Tuesday, Oct. 28, 2003 on its website, www.caib.us. All of the volumes can be downloaded from the website. These volumes contain appendices that provide the supporting documentation for the main text of the Final Report contained in Vol. I, which was released on Aug. 26, 2003.

These appendix materials were working documents. They contain a number of conclusions and proposed recommendations, several of which were adopted by the CAIB in Vol. I. The other conclusions and proposed recommendations drawn in Vols. II-VI do not necessarily reflect the views of the CAIB but are included for the record. When there is conflict, Vol. I takes precedence. It alone is the CAIB’s official statement.

Hard copies of Vols. I-VI are available through the Government Printing Office for a fee. Those copies can be ordered from the GPO’s website, www.gpo.gov.

There will be no press briefing about the release of Vols. II-VI.

Original Source: CAIB News Release

Contact Lost with Japanese Satellite

Image credit: JAXA

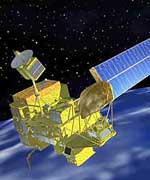
Ground controllers have lost contact with Midori 2, a $587 million environmental research satellite launched in December last year. The Japanese/US spacecraft didn’t check in on Saturday when it flew over a ground station; shortly after that it went into safe mode, and then all telemetry was lost. Controllers are trying to recover contact with the satellite, but it will probably be difficult because it’s not even sending out telemetry data. Midori 2 was supposed to last at least 3 years and use five scientific instruments to gather data about water vapour, ocean winds, sea temperatures, sea ice, and marine vegetation.

The Japan Aerospace Exploration Agency (JAXA) failed to receive earth observation data from its Advanced Earth Observing Satellite II, Midori-II, at its Earth Observation Center in Saitama Prefecture at 7:28 a.m. on October 25, 2003 (Japan Standard Time, JST). At 8:49 a.m. (JST), JAXA checked the operational status of Midori-II, and found it was switched to a light load mode (in which all observation equipment is automatically turned off to minimize power consumption) due to an unknown anomaly. Around 8:55 a.m. (JST), communications between the satellite and ground stations became unstable, and telemetry data was not received.

JAXA’s Katsuura Tracking and Communication Station also failed to receive telemetry data twice (9:23 and 11:05 a.m. JST.)
JAXA is currently analyzing earlier acquired telemetry data. The analysis of power generation data by the solar array paddle revealed that generated power has decreased from 6kW to 1kW.
We are doing our utmost to have Midori-II return to normal operation mode by continuing to analyze telemetry data and by working to understand the current condition of the satellite at our domestic and overseas tracking stations.

JAXA formed the ?Midori-II anomaly investigation team,? led by the president of JAXA, to lead the investigation.

Original Source: JAXA News Release

See the Sunspots for Yourself

As you might know, there are currently two huge groups of sunspots on the surface of the Sun. They’re really easy to see if you have a pair of binoculars or a telescope. Don’t look at the sun directly, you can damage your eyes, but there’s an easy way you can project an image of the Sun so you can see the spots. All you need is a piece of paper.

You line up the binoculars so that light from the Sun is passing through the eyepiece and onto a piece of paper you’re holding. Move the binoculars around a big and you’ll eventually see a big bright circle moving around your paper. That’s the Sun. Then, focus the eyepiece of the binoculars so that the circle of light has a nice crisp edge. You should be able to see the sunspots right away. NASA has some great instructions on how to do this.

Let me know how it goes!

Fraser Cain
Publisher
Universe Today

P.S. Hotmail users are going to be experiencing some delays for the next while. There’s a problem with the way Hotmail tries to limit SPAM that’s clogging up all the mail they’re receiving. My newsletters are sometimes taking days before they’re getting accepted.

New Shuttle Solid Rocket Booster Tested

Image credit: Blake Goddard

Alliant Techsystems performed the first static test of a new five-segment solid rocket booster for the space shuttle. This new booster gives approximately 10% more thrust than the four-segment boosters that the shuttle currently flies with. If these new boosters are installed on the shuttle it would have a few benefits: the shuttle would have enough thrust to still reach orbit if its main engine fails, it won’t have to make an emergency landing; or it could be used to let the shuttle carry an additional 10,500 kg of cargo.

ATK (Alliant Techsystems, NYSE: ATK) yesterday successfully conducted the first static test firing of a five-segment Space Shuttle reusable solid rocket motor (RSRM).

The test conducted by ATK Thiokol Propulsion, Promontory, Utah, was part of an ongoing safety program to verify materials and manufacturing processes, by ground testing motors with specific test objectives. This five-segment motor, also considered a margin test motor, pushed various features of the motor to its limits so engineers could validate the safety margins of the four-segment motor currently used to launch Space Shuttles. The static firing was also a test designed to demonstrate the ability of the five-segment motor to perform at thrust levels in excess of 3.6 million pounds, approximately 10 percent greater than the four-segment motor.

?This test demonstrated ATK?s unique ability and expertise in the design and production of the RSRM,? said Jeff Foote, group vice president, Aerospace. ?It is yet another visible commitment by NASA and ATK to ensure the highest quality safety standards and mission success for future Space Shuttle flights.?

Foote said that in addition to validating safety margins by over-testing many RSRM attributes, the static firing also demonstrated the capability of the five-segment motor to increase Space Shuttle payload capacity by 23,000 pounds, or enable a safe abort to orbit in the event of loss of thrust from the main engines.

The five-segment motor generated an average thrust of 3.1 million pounds and burned for approximately 128 seconds. The current four-segment configuration generates an average 2.6 million pounds of thrust and burns for approximately 123 seconds. The new motor measures 12 feet in diameter and is 153.5 feet long ? 27.5 feet longer than the four-segment motor.

The static test allowed ATK to verify and validate numerous performance characteristics, processes, materials, components, and design changes that were incorporated into the five-segment RSRM. The test had 67 objectives and employed 633 instrumentation channels to collect data for evaluation. Preliminary results indicate that the motor met or exceeded all objectives.

The Space Shuttle RSRM is the largest solid rocket motor ever flown and the first designed for reuse. The reusability of the RSRM case and nozzle hardware is an important cost-saving factor for the nation’s space program. Each Space Shuttle launch currently requires the boost of two RSRMs. By the time the twin RSRMs have completed their task, the Space Shuttle orbiter has reached an altitude of 24 nautical miles and is traveling at a speed in excess of 3,000 miles per hour.

ATK Thiokol Propulsion is the world?s leading supplier of solid-propellant rocket motors. Products manufactured by the company include propulsion systems for the Delta, Pegasus?, Taurus?, Athena, Atlas, H-IIA, and Titan IV B expendable space launch vehicles, NASA?s Space Shuttle, the Trident II Fleet Ballistic Missile and the Minuteman III Intercontinental Ballistic Missile, and ground-based missile defense interceptors.

ATK is a $2.2 billion aerospace and defense company with strong positions in propulsion, composite structures, munitions, precision capabilities, and civil and sporting ammunition. The company, which is headquartered in Edina, Minn., employs approximately 12,200 people and has three business groups: Precision Systems, Aerospace, and Ammunition and Related Products. ATK news and information can be found on the Internet at www.atk.com.

Original Source: Alliant News Release

Shrinking Arctic Sea Ice is Accelerating

Image credit: NASA

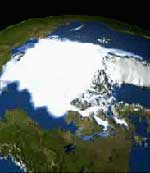
New images of shrinking sea ice may provide further evidence that the Earth is undergoing significant climate change. NASA scientists compared images of arctic sea ice since 1981 and have measured that it’s shrinking by an average of 9% per decade – summer sea ice in 2002 was a record low levels. The loss of ice could accelerate global warming because liquid water absorbs sunlight instead of reflecting it like ice.

Recently observed change in Arctic temperatures and sea ice cover may be a harbinger of global climate changes to come, according to a recent NASA study. Satellite data — the unique view from space — are allowing researchers to more clearly see Arctic changes and develop an improved understanding of the possible effect on climate worldwide.

The Arctic warming study, appearing in the November 1 issue of the American Meteorological Society’s Journal of Climate, shows that compared to the 1980s, most of the Arctic warmed significantly over the last decade, with the biggest temperature increases occurring over North America.

“The new study is unique in that, previously, similar studies made use of data from very few points scattered in various parts of the Arctic region,” said the study’s author, Dr. Josefino C. Comiso, senior research scientist at NASA’s Goddard Space Flight Center, Greenbelt, Md. “These results show the large spatial variability in the trends that only satellite data can provide.” Comiso used surface temperatures taken from satellites between 1981 and 2001 in his study.

The result has direct connections to NASA-funded studies conducted last year that found perennial, or year-round, sea ice in the Arctic is declining at a rate of nine percent per decade and that in 2002 summer sea ice was at record low levels. Early results indicate this persisted in 2003.

Researchers have suspected loss of Arctic sea ice may be caused by changing atmospheric pressure patterns over the Arctic that move sea ice around, and by warming Arctic temperatures that result from greenhouse gas buildup in the atmosphere.

Warming trends like those found in these studies could greatly affect ocean processes, which, in turn, impact Arctic and global climate, said Michael Steele, senior oceanographer at the University of Washington, Seattle. Liquid water absorbs the Sun’s energy rather than reflecting it into the atmosphere the way ice does. As the oceans warm and ice thins, more solar energy is absorbed by the water, creating positive feedbacks that lead to further melting. Such dynamics can change the temperature of ocean layers, impact ocean circulation and salinity, change marine habitats, and widen shipping lanes, Steele said.

In related NASA-funded research that observes perennial sea-ice trends, Mark C. Serreze, a scientist at the University of Colorado, Boulder, found that in 2002 the extent of Arctic summer sea ice reached the lowest level in the satellite record, suggesting this is part of a trend. “It appears that the summer 2003 — if it does not set a new record — will be very close to the levels of last year,” Serreze said. “In other words, we have not seen a recovery; we really see we are reinforcing that general downward trend.” A paper on this topic is forthcoming.

According to Comiso’s study, when compared to longer term ground-based surface temperature data, the rate of warming in the Arctic over the last 20 years is eight times the rate of warming over the last 100 years.

Comiso’s study also finds temperature trends vary by region and season. While warming is prevalent over most of the Arctic, some areas, such as Greenland, appear to be cooling. Springtimes arrived earlier and were warmer, and warmer autumns lasted longer, the study found. Most importantly, temperatures increased on average by 1.22 degrees Celsius per decade over sea ice during Arctic summer. The summer warming and lengthened melt season appears to be affecting the volume and extent of permanent sea ice. Annual trends, which were not quite as strong, ranged from a warming of 1.06 degrees Celsius over North America to a cooling of .09 degrees Celsius in Greenland.

If the high latitudes warm, and sea ice extent declines, thawing Arctic soils may release significant amounts of carbon dioxide and methane now trapped in permafrost, and slightly warmer ocean water could release frozen natural gases in the sea floor, all of which act as greenhouse gases in the atmosphere, said David Rind, a senior researcher at NASA’s Goddard Institute of Space Studies, New York. “These feedbacks are complex and we are working to understand them,” he added.

The surface temperature records covering from 1981 to 2001 were obtained through thermal infrared data from National Oceanic and Atmospheric Administration satellites. The studies were funded by NASA’s Earth Science Enterprise, which is dedicated to understanding the Earth as an integrated system and applying Earth System Science to improve prediction of climate, weather and natural hazards using the unique vantage point of space.

Original Source: NASA News Release

Big Solar Storm Headed our Way

Image credit: SOHO

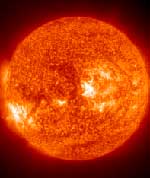
A gigantic group of sunspots, 10 times larger than the Earth, have been active on the surface of the Sun for the past few days. Solar astronomers have spotted several Coronal Mass Ejections (CMEs) blasting out of the sunspots, and one of them seems to be coming our way. Once it reaches the Earth, it will interact with the planet’s geomagnetic field, and potentially disrupt communications satellites. Beautiful auroras (Northern Lights) will probably be visible, even from middle latitudes. The solar material is expected to sweep past the Earth Friday or Saturday.

Forecasters at the NOAA Space Environment Center in Boulder, Colo., observed two dynamic areas of the sun, one of which has produced a coronal mass ejection, or CME, Wednesday morning at 3 a.m. EDT that appears to be Earth-directed. The forecasters are predicting a strong geomagnetic storm, G-3 on the NOAA Space Weather Scales, that should reach Earth on Friday, October 24. (Click here to view larger image from the SOHO spacecraft of the intense solar activity on the sun taken Oct. 21, 2003. Click here to view high resolution version, which is a large file. Click here to view latest images. Please credit ?SOHO.?)

NOAA Region 484 developed rapidly over the past three days and is now one of the largest sunspot clusters to emerge during Solar Cycle 23. It is about 10 times larger than the Earth. This region, which is nearing the center of the sun, already produced a major flare, R-3 on the NOAA Space Weather Scales, producing a radio blackout on October 19 at 12:50 p.m EDT. The region continues to grow, and additional substantial flare activity is likely.

Larry Combs, a forecaster with the NOAA Space Environment Center?s Space Weather Operations, said that this region has developed rapidly over the last three to four days. ?It?s somewhat unusual to have this much activity when we?re approximately three-and-a-half years past solar maximum,? he said. ?In fact, just last week, solar activity was very low with an almost spotless sun.? Solar cycles of high and low activity repeat about every eleven years, and the sun has been moving towards solar minimum for the past three years.

A second intense active region is rotating on the southeast quadrant of the sun. Although the sunspot group is not yet visible, two powerful eruptions occurred on October 21 as seen from the LASCO instrument on the SOHO spacecraft. These eruptions may herald the arrival of another volatile active center with the potential to impact various Earth systems.

Further major eruptions are possible from these active regions as they rotate across the face of the sun over the next two weeks. Satellite and other spacecraft operations, power systems, high frequency communications, and navigation systems may experience disruptions over this two-week period.

NOAA is dedicated to enhancing economic security and national safety through the prediction and research of weather and climate-related events and providing environmental stewardship of the nation?s coastal and marine resources. NOAA is part of the U.S. Department of Commerce.

Original Source: NOAA News Release

Cosmic Ray Detector Completed

Image credit: Fermilab

The 100th detector for the Pierre Auger Observatory was recently completed, making the array the world’s largest cosmic ray detector. It consists of surface detectors spread out over 181 square kilometers of land in Argentina. Once it’s working, the detector should be able to capture some of the most energetic cosmic ray particles – they only strike a 2.5 square kilometer area once a year. The mystery with these high-energy particles is that astronomers have no idea what in the Universe could create them. The long term plans for the observatory is to eventually have 1,600 detectors by 2005.

With the completion of its hundredth surface detector, the Pierre Auger Observatory, under construction in Argentina, this week became the largest cosmic-ray air shower array in the world. Managed by scientists at the Department of Energy’s Fermi National Accelerator Laboratory, the Pierre Auger project so far encompasses a 70-square-mile array of detectors that are tracking the most violent-and perhaps most puzzling- processes in the entire universe.

Cosmic rays are extraterrestrial particles-usually protons or heavier ions-that hit the Earth’s atmosphere and create cascades of secondary particles. While cosmic rays approach the earth at a range of energies, scientists long believed that their energy could not exceed 1020 electron volts, some 100 million times the proton energy achievable in Fermilab’s Tevatron, the most powerful particle accelerator in the world. But recent experiments in Japan and Utah have detected a few such ultrahigh energy cosmic rays, raising questions about what extraordinary events in the universe could have produced them.

“How does nature create the conditions to accelerate a tiny particle to such an energy?” asked Alan Watson, physics professor at the University of Leeds, UK, and spokesperson for the Pierre Auger collaboration of 250 scientists from 14 countries. “Tracking these ultrahigh-energy particles back to their sources will answer that question.”

Scientific theory can account for the sources of low- and medium-energy cosmic rays, but the origin of these rare high-energy cosmic rays remains a mystery. To identify the cosmic mechanisms that produce microscopic particles at macroscopic energy, the Pierre Auger collaboration is installing an array that will ultimately comprise 1,600 surface detectors in an area of the Argentine Pampa Amarilla the size of Rhode Island, near the town of Malarg?e, about 600 miles west of Buenos Aires. The first 100 detectors are already surveying the southern sky.

“These highest-energy cosmic rays are messengers from the extreme universe,” said Nobel Prize winner Jim Cronin, of the University of Chicago, who conceived the Auger experiment together with Watson. “They represent a great opportunity for discoveries.”

The highest-energy cosmic rays are extremely rare, hitting the Earth’s atmosphere about once per year per square mile. When complete in 2005, the Pierre Auger observatory will cover approximately 1,200 square miles (3,000 square kilometers), allowing scientists to catch many of these events.

“Our experiment will pick up where the AGASA experiment has left off,” said project manager Paul Mantsch, Fermilab, referring to the Akeno Giant Air Shower Array (AGASA) experiment in Japan. “At highest energies, the astonishing results from the two largest cosmic-ray experiments appear to be in conflict. AGASA sees more events than the HiRes experiment in Utah, but the statistics of both experiments are limited.”

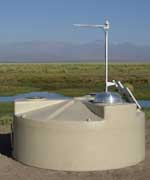
The Pierre Auger project, named after the pioneering French physicist who first observed extended air showers in 1938, combines the detection methods used in the Japanese and Utah experiments. Surface detectors are spaced one mile apart. Each surface unit consists of a 4-foot-high cylindrical tank filled with 3,000 gallons of pure water, a solar panel, and an antenna for wireless transmission of data. Sensors register the invisible particle avalanches, triggered at an altitude of six to twelve miles just microseconds earlier, as they reach the ground. The particle showers strike several tanks almost simultaneously.

In addition to the tanks, the new observatory will feature 24 HiRes-type fluorescence telescopes that can pick up the faint ultraviolet glow emitted by air showers in mid-air. The fluorescence telescopes, which can only be operated during dark, moonless nights, are sensitive enough to pick up the light emitted by a 4-watt lamp traveling six miles away at almost the speed of light.

“It is a really beautiful thing that we have a hybrid system,” said Watson. “We can look at air showers in two modes. We can measure their energy in two independent ways.”

The Pierre Auger collaboration is in the process of preparing a proposal for a second site of its observatory, to be located in the United States. Featuring the same design as the Argentinean site, the second detector array would scan the northern sky for the sources of the most powerful cosmic rays.

Funding for the $55 million Pierre Auger Observatory in Argentina has come from 14 member nations. The U.S. contributes 20 percent of the total cost, with support provided by the Office of Science of the Department of Energy and by the National Science Foundation. A list of all participating institutions is available at http://auger.cnrs.fr/collaboration.html

Fermilab is a national laboratory funded by the Office of Science of the U.S. Department of Energy, operated by Universities Research Association, Inc.

Original Source: Fermilab News Release

Crew Launched Despite Station Concerns

NASA’s latest launch to the International Space Station wasn’t without controversy. The Washington Post is reporting that two officials responsible for health and environmental conditions on the station refused to approve the launch of the new crew. Instead they warned that critical components on the station had degraded and could risk the health and safety of the astronaut crew. NASA says it’s aware of the problem, but doesn’t consider it to be an immediate threat. Without the space shuttle to repair and upgrade the station, they could be forced to abandon it within six months.