Grace Readied for Launch

Image credit: NASA

NASA and the German Space Agency are getting ready to launch the Gravity Recovery and Climate Experiment (Grace) on March 16th on board a Russian rocket. This mission will consist of two satellites orbiting the Earth 16 times a day. As they travel over the oceans, minute variations in gravity will pull at the two satellites differently, allowing them to produce a detailed gravity map of the planet. Scientists hope to use this data to understand the effects of global climate change.

NASA and the German Space Agency are preparing to launch the Gravity Recovery and Climate Experiment (Grace), a scientific pathfinder mission that will test a novel approach to tracking how water is transported and stored within the Earth’s environment.

The mission, managed by NASA’s Jet Propulsion Laboratory, Pasadena, Calif., will precisely measure the planet’s shifting water masses and map their effects on Earth’s gravity field, yielding new information on effects of global climate change.

The twin Grace satellites are set to launch March 16, 2002, from Russia on a five-year mission that will revolutionize understanding of changes in the Earth’s gravity field over time and space. The mission will provide measurements of the gravity field that are far more accurate and sensitive than any that can be obtained by ground-based observations or single remote-sensing spacecraft.

“Grace marks the first launch of NASA’s Earth System Science Pathfinder program, designed to develop new measurement technologies for studying our Earth system,” said Dr. Ghassem Asrar, associate administrator for NASA’s Earth Science Enterprise, NASA Headquarters, Washington, D.C. “Through NASA’s continuing investment in technology development, we’ve been able to create an innovative mission at a fraction of the cost of missions formulated just a decade ago. Grace will provide us with a new view of our home planet and help us to better understand climate change and its global impacts such as changes in sea level and the availability of water resources,” Asrar said.

A more precise gravity map of Earth is expected to increase the accuracy of many techniques used by scientists who study Earth with space-based instruments. These techniques — ranging from satellite altimetry and radar interferometry to digital terrain models covering large land and ice areas — provide critical input to many scientific models used in oceanography, hydrology, glaciology, geology and related disciplines.

As they race around the globe 16 times a day, the satellites will sense minute variations in the Earth’s surface mass below and corresponding variations in the Earth’s gravitational pull. Regions of slightly stronger gravity will affect the lead satellite first, pulling it slightly away from the trailing satellite. By measuring the constantly changing distance between the two satellites and combining that data with precise positioning measurements from Global Positioning System instruments, scientists will be able to construct a precise Earth gravity map.

Grace is the first Earth-monitoring mission in the history of space flight whose key measurement is not derived from electromagnetic waves bounced off the Earth’s surface. Instead, the mission will use a microwave ranging system to accurately measure changes in the speed and distance between two identical spacecraft flying in a polar orbit about 220 kilometers (137 miles) apart, 500 kilometers (311 miles) above Earth. The ranging system is so sensitive it can detect separation changes as small as 10 microns — about one-tenth the width of a human hair over a distance of 220 kilometers.

An additional instrument aboard the satellites called an atmospheric limb sounder will measure the amount by which the Global Positioning System satellite signals are distorted by Earth’s atmosphere. Scientists will use these data to improve the accuracy of key atmospheric observations, which serve as input for weather forecast models.

Grace is a joint partnership between NASA and the German Center for Air and Space Flight (Deutsches Zentrum fur Luft und Rumfahrt). The U.S. portion of the project is managed for NASA’s Office of Earth Science, Washington D.C., by JPL. Science data processing, distribution, archiving and product verification are managed under a cooperative arrangement between JPL and the University of Texas’ Austin-based Center for Space Research in the United States and Germany’s Earth Research Center (or GeoForschungsZentrum).

Original Source: NASA/JPL News Release

Hubble Gets a New Camera

Image credit: NASA

During a seven and a half hour spacewalk today, astronauts James Newman and Michael Massimino installed the Advanced Camera for Surveys onto the Hubble Space Telescope – a camera system ten times more powerful than what Hubble had previously. This is the fourth of five spacewalks carried out by the Columbia crew, who are due to return back to Earth on March 12th. The next spacewalk is due for Friday.
Following today?s successful installation of the new Advanced Camera for Surveys (ACS) on the Hubble Space Telescope, scientists will be able to see farther into our universe and with greater clarity and speed than ever before.

Columbia?s spacewalkers, Jim Newman and Mike Massimino, began the first science instrument upgrade of this servicing mission at 3 a.m. central time. The duo, with Newman on the shuttle?s robotic arm, began by removing the last of Hubble?s original science instruments, the Faint Object Camera to make room for the ACS. Newman and Massimino first opened Hubble?s aft shroud doors, removing the Faint Object Camera and temporarily stowing it at the edge of Columbia?s payload bay. After installing the ACS in the Hubble, Newman and Massimino stowed the old camera in the payload bay for its return to Earth.

Then Massimino, on the shuttle?s robotic arm, installed the Electronic Support Module in the aft shroud, with Newman?s assistance. That module will support a new experimental cooling system to be installed during tomorrow?s fifth and final scheduled spacewalk of the mission. That cooling system is designed to bring the telescope’s Near-Infrared Camera and Multi-Object Spectrometer (NICMOS) back to life.

Finally, Newman and Massimino completed some remaining cleanup tasks from yesterday?s Power Control Unit installation.

During the first half of the spacewalk, mission specialist Nancy Currie operated the shuttle?s robotic arm, providing transportation to and from the various worksites on both the Hubble and in Columbia?s payload bay ? Commander Scott Altman then took over operation of the arm to maneuver Massimino through his tasks.

Fellow spacewalkers John Grunsfeld and Rick Linnehan worked from inside the shuttle to choreograph the spacewalk, as Altman and Pilot Duane Carey continued to provide photo and video documentation of the work.

Initial functional tests on the ACS and the electronics module conducted by the Space Telescope Operations Control Center in Greenbelt, Md. were both good. Functional tests of the telescope’s scientific instruments will not be completed, however, until after the telescope is released from Columbia and its aperture door is opened.

The crew is to begin its sleep period at 2:52 p.m. CST. The next STS-109 mission status report will be issued Thursday evening following crew wake-up, or as events warrant.

Original Source: NASA News Release

Oops, the Universe is Beige

Image credit: JHU

Astronomers from John Hopkins University announced several weeks back that if you averaged out the colour of all stars in the universe, the result would be an aquamarine colour. Well, it turns out they had a bug in their software that mixed the colours together incorrectly. Once they squished the bug, and reran their calculations, the average colour of the entire universe became beige.

What is the color of the Universe? This seemingly simple question has never really been answered by astronomers. It is difficult to take an accurate and complete census of all the light in the Universe.

However using the 2dF Galaxy Redshift Survey – a new survey of more than 200,000 galaxies which measures the light from a large volume of the Universe – we have recently been able to try and answer this question. We have constructed what we call “The Cosmic Spectrum”, which represents all the sum of all the energy in the local volume of the universe emitted at different optical wavelengths of light. This is what the cosmic spectrum looks like:

This is a graph of the energy emitted in the Universe for different wavelengths of light (data here). Ultraviolet and blue light is on the left and red light is on the right. This is constructed by adding together all the individual spectra of the separate galaxies in the 2dF survey. The sum represents the light of all the stars. We believe that because the 2dF survey is so large (reaching out several billion light years) that this spectrum is truly representative. We can also show the cosmic spectrum this way:

Here we have put in the approximate color the eye would see at each wavelength of light (though we cannot really see much light below about 4000 Angstroms, the near ultraviolet; and strictly, monitors cannot accurately display monochromatic colors, the colors of the rainbow).

You can think of this as what the eye would see if we put all the light in the Universe through a prism to produce a rainbow. The intensity of the color is in proportion to it’s intensity in the Universe.

So what is the average color? i.e. the color an observer would see if they had the Universe in a box, and could see all the light at once (and it wasn’t moving, for a real observer on earth, the further away a galaxy from us the more it is redshifted. We have de-redshifted all our light before combining).

To answer this question we must compute the average response of the human eye to these colors. How do we express this color? The most objective way to is quote the CIE x,y values which specify the color’s location in the CIE chromaticity diagram and hence the stimulus the eye would see. Any spectrum with the same x,y must give the same perceived color. These numbers are (0.345,0.345) and they are robust, we have calculated them for different sub-samples of the 2dF survey and they vary insignificantly. We have even computed them for the Sloan Digital Sky Survey spectroscopic survey (which will overtake 2dFGRS as the biggest redshift survey sometime in 2002) and they are essentially the same.

But what is the actual color? Well to do this we have to make some assumptions about human vision and the degree of general illumination. We also need to know what monitor you, the reader, are using! Of course this is impossible, but we can make an average guess. So here are the colors:

What are all these colors? They represent the color of the universe for different white points, which represent the adaptation of the human eye to different kinds of illumination. We will perceive different colors under different circumstances, and the kind of spectrum that appears ‘white’ will vary. A common standard is ‘D65’, which is close to setting daylight (in a slightly overcast sky) as white, and compared to which the universe appears reddish. ‘Illuminant E’ (equal energy white point) is perhaps what you would see for white when dark adapted. ‘Illuminant A’ represents indoor lighting, compared to which the Universe (and daylight) is very blue. We also show the color with and without a gamma correction of 2.2, which is the best thing to do for display on typical monitors. We provide the linear file, so you can apply your own gamma if you wish.

Almost certainly you need to look at the color patches labeled ‘gamma’, but not all displays are the same so your mileage may vary.

So what happened to “turquoise” ?
We found a bug in our code! In our original calculation, which you may have read in the press, we used (in good faith) software with a non-standard white point. Rather it was supposed to use a D65 white point, but did not apply it. The result was an effective white point somewhat redder than Illuminant E (as if some red neon lights were around) at 0.365,0.335. Although the x,y values of the Universe are unchanged from our original calculation the shift in the white point made the universe appear ‘turquoise’. (i.e. x,y, remains the same, but the corresponding effective RGB values shift).

Needless to say since that first calculation we have had a lot of correspondence with color scientists, and have now written our own software to obtain a more accurate color value. We admit the color of the Universe was something of a gimmick, to try and make our story on spectra more accessible. Nevertheless it is an actual calculable thing so we believe it is important to get it right.

We would like to point out that our original intention was merely an amusing footnote in our paper, the original press story blew up beyond our wildest expectations! The mistake took some time to realize and track down. Only a handful of color scientists had the expertise to spot the error. One moral of this story is we should have paid more attention to the ‘color science’ aspect and had that refereed as well.

Enough talk. So what color is the Universe?
Really the answer is so close to white, it is difficult to say. That is why such a small error had such a large effect. The most common choice for white is D65. However if one were to introduce a beam of cosmic spectrum into a room strongly illuminated by light bulbs only (Illuminant A) it would appear very blue, as shown above. Overall, probably Illuminant E is the most correct, for looking at the Universe from afar in dark conditions. So our new best guess is:

BEIGE

Although it’s arguable that it might look more pinkish (like D65 above). Good luck if you can see the difference between this color and white! You should be able to just see it, however if we had made the page background black, it would be very difficult! We have had numerous suggestions for this color emailled to us. We have a top ten, and deem the winner to be “Cosmic Latte” being caffeine biased!

A simulation of the Universe
Because of all these complexities we have decided to see for ourselves. Mark Fairchild at Munsell Color Laboratories in Rochester, NY is working with us to make a simulation of the cosmic spectrum, they can control light sources to give exactly the same red/green/blue eye stimulation as you would see from the cosmic spectrum. We will then be able to view this under a variety of lighting conditions, perhaps simulating deep space, and see for ourselves the true color of the Universe.

The real science story
Of course, our real motive for calculating the cosmic spectrum was really a lot more than producing these pretty color pictures. The color is interesting but in fact the cosmic spectrum is rich in detail and tells us a lot more about the history of star formation in the Universe. You may have noticed above that the cosmic spectrum contains dark lines and bright bands, these correspond to the characteristic emission and absorption of different elements:

These may remind you of Fraunhofer lines in the Solar Spectrum. Exactly the same process of atomic absorption is at work. The strength of the dark lines is determined by the temperatures of the stars contributing to the cosmic spectrum. Older stars have cooler atmospheres and produce a different set of lines to hot young stars. By analyzing the spectrum we can work out the relative proportions of these and try and infer what the star-formation rate was in past ages of the Universe. The gory details of this analysis are given in Baldry, Glazebrook, et al. 2002. A simple picture of our inferred most likely histories of star formation in the Universe is shown here:

All these models give the correct cosmic spectrum in the 2dF survey and all of them say that the majority of stars in the Universe today formed more than 5 billion years ago. This of course implies that the color of the Universe would have been different in the past when there were more hot young blue stars. In fact we can calculate what this would be from our best fitting model. The evolution of the color from 13 billion years ago to 7 billion years in the future looks like this under our various assumptions:

The universe started out young and blue, and grew gradually redder as the population of evolved ‘red’ giant stars built up. The rate of formation of new stars has declined precipitously in the last 6 billion years due to the decline in reserves of interstellar gas for forming new stars. As the star-formation rate continues to decline and more stars become red giants the color of the Universe will become redder and redder. Eventually all stars will disappear and nothing will be left but black holes. These too will eventually evaporate via the Hawking process and nothing will be left except for old light, which will itself redden as the Universe expands forever (in the current cosmological model).

Original Source: JHU News Release

Watch the Shuttle Mission Live

Okay, if you want more information about the current space shuttle mission, I highly recommend that you just go straight to the source and watch it live – directly from NASA. Many people don’t know, but NASA has its own television channel called NASA TV (boring name, I know; I would have called it Space Action Theatre!, but that’s me). I don’t know of any cable companies that support it, but you can usually get the station with a satellite dish.

If you don’t have a satellite dish, or you want to watch the coverage from your computer, then you can watch it on the Internet. The quality of the video stream can be pretty good. Don’t just watch a 10-second clip on CNN, watch the whole spacewalk live and hear the communications between the astronauts and the ground control. The helmet cam is the coolest innovation.

So, where to watch it on the Internet? First check out NASA’s schedule of events here. Then, find a place to watch it on the web. NASA lists some sources on this page, but let me save you the time. Yahoo has the most reliable stream.

Whew, I should probably get job in NASA’s PR department. 😉

Fraser Cain, Publisher

P.S. The Christian Science monitor wrote an article about the Hubble mission, used Universe Today as a source and asked for a link in return. Gladly!

NASA Makes Contact With Pioneer

Even though it’s a distant 11.9 billion kilometres away, Pioneer 10 is still coming in loud and clear. NASA scientists sent a message to the spacecraft from California using the agency’s Deep Space Network and received a reply just over 22 hours later at a dish in Spain. This communication occurred on the 30th anniversary of the spacecraft’s launch.

Hubble Gets New Solar Panels

Spacewalking astronauts spent their second day outside the space shuttle Columbia on Tuesday, adding a second new solar array to the Hubble Space Telescope. During the 7-hour, 16-minute spacewalk, astronauts James Newman and Michael Massimino also replaced one of the telescope’s stabilizing gyroscopes. The newly installed solar arrays are smaller than the telescope’s previous arrays, but they actually provide 20% more power. Three more spacewalks are still planned.

Columbia Links up With Hubble

Image credit: NASA
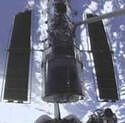
Nearly 48 hours after launching from Cape Canaveral, the space shuttle Columbia caught up with the Hubble Space Telescope, grabbed it with the Canadarm and linked up. After the Sunday morning link up, the astronaut crew activated the motors that retract Hubble’s solar panels – unused since 1993, they performed flawlessly. Astronauts John Grunsfeld and Rick Linnehan will begin their first spacewalk on Monday to install new solar arrays.

The Hubble Space Telescope is secure in Columbia?s payload bay following its capture at 3:31 a.m. central time today, as the two spacecraft soared 350 miles above the Pacific Ocean southwest of the Mexican Coast.

Columbia?s chase of the telescope ended with Commander Scott Altman and Pilot Duane Carey manually flying Columbia to within 35 feet of Hubble allowing Mission Specialist Nancy Currie to use the shuttle?s robot arm to gently grasp the orbiting observatory.

With the telescope safely in the payload bay, the crew turned its attention to retracting the two large solar arrays that generate power for the telescope. The motors that drive the two arrays had not been used since the panels were originally deployed during the first servicing mission in December 1993. The motors performed flawlessly taking approximately five minutes to retract each of the two arrays. The retractions were scheduled to take place during orbital daytime to allow sunlight to adequately warm the arrays prior to retraction.

The first in a pair of new-generation solar arrays will be installed by John Grunsfeld and Rick Linnehan on the first scheduled spacewalk of the mission, which is set to begin about 12:30 a.m. Monday. However, it is possible the spacewalk could begin up to one hour earlier than scheduled.

The crew is scheduled to wake up about 8 p.m. today, and within hours Grunsfeld and Linnehan, with the assistance of crewmates Jim Newman and Mike Massimino, will begin donning their spacesuits. They will begin the spacewalk by setting up some of the tools they will use, before Grunsfeld and Linnehan, working together, remove the old array, stow it in the payload bay and install the new starboard side array. They will also install its associated electrical support components, called a Diode Box Assembly. Mission Control bid the crew goodnight just before noon today concluding a busy and successful day culminating with the capture of the Hubble Space Telescope. The next STS-109 mission status report will be issued Sunday evening following crew wake-up or as events warrant.

Original Source: NASA News Release

First Odyssey Photos Released

It’s only the first few photographs from Mars Odyssey, but scientists are already excited about what the spacecraft has turned up on the surface of Mars. Odyssey, which began mapping the planet last week, has detected significant amounts of hydrogen near the planet’s south pole. Scientists believe this hydrogen is evidence of water ice – and not just surface frost, but a large quantity of frozen water.

Initial science data from NASA’s Mars Odyssey spacecraft, which began its mapping mission last week, portend some tantalizing findings by the newest Martian visitor, including possible identification of significant amounts of frozen water.

“We are delighted with the quality of data we’re seeing,” said Dr. Steve Saunders, Odyssey project scientist at JPL. “We’ll use it to build on what we’ve learned from Mars Global Surveyor and other missions. Now we may actually see water rather than guessing where it is or was. And with the thermal images we are able to examine surface geology from a new perspective.”

“These preliminary Odyssey observations are the ‘tip of the iceberg’ of the science results that are soon to come, so stay tuned,” said Dr. Jim Garvin, lead scientist of the Mars Exploration Program at NASA Headquarters, Washington, D.C.

New images taken by the thermal emission imaging system show the temperature of the surface at a remarkable level of clarity and detail during both the martian day and night. The images can be seen at http://mars.jpl.nasa.gov/odyssey and http://themis.asu.edu/latest . Odyssey’s camera system is studying Mars’ surface mineralogy to reveal geologic history. The thermal infrared images are 30 times sharper than previously available images, and the camera’s visible-light images will fill a gap in resolution between Viking Orbiter and Mars Global Surveyor pictures.

Initial measurements by the gamma ray spectrometer instrument suite show the presence of significant amounts of hydrogen in the south polar region of Mars. The high hydrogen content is most likely due to water ice, though the amount of ice cannot be quantified yet. Further analysis will be conducted to confirm the interpretation. The detection of hydrogen is based both on the intensity of gamma rays emitted by hydrogen, and by the intensity of neutrons that are moderated by hydrogen. The neutron intensity was observed by the high energy neutron detector and the neutron spectrometer. Additional information is available online at http://grs.lpl.arizona.edu/results/presscon1/ .

“The preliminary assessment of the gamma-ray spectrometer data indicates the likely presence of hydrogen in the upper few feet of the martian surface as sampled at spatial scales approximately 400 miles across. Further analysis and another month or so of mapping will permit more quantitative assessment of these observations and allow for a refined interpretation,” said Garvin.

Measurements made by the martian radiation environment experiment during Odyssey’s cruise phase suggest that the daily dose of radiation experienced by astronauts on their way from Earth to Mars would be more than twice the dose endured by astronauts on the International Space Station. Investigators are in the process of troubleshooting the radiation experiment to determine why the instrument stopped communicating and was turned off in August 2001.

The Jet Propulsion Laboratory manages the 2001 Mars Odyssey mission for NASA’s Office of Space Science, Washington, D.C. Investigators at Arizona State University in Tempe, the University of Arizona in Tucson, and NASA’s Johnson Space Center, Houston, operate the science instruments. Additional science partners are located at the Russian Aviation and Space Agency, which provided the high-energy neutron detector, and at Los Alamos National Laboratories, New Mexico, which provided the neutron spectrometer. Lockheed Martin Astronautics, Denver, is the prime contractor for the project, and developed and built the orbiter. Mission operations are conducted jointly from Lockheed Martin and from JPL, a division of the California Institute of Technology in Pasadena.

Original Source: NASA News Release

Cooling Problem Threatens Shuttle Mission

Image credit: NASA
Space shuttle managers are debating whether to end the space shuttle Columbia’s mission to upgrade the Hubble Space Telescope because one of its two cooling systems isn’t working properly. Although the shuttle is equipped with two redundant systems, NASA flight rules demand that the shuttle return to Earth if either completely fail – right now, one is just blocked and not working at full capacity. Mission controllers will make a decision to scrub the mission or keep going Friday evening.

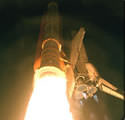
Following Columbia?s on-time launch from the Kennedy Space Center this morning, flight controllers in Mission Control noticed a degraded flow rate in one of two freon cooling loops that help to dissipate heat from the orbiter.

There are two freon cooling loops that are part of the shuttle?s active thermal control system, one on the port and one on the starboard side of the payload bay. Freon loop 1 on the port side is showing a degraded flow rate.

While low, the flow rate is slightly above flight rule limits. Mission managers are currently reviewing the flight data and studying the past performance of the sensors that measure the flow rate of the freon through the loops to build confidence in the performance of the freon loop and its ability to support the STS-109 mission through completion.

After reaching orbit this morning, Commander Scott Altman and Pilot Duane Carey commanded the first in a series of engine firings to position Columbia for its Sunday morning rendezvous with the Hubble Space Telescope. Their crew mates ? Mission Specialists John Grunsfeld, Mike Massimino, Nancy Currie, Jim Newman and Rick Linnehan ? began readying Columbia for its on-orbit operations by stowing away their launch and entry suits and opening the interior hatch to Columbia?s airlock.

This is Columbia?s first flight since July 1999, following an extensive modification period in which many of its systems were replaced or enhanced. Columbia was NASA?s first shuttle orbiter and flew for the first time in April 1981.

The next status report will be issued following the crew?s scheduled wake-up call at 8:22 p.m., or as events warrant.

Original Source: NASA News Release

Jupiter is Buffeted by Solar Wind

Image credit: NASA
Scientists have uncovered the workings of an invisible bubble of charged particles that surround Jupiter and interact with the solar wind. This bubble is called the magnetosphere and extends to a distance of 100 times the diameter of Jupiter itself. 14 months ago, two spacecraft: Galileo and Cassini took simultaneous readings of the giant planet’s magnetosphere from different vantage points. Detailed results of their findings will be published in scientific journals in the next few days.

Scientists simultaneously using a combination of NASA spacecraft have seen into the workings of an invisible whirling bubble of charged particles surrounding Jupiter.

That bubble, Jupiter’s magnetosphere, is the biggest object with distinct boundaries within our solar system, more than 100 times wider than Jupiter itself. It contracts in response to shock waves from the Sun, according to one report appearing in the journal Nature tomorrow. In all, seven reports appearing together will detail various results from a concerted research campaign that took advantage of the Saturn-bound Cassini spacecraft’s flyby of Jupiter 14 months ago.

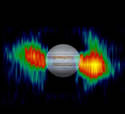
The campaign found extremely energetic electrons traveling near the speed of light close to Jupiter, as well as a vast nebula of neutral atoms, and triggers for glowing auroras near Jupiter’s north and south poles.

“We’re seeing results from a remarkable opportunity,” said Dr. Scott Bolton, a physicist at NASA’s Jet Propulsion Laboratory, Pasadena, Calif., and a co-author of three of the reports.

“We had one spacecraft, Galileo, inside the magnetosphere monitoring what was happening there at the same time another spacecraft, Cassini, was outside the magnetosphere monitoring the solar wind just upstream,” Bolton said. The solar wind is particles from the Sun flowing outward through the solar system. Jupiter’s magnetosphere, like Earth’s, deflects the solar wind but gets pushed around by its gusts.

On Jan. 10, 2001, when Cassini and Galileo were more than 20 times farther from each other than Earth is from the Moon, each spacecraft encountered the boundary of Jupiter’s magnetosphere while the bubble was contracting in response to an increase in solar-wind pressure.

“This is the first two-point measurement of the Jovian system actually responding to the solar wind,” said Dr. William Kurth, physicist at the University of Iowa, Iowa City, and lead author of the Nature report on these results. “The combined observations of Galileo and Cassini help show us the relative importance of the influence of the solar wind and the factors affecting the magnetosphere from within — primarily the energy from Jupiter’s rotation and the supply of material from volcanoes on the moon Io.” The Jupiter observations strengthen confidence in our understanding about Earth’s protective magnetosphere.

Shock waves from outbursts on the Sun, carried outward on the solar wind and detected by Cassini, also stimulated radio emissions from deep within Jupiter’s magnetosphere and brightened auroras at Jupiter’s poles, Dr. Donald Gurnett of the University of Iowa reports. Those effects suggest that electron density and electric currents in the magnetosphere increase when it is compacted by the shock wave.

Besides Galileo, which has been orbiting Jupiter since 1995, and Cassini, scientists used two Earth orbiters — the Hubble Space Telescope and Chandra X-ray Observatory ? plus radio telescopes in New Mexico and Arizona to examine Jupiter’s surroundings while Cassini was there.

Hubble images show patches of Jupiter’s aurora stimulated by an event Galileo detected within the magnetosphere, reports Dr. Barry Mauk of Johns Hopkins University’s Applied Physics Laboratory, Laurel, Md. The event is a surge of charged particles toward the planet, apparently analogous to similar aurora-triggering surges that release pent-up energy in Earth’s magnetosphere. Some other features in Jupiter’s aurora are “footprints” of currents flowing through the magnetosphere from three of the planet’s large moons, reports Dr. John Clarke of Boston University. Dr. Randall Gladstone of the Southwest Research Institute, San Antonio, Texas, describes a 45-minute rhythm in auroras at X-ray wavelengths, likely linked to a still-unidentified stimulus in the outer portion of the magnetosphere.

Cassini carries a type of magnetosphere-imaging instrument no previous interplanetary spacecraft has had. The instrument not only showed some structural detail of Jupiter’s magnetosphere, it also detected a cloud of neutral atoms stretching away from the planet as a “hot neutral wind,” reports Dr. Stamatios Krimigis of Hopkins’ Applied Physics Laboratory. The magnetic field holds charged particles in, but neutral ones escape to create a nebula of particles that extends beyond the magnetosphere.

High-energy electrons in radiation belts close to Jupiter emit radio waves that have been monitored from Earth for years. JPL’s Bolton and other scientists used Cassini while it was near Jupiter to map details never seen before in those belts. About 2,300 students at high schools and middle schools across the country participated in a program of radio-telescope observations that aided interpretation of those Cassini observations.

Cassini is a cooperative project of NASA, the European Space Agency and the Italian Space Agency. JPL manages Cassini and Galileo for NASA?s Office of Space Science, Washington, D.C. JPL is a division of the California Institute of Technology in Pasadena.

Original Source: NASA/JPL News Release