One of the defining characteristics of the renewed age of space exploration is the way that private aerospace companies are participating like never before. In addition to major companies like SpaceX, Blue Origin and United Launch Alliance, there are countless companies that are looking to reduce the costs of individual missions and provide launch services to the public and private sector.
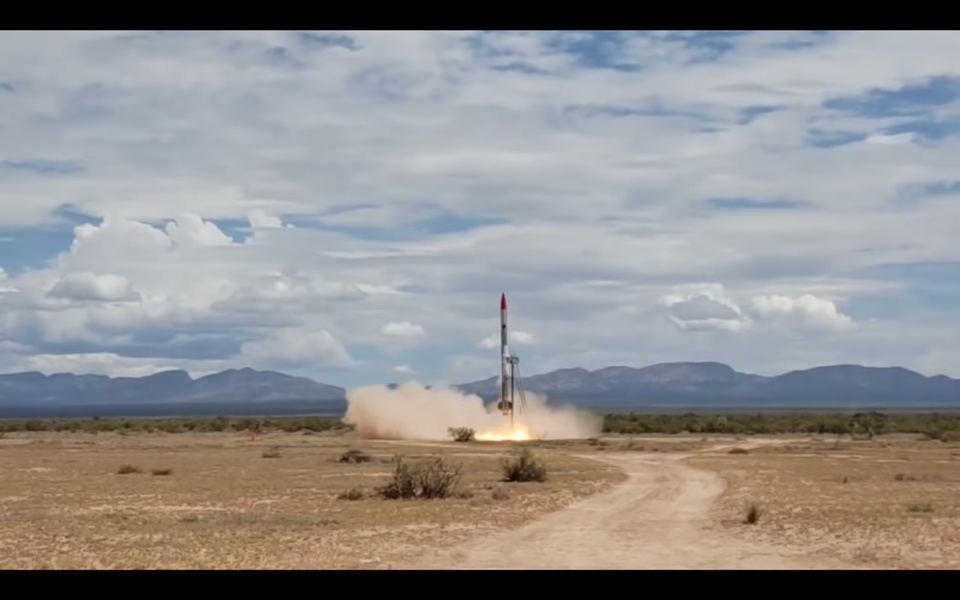
One such company is EXOS Aerospace Systems & Technologies, Inc., a leading developer of reusable space launch vehicles. This past summer, the company conducted a Pathfinder test flight with their Suborbital Autonomous Rocket with GuidancE (SARGE) rocket. The successful launch and recovery has validated the SARGE platform and was a major step towards EXOS’s long term plans to send small packages into orbit using reusable rockets.
Continue reading “Exos Aerospace Completes Successful Launch Test of Their SARGE Rocket”