In 1990, the Voyager 1 spaceprobe took a picture of Earth when it was about 6.4 billion km (4 billion mi) away. In this image, known as the “pale blue dot“, Earth and the Moon appeared as mere points of light because of the sheer distance involved. Nevertheless, it remains an iconic photo that not only showed our world from space, but also set long-distance record.
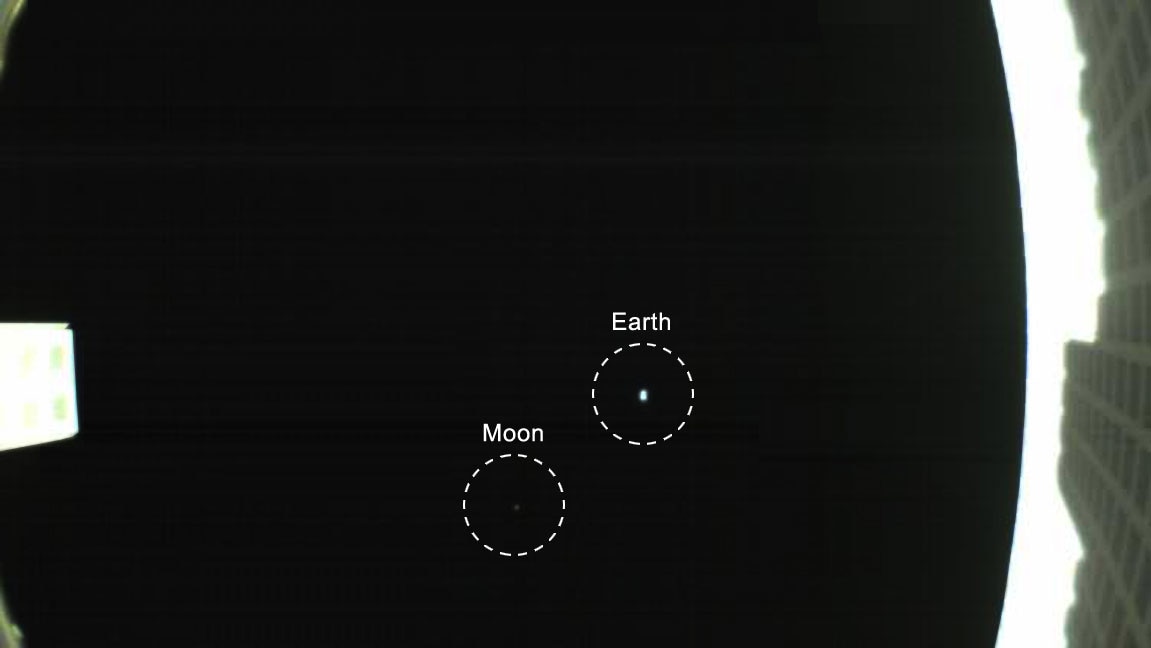
As it turns out, NASA set another long-distance record for CubeSats last week (on May. 8th, 2018) when a pair of small satellites called Mars Cube One (MarCO) reached a distance of 1 million km (621,371 mi) from Earth. On the following day, one of the CubeSats (MarCO-B, aka. “Wall-E”) used its fisheye camera to take its own “pale blue dot” photo of the Earth-Moon system.
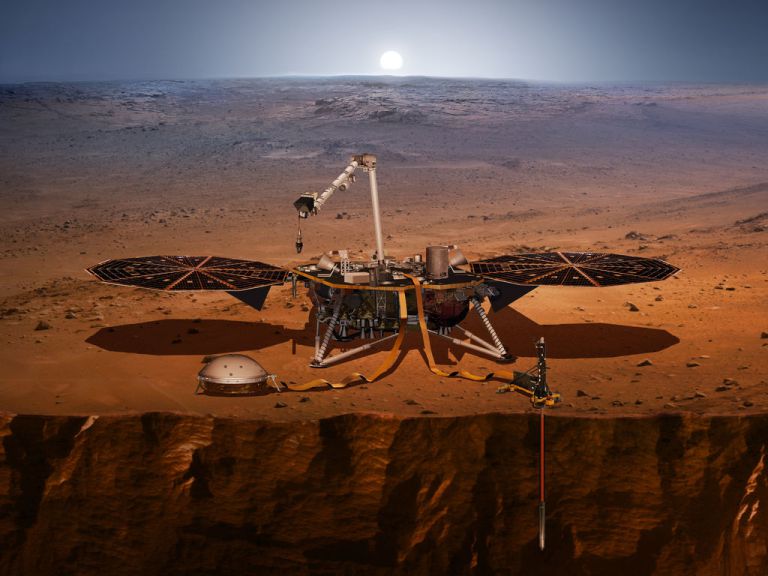
The two CubeSats were launched on May 5th along with the Interior Exploration using Seismic Investigations, Geodesy and Heat Transport (InSight) lander, which is currently on its way to Mars to explore the planet’s interior structure. As the first CubeSats to fly to deep pace, the purpose of the MarCO mission is to demonstrate if CubeSats are capable of acting as a relay with long-distance spacecraft.
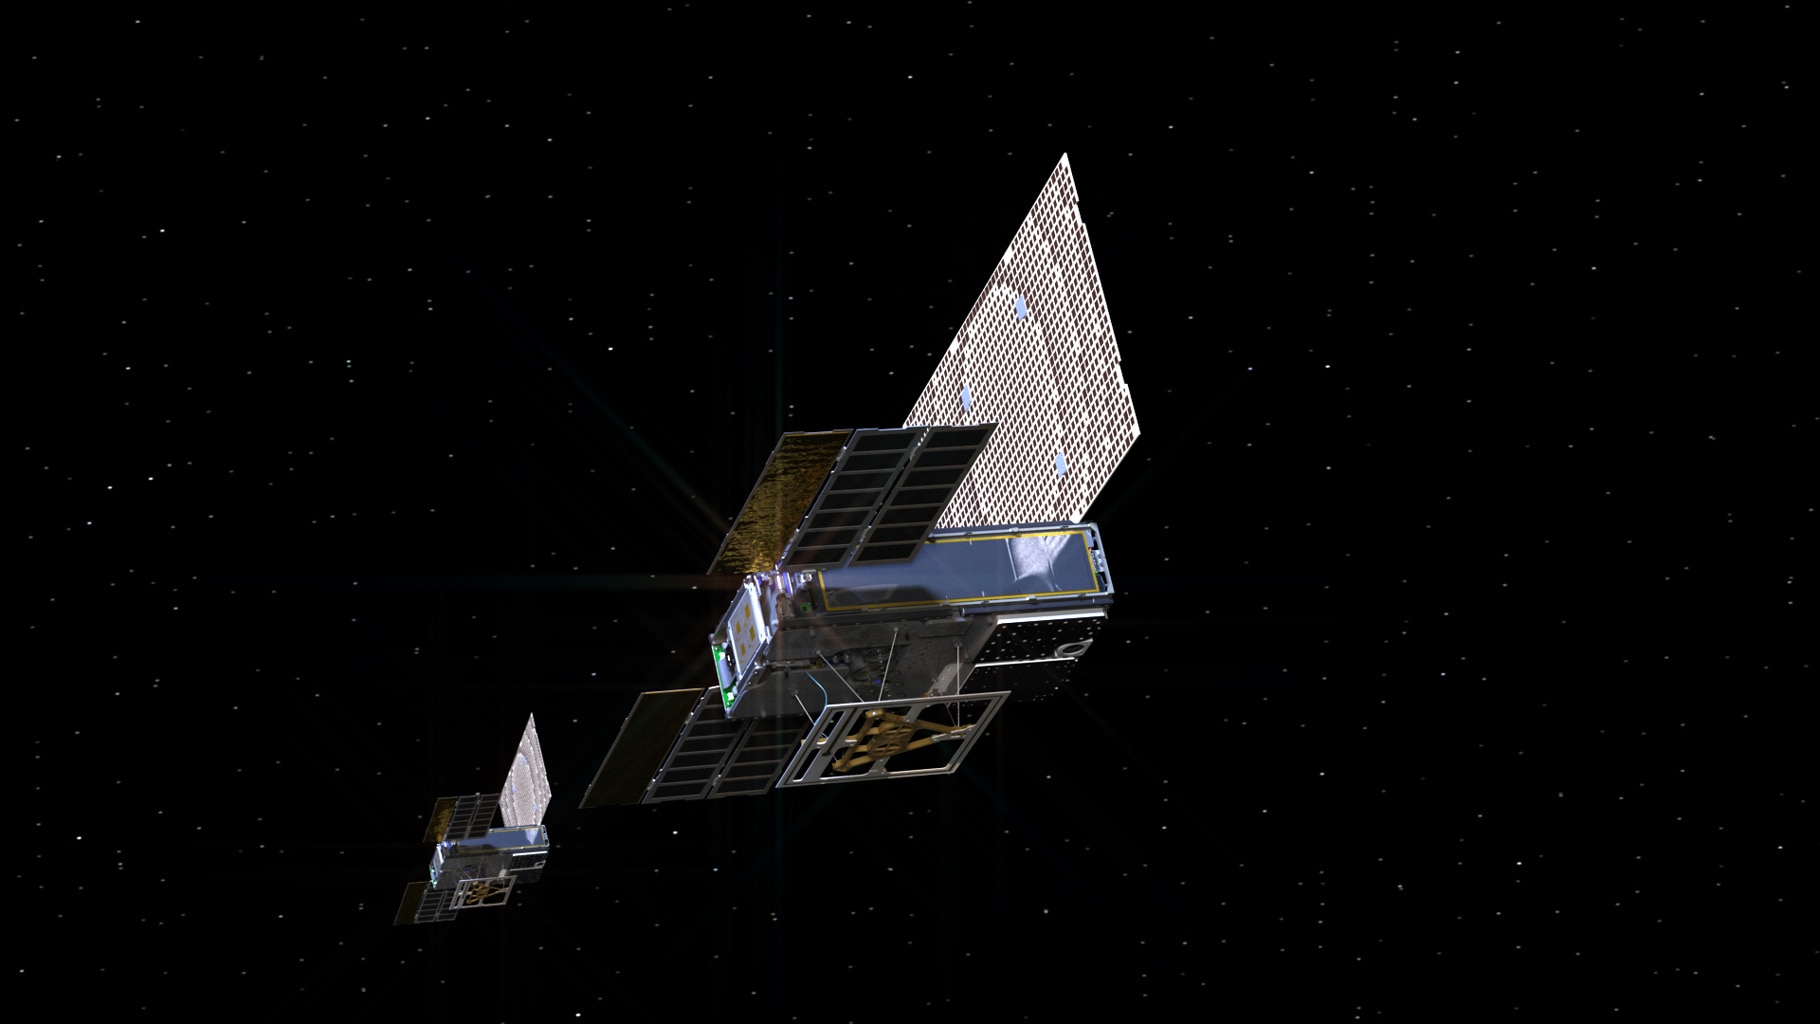
To this end, the probes will be responsible for monitoring InSight as it makes its landing on Mars in late November, 2018. The photo of Earth and the Moon was taken as part of the process used by the engineering team to confirm that the spacecraft’s high-gain antenna unfolded properly. As Andy Klesh, MarCO’s chief engineer at NASA’s Jet Propulsion Laboratory, indicated in a recent NASA press release:
“Consider it our homage to Voyager. CubeSats have never gone this far into space before, so it’s a big milestone. Both our CubeSats are healthy and functioning properly. We’re looking forward to seeing them travel even farther.”
This technology demonstration, and the long-distance record recently set by MarCO satellites, provides a good indication of just how far CubeSats have come in the past few years. Originally, CubeSats were developed to teach university students about satellites, but have since become a major commercial technology. In addition to providing vast amounts of data, they have proven to be a cost-effective alternative to larger, multi-million dollar satellites.
The MarCO CubeSats will be there when the InSight lander accomplishes the most difficult part of its mission, which is entering Mars’ extremely thin atmosphere (which makes landings extremely challenging). As the lander travels to Mars, MarCO-A and B will travel along behind it and (should they make it all the way to Mars) radio back data about InSight as it enters the atmosphere and descends to the planet’s surface.
The job of acting as a data relay will fall to NASA’s Mars Reconnaissance Orbiter (MRO), which has been in orbit of Mars since 2006. However, the MarCOs will also be monitoring InSight to see if future missions will be capable of bringing their own relay to Mars, rather than having to rely on an orbiter that is already there. They may also demonstrate a number of experimental technologies, which includes their radio and propulsion systems.
The main attraction though, are the high-gain antennas which will be providing information on InSights’ progress. At the moment, the team has received early confirmation that the antennas have successfully deployed, but they will continue to test them in the weeks ahead. If all goes according to plan, the MarCOs could demonstrate the ability of CubeSats to act not only as relays, but also their ability to gather information on other planets.
In other words, if the MarCOs are able to make it to Mars and track InSight’s progress, NASA and other agencies may contemplate mounting full-scale missions using CubeSats – sending them to the Moon, Mars, or even beyond. Later this month, the MarCOs will attempt their first trajectory correction maneuvers, which will be the first such maneuver are performed by CubeSats.
In the meantime, be sure to check out this video of the MarCO mission, courtesy of NASA 360:
Further Reading: NASA