When the James Webb Space Telescope takes to space, some tremendous scientific discoveries are expected to result. As the spiritual and scientific successor to the Hubble, Spitzer, and Kepler Space Telescopes, this space observatory will use its advanced suite of infrared instruments to the look back at the early Universe, study the Solar System, and help characterize extra-solar planets.
Unfortunately, the launch of this mission has been delayed several times now, with the launch date now set for some time in 2019. And based on the amount of work NASA needs to do complete the JWST before launch, the Government Accountability Office (GAO) believes that more delays are coming and believes that the project is likely to exceed the cost cap set by Congress in 2011 at $8 billion.
Part of the problem is that all the remaining schedule reserve – the extra time set aside in the event of delays or unforeseen risks – was recently used to address technical issues. These include the “anomalous readings” detected from the telescope during vibration testing back in December 2016. NASA responded to this by giving the project up to 4 months of schedule reserve by extending the launch window.
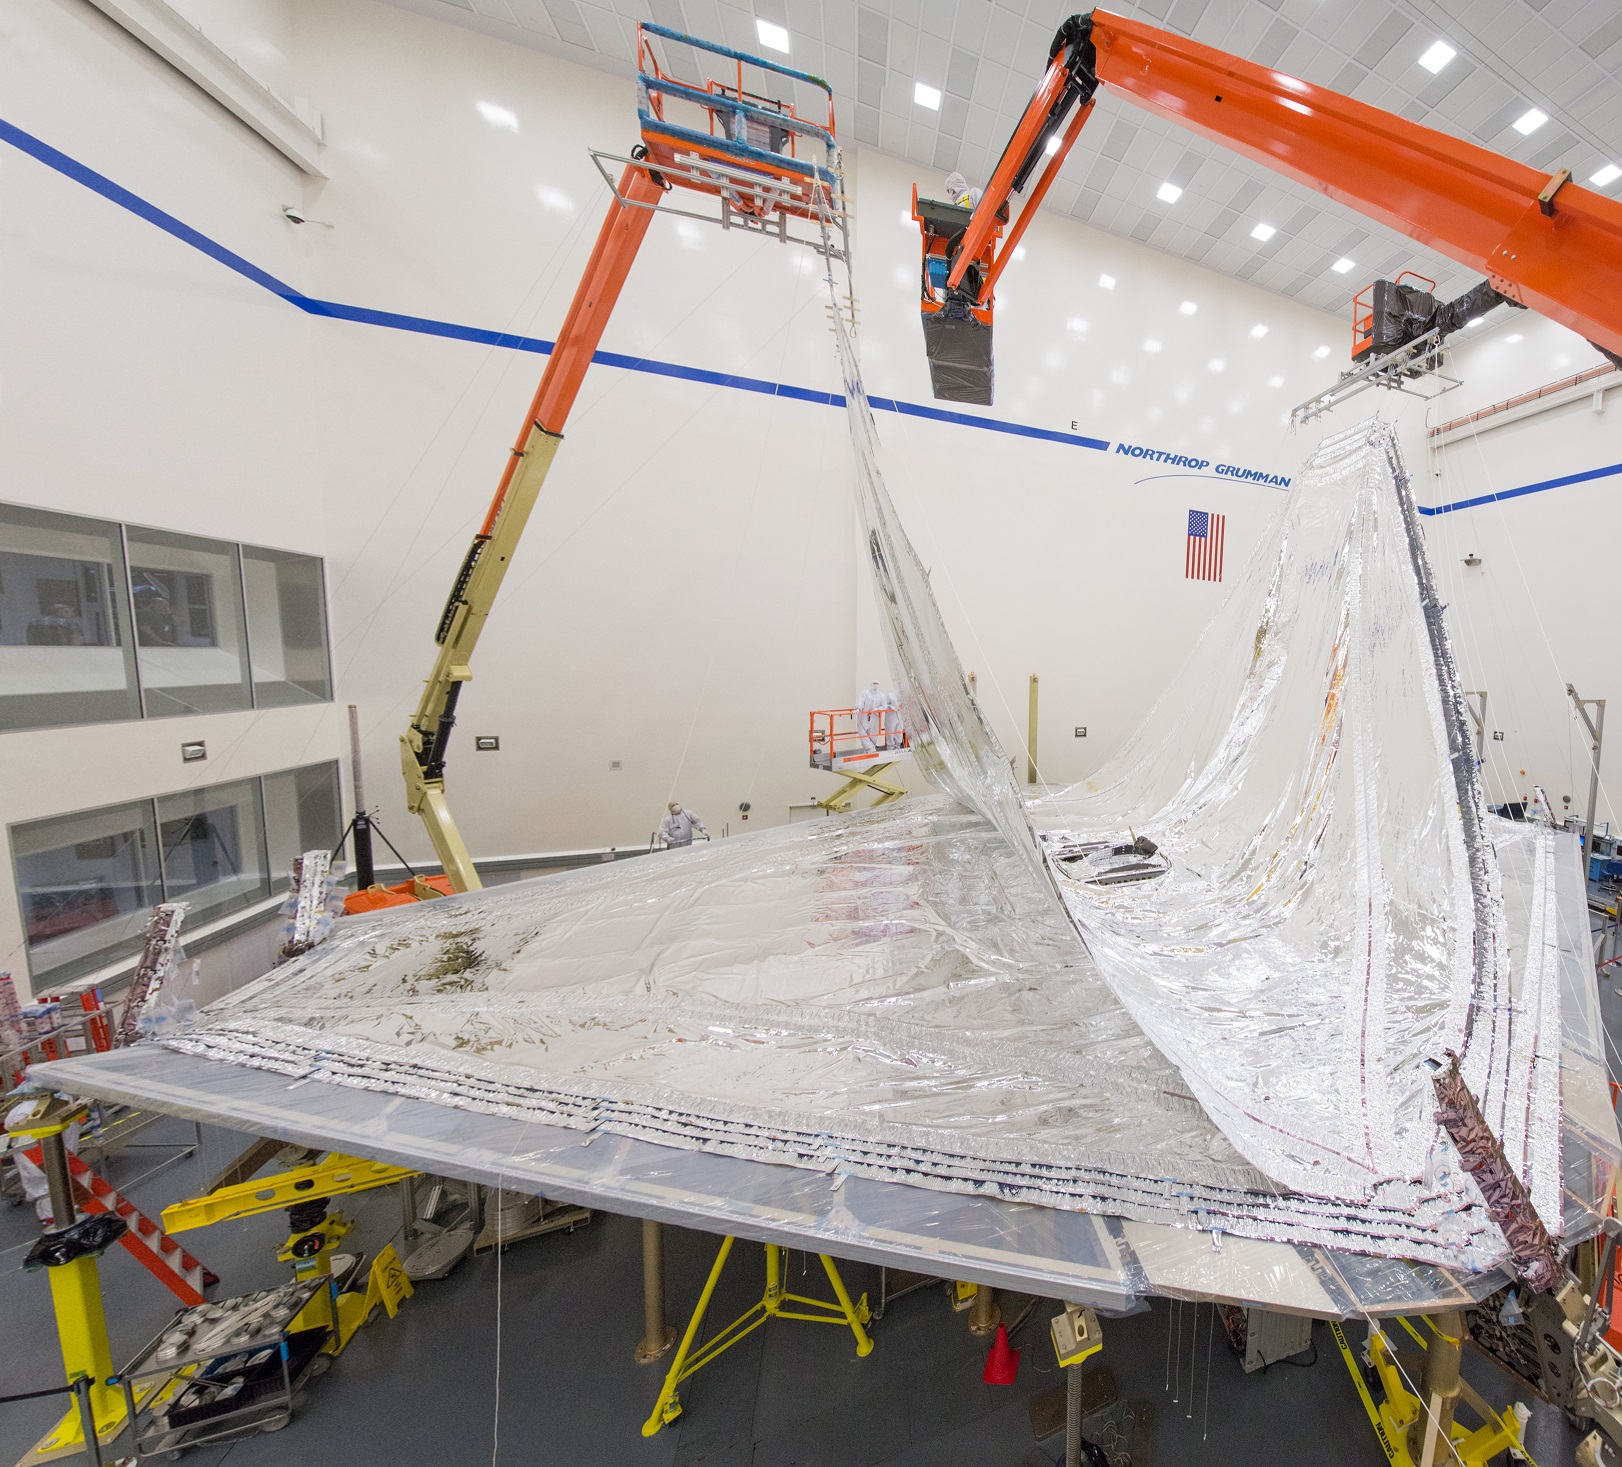
However, in 2017, NASA delayed the launch window again by 5 months, from October 2018 to a between March and June 2019. This delay was requested by the project team, who indicated that they needed to address lessons learned from the initial folding and deployment of the observatory’s sunshield. As Eric Smith, the program director for the James Webb Space Telescope at NASA Headquarters, explained to Congress at the time:
“Webb’s spacecraft and sunshield are larger and more complex than most spacecraft. The combination of some integration activities taking longer than initially planned, such as the installation of more than 100 sunshield membrane release devices, factoring in lessons learned from earlier testing, like longer time spans for vibration testing, has meant the integration and testing process is just taking longer. Considering the investment NASA has made, and the good performance to date, we want to proceed very systemmatically through these tests to be ready for a Spring 2019 launch.”
Given the remaining integration and test work that lies ahead, more delays are expected. According to the GAO, it is this phase where problems are most likely to be found and schedules revised. Coupled with the fact that only 1.5 months of schedule reserves remain until the end of the launch window, they anticipate that additional launch delays are likely, which will also require budget increases.
Initially, the budget estimates that were set by Congress indicated that the observatory would cost $1.6 billion and would launch by 2011, with an overall cost cap set at $8 billion. However, NASA has revised the budget multiple times since then (in conjunction with the multiple delays) and estimates that the budget for a 2019 launch window would now be $8.8 billion.
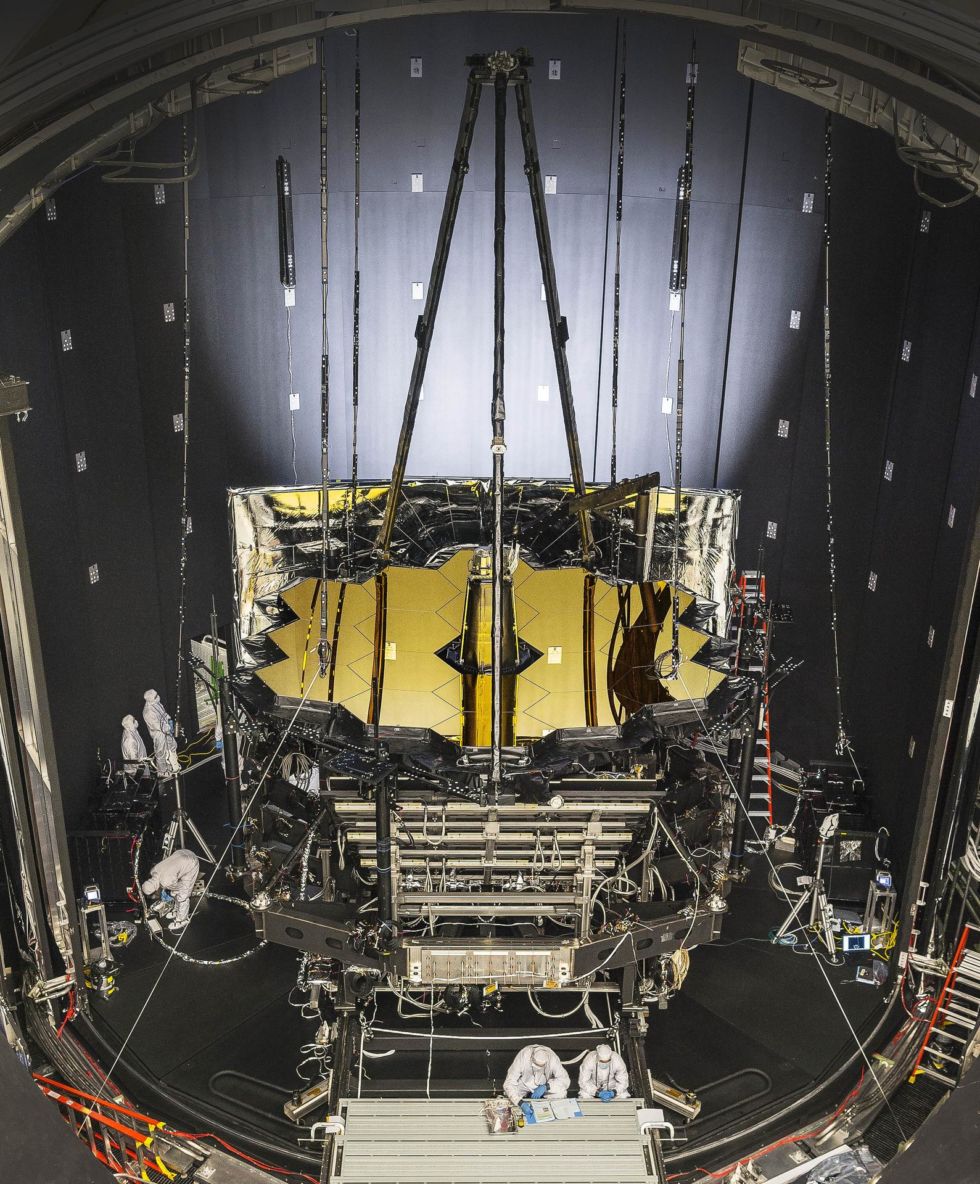
Once deployed, the JWST will be the most powerful space telescope ever built and will serve thousands of astronomers worldwide. As a collaborative project between NASA, the European Space Agency (ESA), and the Canadian Space Agency (CSA), it also representative of the new era of international cooperation. But by far, the most impressive thing about this mission is the scientific discoveries it is expected to make.
It’s 6.5 meter (21-foot) infrared-optimized telescopes will search to a distance of over 13 billion light years, allowing it to study the first stars and galaxies that formed. It will also allow astronomers to study the atmospheres of Solar Planets and exoplanets and other objects within our Solar System. As such, and delays and cost overruns in the project are cause for concern.
In the meantime, the project’s Standing Review Board will conduct an independent review in early 2018 to determine if the June 2019 launch window can still be met. With so many experiments and surveys planned for the telescope, it would be no exaggeration to say that a lot is riding on its successful completion and deployment. Best of luck passing review James Webb Space Telescope!
Further Reading: Government Accountability Office