More Surface Ice on Mercury than Previously Thought, says New Study

View of Mercury's north pole. based on MESSENGER probe data, showing polar deposits of water ice. Credit: NASA/Johns Hopkins University Applied Physics Laboratory/Carnegie Institution of Washington/National Astronomy and Ionosphere Center, Arecibo Observatory.

Back in 2012, scientists were delighted to discover that within the polar regions of Mercury, vast amounts of water ice were detected. While the existence of water ice in this permanently-shaded region had been the subject of speculation for about 20 years, it was only after the Mercury Surface, Space Environment, Geochemistry, and Ranging (MESSENGER) spacecraft studied the polar region that this was confirmed.

Based on the MESSENGER data, it was estimated that Mercury could have between 100 billion to 1 trillion tons of water ice at both poles, and that the ice could be up to 20 meters (65.5 ft) deep in places. However, a new study by a team of researchers from Brown University indicates that there could be three additional large craters and many more smaller ones in the northern polar region that also contain ice.

The study, titled “New Evidence for Surface Water Ice in Small-Scale Cold Traps and in Three Large Craters at the North Polar Region of Mercury from the Mercury Laser Altimeter“, was recently published in the Geophysical Research Letters. Led by Ariel Deutsch, a NASA ASTAR Fellow and a PhD candidate at Brown University, the team considered how small-scale deposits could dramatically increase the overall amount of ice on Mercury.
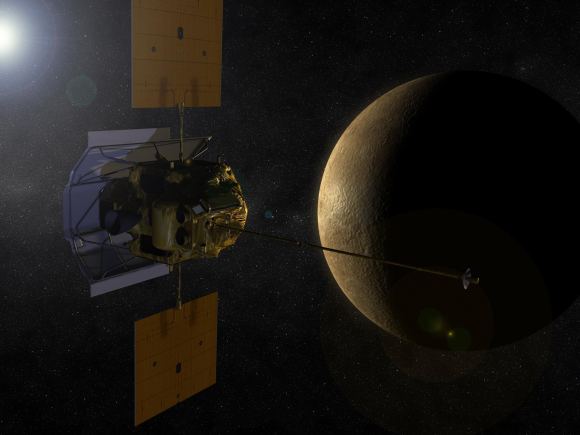
Artist’s concept of the MESSENGER spacecraft on approach to Mercury. Credit: NASA/JPL

Despite being the closest planet to the Sun, and experiencing scorching surface temperatures on its Sun-facing side, Mercury’s low axial tilt means that its polar regions are permanently shaded and experience average temperatures of about 200 K (-73 °C; -100 °F). The idea that ice might exist in these regions dates back to the 1990s, when Earth-based radar telescopes detected highly reflective spots within the polar craters.

This was confirmed when the MESSENGER spacecraft detected neutron signals from the planet’s north pole that were consistent with water ice. Since that time, it has been the general consensus that Mercury’s surface ice was confined to seven large craters. But as Ariel Deutsch explained in a Brown University press statement, she and her team sought to look beyond them:

“The assumption has been that surface ice on Mercury exists predominantly in large craters, but we show evidence for these smaller-scale deposits as well. Adding these small-scale deposits to the large deposits within craters adds significantly to the surface ice inventory on Mercury.”

For the sake of this new study, Deutsch was joined by Gregory A. Neumann, a research scientist from NASA’s Goddard Space Flight Center, and James W. Head. In addition to being a professor the Department of Earth, Environmental and Planetary Sciences at Brown, Head was also a co-investigator for the MESSENGER and the Lunar Reconnaissance Orbiter missions.
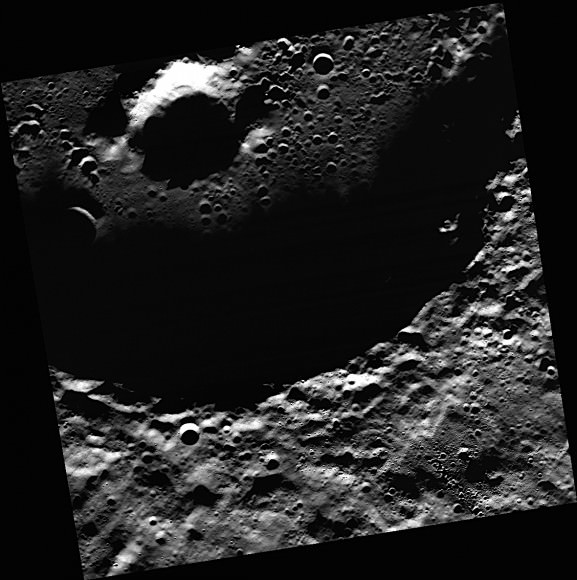
A view of the crater Prokofiev on Mercury. The crater is the largest one on the planet’s north pole area to have “radar-bright” material, a probable sign of ice. Credit: NASA/JHUAPL/CIW

Together, they examined data from MESSENGER’s Mercury Laser Altimeter (MLA) instrument. This instrument was used by MESSENGER to measure the distance between the spacecraft and Mercury, the resulting data being then used to create detailed topographical maps of the planet’s surface. But in this case, the MLA was used to measure surface reflectance, which indicated the presence of ice.

As an instrument specialist with the MESSENGER mission, Neumann was responsible for calibrating the altimeter’s reflectance signal. These signals can vary based on whether the measurements are taken from overhead or at an angle (the latter of which is refereed to as “off-nadir” readings). Thanks to Neumann’s adjustments, researchers were able to detect high-reflectance deposits in three more large craters that were consistent with water ice.

According to their estimates, these three craters could contain ice sheets that measure about 3,400 square kilometers (1313 mi²). In addition, the team also looked at the terrain surrounding these three large craters. While these areas were not as reflective as the ice sheets inside the craters, they were brighter than the Mercury’s average surface reflectance.

Beyond this, they also looked at altimeter data to seek out evidence of smaller scale deposits. What they found was four smaller craters, each with diameters of less than 5 km (3 mi), which were also more reflective than the surface. From this, they deduced that there were not only more large deposits of ice that were previously undiscovered, but likely many smaller “cold traps” where ice could exist as well.
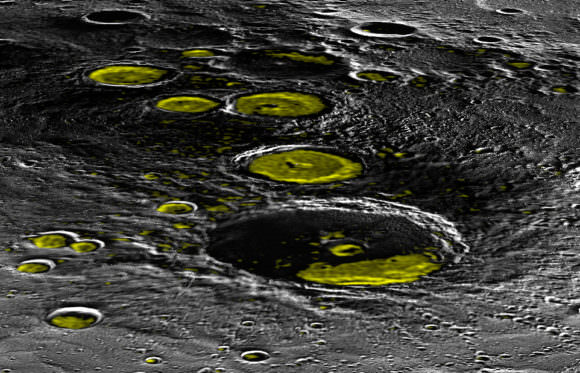
A forced perspective view of Mercury’s cratered north pole, showing the presence of water ice in yellow. Credit: NASA/JHUAPL/CIW

Between these three newly-discovered large deposits, and what could be hundreds of smaller deposits, the total volume of ice on Mercury could be considerably more than we previously thought. As Deutsch said:

“We suggest that this enhanced reflectance signature is driven by small-scale patches of ice that are spread throughout this terrain. Most of these patches are too small to resolve individually with the altimeter instrument, but collectively they contribute to the overall enhanced reflectance… These four were just the ones we could resolve with the MESSENGER instruments. We think there are probably many, many more of these, ranging in sizes from a kilometer down to a few centimeters.”

In the past, studies of the lunar surface also confirmed the presence of water ice in its cratered polar regions. Further research indicated that outside of the larger craters, small “cold traps”could also contain ice. According to some models, accounting for these smaller deposits could effectively double estimates on the total amounts of ice on the Moon. Much the same could be true for Mercury.

But as Jim Head (who also served as Deutsch Ph.D. advisor for this study) indicated, this work also adds a new take to the critical question of where water in the Solar System came from. “One of the major things we want to understand is how water and other volatiles are distributed through the inner Solar System—including Earth, the Moon and our planetary neighbors,” he said. “This study opens our eyes to new places to look for evidence of water, and suggests there’s a whole lot more of it on Mercury than we thought.”
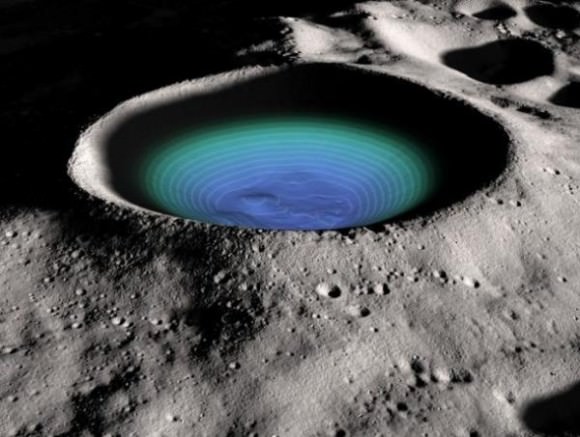
This shaded relief image shows the Moon’s Shackleton Crater, a 21-km-wide crater permanently shadowed crater near the lunar south pole. The crater’s interior structure is shown in false color based on data from NASA’s LRO probe. Credit: NASA

In addition to indicating the Solar System may be more watery than previously suspected, the presence of abundant ice on Mercury and the Moon has bolstered proposals for building outposts on these bodies. These outposts could be capable of turning local deposits water ice into hydrazine fuel, which would drastically reduce the costs of mounting long-range missions throughout the Solar System.

On the less-speculative side of things, this study also offers new insights into how the Solar System formed and evolved. If water is far more plentiful today than we knew, it would indicate that more was present during the early epochs of planetary formation, presumably when it was being distributed throughout the Solar System by asteroids and comets.

Further Reading: Brown University, Geophysical Research Letters

Weekly Space Hangout -Sept 20, 2017: ANU Citizen Science Project for Supernovae

Hosts:
Fraser Cain (universetoday.com / @fcain)
Dr. Paul M. Sutter (pmsutter.com / @PaulMattSutter)
Dr. Kimberly Cartier ( KimberlyCartier.org / @AstroKimCartier )
Dr. Morgan Rehnberg (MorganRehnberg.com / @MorganRehnberg ChartYourWorld.org)

Special Guest:
This week’s guests are Dr Brad Tucker (@btucker22) and Dr Anais Möller (@anais_moller) of ANU Citizen Science Project for Supernovae. Brad is an Astrophysicist/Cosmologist, and currently a Research Fellow at the Research School of Astronomy and Astrophysics, Mt. Stromlo Observatory at the Australian National University. Anais is a cosmologist based in the Australian National University with an expertise in type Ia supernova cosmology. She has worked at low and high redshift supernovae surveys with the goal to study the effect of dark energy in our Universe.

Announcements:

If you would like to join the Weekly Space Hangout Crew, visit their site here and sign up. They’re a great team who can help you join our online discussions!

We record the Weekly Space Hangout every Wednesday at 5:00 pm Pacific / 8:00 pm Eastern. You can watch us live on Universe Today, or the Weekly Space Hangout YouTube page

300 Asteroids to be Explored by a Fleet of Nanosatellites

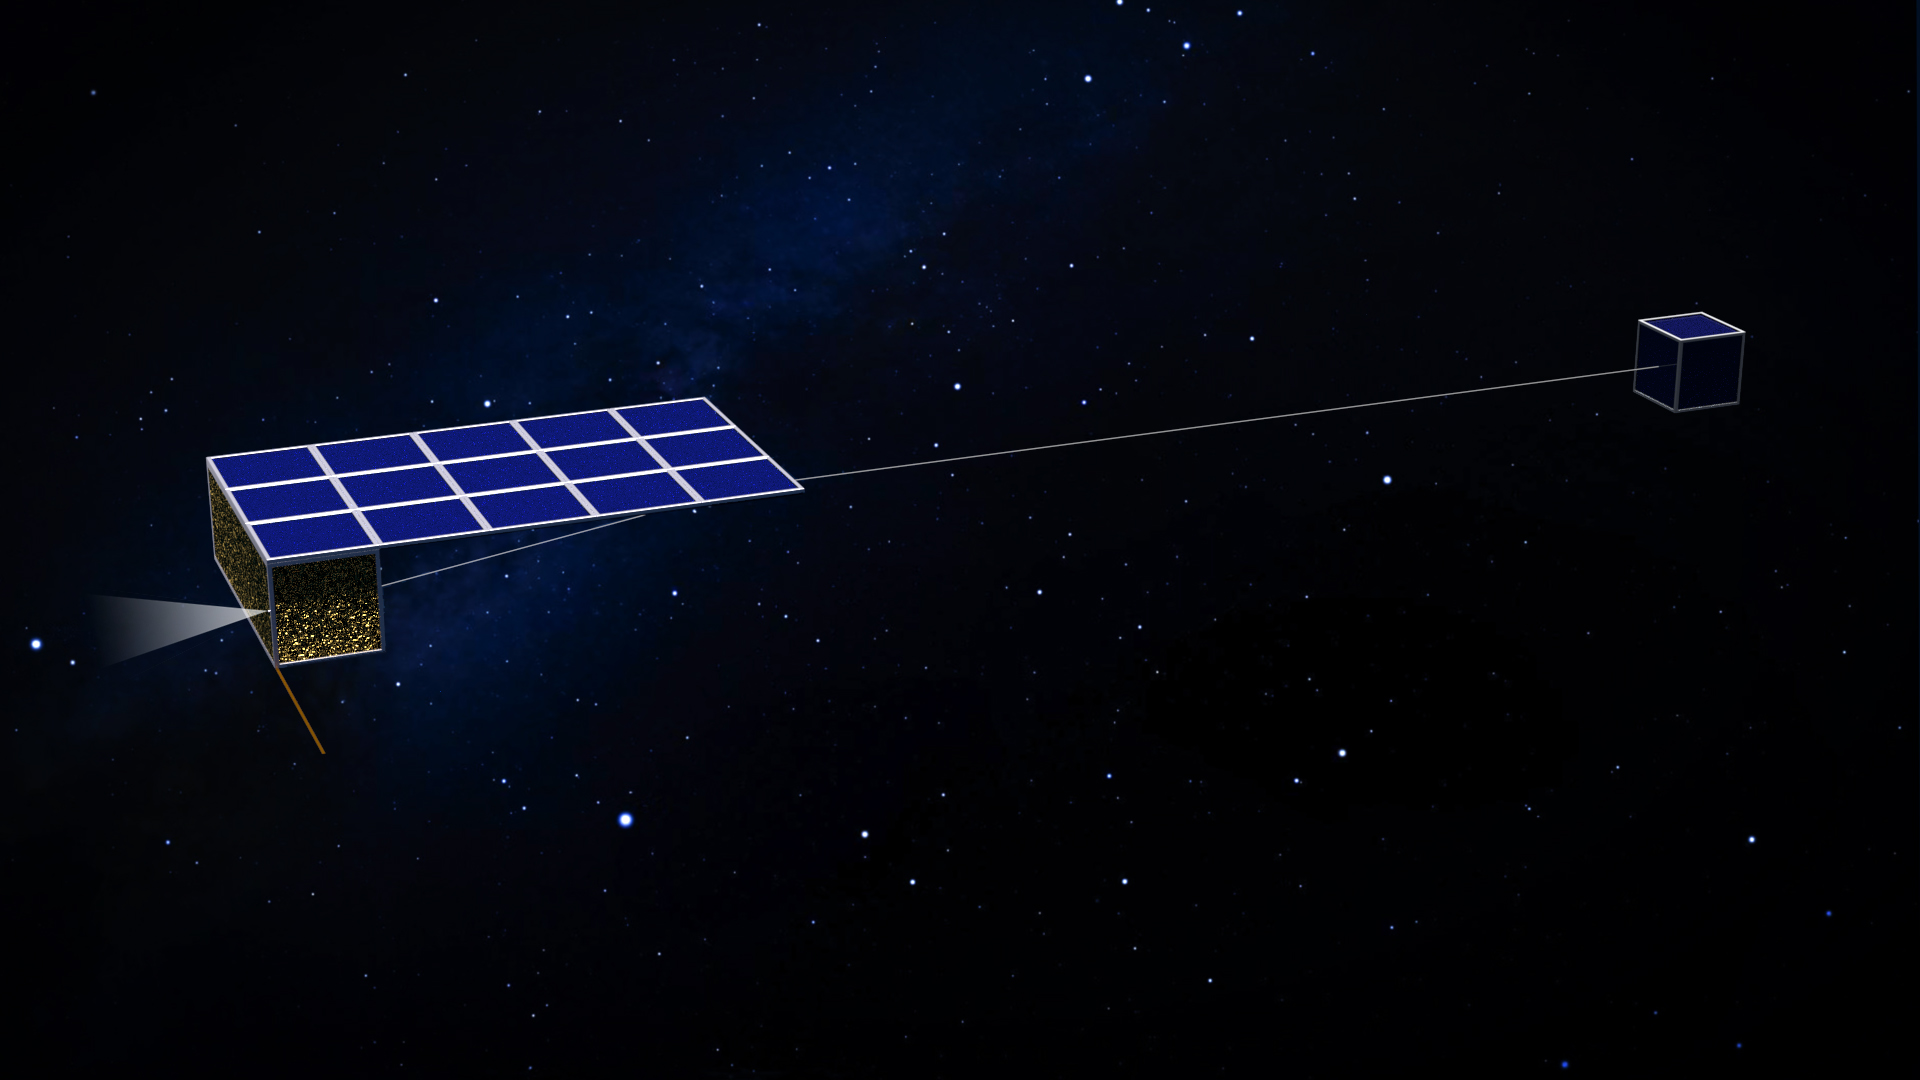
Artist’s concept of the spacecraft. Credit: FMI

The more that planetary astronomers study asteroids, they more they’re realizing just how varied and different they can be. Some, like 16 Psyche are made of solid nickel and iron, while others are made of rock. Some asteroids have been found with moons, rings, and some icy objects really blur the line between comet and asteroid. In order to truly understand their nature, it would take dozens or maybe hundreds of individual missions on the scale of Rosetta or New Horizons.

Or maybe not.

Asteroid 1998 QE2 and its moon

A team of researchers with the Finnish Meteorological Institute announced today that the best way to explore the varied objects in the asteroid belt would be with a fleet of tiny nanosatellites – 50 ought to do the trick to explore 300 separate asteroids, bringing the individual costs down to a few hundred thousand dollars per asteroid. During a presentation they made at the European Planetary Science Congress (EPSC) 2017 in Riga on Tuesday, the researchers showed how these tiny satellites could travel out to the asteroid belt, gather data on individual asteroids, and return to Earth to download their data.

The 50 satellites could be launched together in a single vehicle, and then separate once in space, or they could fill extra space in existing launches. The exact launch orbit doesn’t matter, as long as the spacecraft can get outside the Earth’s protective magnetosphere, where they can catch a ride on the solar wind.

Once in space, 5-kg spacecraft would deploy a 20 km-long wire tether that would catch the solar wind; the constantly flowing particles coming off the Sun, imparting a tiny thrust. This is known as an “E-sail” or electric sail. Unlike a solar sail, which depends on the momentum of photons coming from the Sun, electric sails harvest the momentum of charged protons.

Artist's illustration of the Heliopause Electrostatic Rapid Transit System.
Artist’s illustration of the Heliopause Electrostatic Rapid Transit System.

Researchers are still figuring out if this is an effective propulsion system for spacecraft. An Estonian prototype satellite was launched back in 2015, but its onboard motor failed to reel out its tether. The Finnish Aalto-1 satellite launched in June, 2017, and will test out a prototype electric sail in addition to several other experiments over the course of the next year. Even more advanced versions have been proposed, such as Heliopause Electrostatic Rapid Transit System (or HERTS), a mission which could reach 100 astronomical units in 10-15 years by deploying a huge electrified net in space.

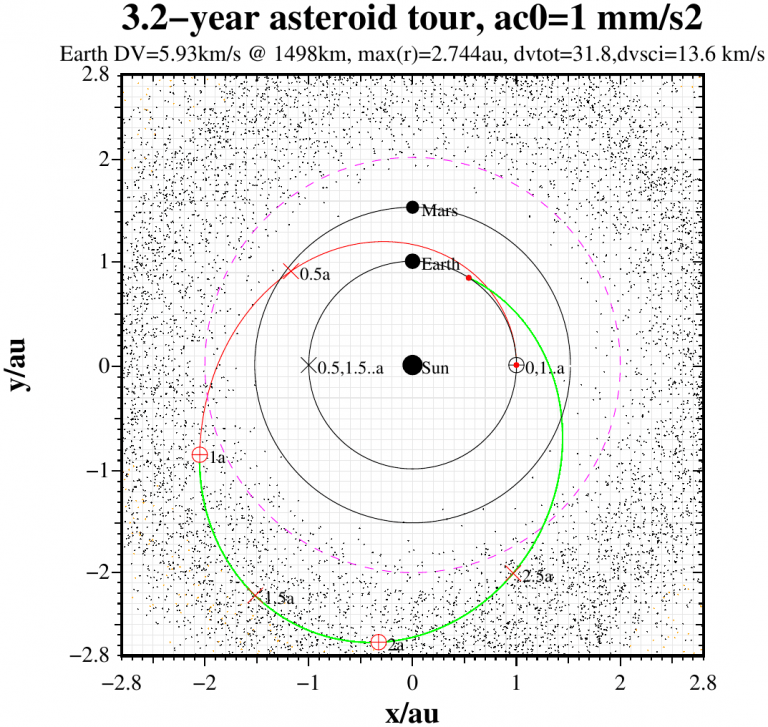
In the case of this asteroid mission, each satellite’s electric sail would only give it a change in velocity of only one millimeter per second, but over the course of a 3.2 year mission, it would allow the spacecraft to reach the asteroid belt and return to Earth.

Mission trajectory. The spacecraft would take 3.2 years to reach the asteroid belt and return.
In fact, the spacecraft would use their tethers to maneuver within the asteroid belt, flying past as many targets as they can with this minuscule thrust. Each satellite should be able to reach at least 6-7 numbers asteroids, and maybe even more smaller ones.

Each satellite would be equipped with a telescope with only a 40 mm aperture. That’s the size of a small spotting scope or half a pair of binoculars, but it would be enough to resolve features on the surface of an asteroid as large as 100 meters across from 1,000 km away. In addition to taking visual images of the asteroid targets, the spacecraft would be equipped with an infrared spectrometer to determine its meteorology.

Because the spacecraft are so small, they won’t be capable of carrying a transmitter to send their data back to Earth. Instead, they’d store all their scientific findings on a memory card, and then dump their data when their orbit brings them back close to Earth.

The researchers estimate that development of the mission would probably cost about 60 million Euros, or $70 million dollars, bringing the cost per asteroid down to about 200,000 Euros or $240,000.

Further Reading: Europlanet, Science Daily

New Study Says Primordial Asteroid Belt was Empty

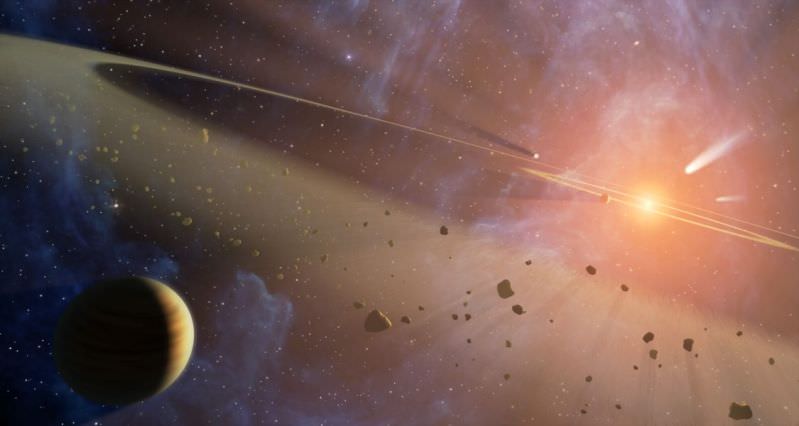
Artist concept of the asteroid belt. Credit: NASA

Between the orbits of Mars and Jupiter lies a disk of rocks, small bodies and planetoids known as the Main Asteroid Belt. The existence of this Belt was first theorized in the 18th century, based on observations that indicated a regular pattern in the orbits of Solar planets. By the following century, regular discoveries began to be made in the space between Mars and Jupiter, prompting astronomers to theorize where the Belt came from.

For a long time, scientists debated whether the Belt was the remains of a planet that broke up, or remnants left over from the early system that failed to become a planet. But a new study by a pair of astronomers from the University of Bordeaux has offered a different take. According to their theory, the Asteroid Belt began as an empty space which was gradually filled by rocks and debris over time.

For the sake of their study – which recently appeared in the journal Science Advances under the title “The Empty Primordial Asteroid Belt” – astronomers Sean N. Raymond and Andre Izidoro of the University of Bordeaux considered the current scientific consensus, which is that the Main Belt was once much more densely packed and became depleted of mass over time.

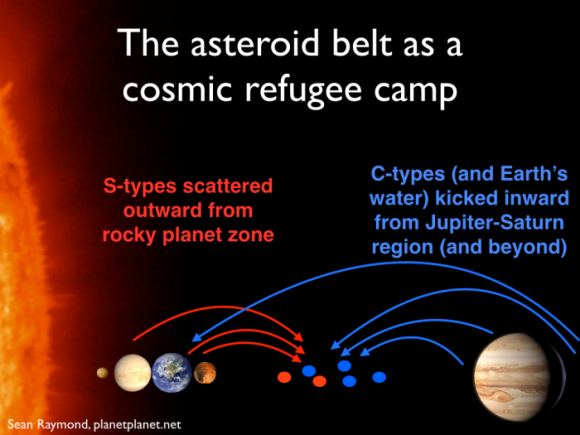
Artist’s impression of how the Asteroid Belt could have become filled with C-type and S-type asteroids over time. Credit: Sean Raymond/planetplanet.net

As Dr. Raymond explained to Universe Today via email:

“The standard picture is that the building blocks of the Solar System — what we call planetesimals, generally thought of as 10-100 km-scale bodies — started off in a smooth distribution across the Sun’s planet-forming disk. The problem is, that puts a couple of times Earth’s mass in the asteroid belt, where there is now less than a thousandth of an Earth mass. The challenge in this picture is therefore to understand how the belt lost 99.9% of its mass (but not 100%).”

To this, Dr. Raymond and Dr. Izodoro considered the alternate possibility that perhaps the primordial belt started as an empty space. In accordance with this theory, there were no planetesimals – i.e. Ceres, Vesta, Palla, and Hygeia – orbiting between Mars and Jupiter as there are today. This began as a thought experiment which, as Dr. Raymond admits, sounded a bit crazy at first.

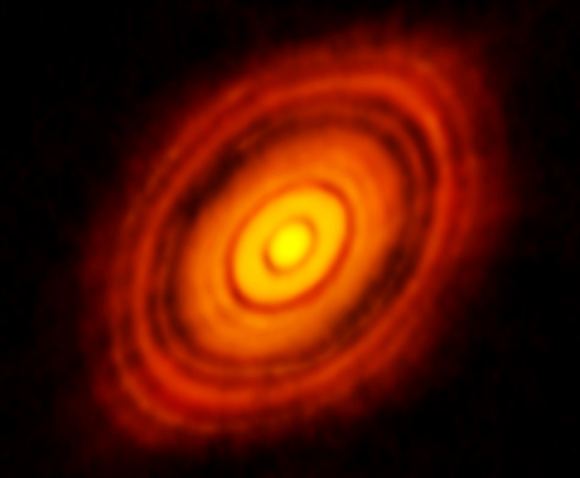
However, he and Dr. Izodoro soon realized that several protoplanetary disks like the one they were envisioning had already been discovered in other star systems. For example, in 2014, the Atacama Large Millimeter/submillimeter Array in Chile photographed a planet-forming disk of dust and gas (aka, a protoplanetary disk) in the HL Tauri system, a very young star located about 450 light years away in the Taurus constellation.

As the image (shown below) revealed, the dust in this disk is not smooth, but consists of several broad regions and less dense regions. “The exact explanation for the structure in this disk is still debated but pretty much all models invoke drifting dust,” said Raymond. “And planetesimals form when drifting dust piles up into sufficiently-dense rings. So, dust rings should (we think) produce rings of planetesimals.”

Image of the HL Tau planet-forming disk taken with the Atacama Large Millimeter Array. Credit: ALMA (ESO/NAOJ/NRAO)

To test this hypothesis, they constructed a model of the early Solar System which included an empty Main Belt region. As they moved the simulation forward, they found that the formation of the disk was related to the formation of the rocky planets, and would gradually become what we see today. As Raymond indicated:

“What we found is that the growth of the rocky planets is not 100% efficient. A fraction of planetesimals is gravitationally kicked outward and stranded in the asteroid belt. The orbits of captured bodies matches closely those of S-type asteroids. The efficiency of implanting S-types in the belt is quite low, only about 1 in 1000.  However, recall that the belt is almost empty.  There is a total of about 4 hundred-thousandths of an Earth-mass in S-types in the present-day belt.  Our simulations typically implanted a few times that amount. Given that some are lost during later evolution of the Solar System, this matches both the distribution and amount of S-type asteroids in the belt.

They then combined this model with previous work which looked at the growth of Jupiter and Saturn and how this would effect the Solar System. In this study, they showed the C-type asteroids would be deposited in the Belt over time, and that these asteroids would also be responsible for delivering water to Earth. When they combined the distribution of implanted C-type and S-type asteroids with their current work, they found that it matched the present-day distribution of asteroids.

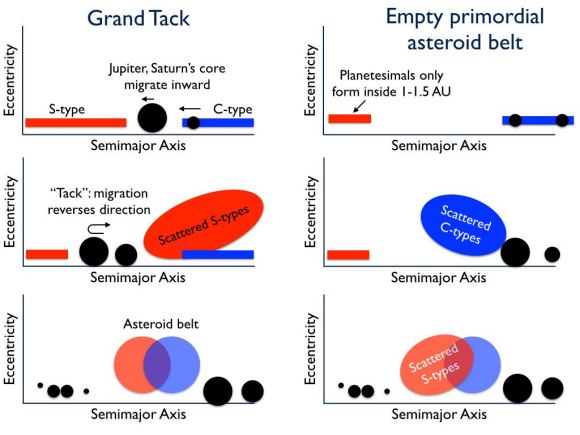
Interestingly enough, this is not the first theory Raymond and Izodoro have come up with to address the Asteroid Belt’s missing mass. Back in 2011, Raymond was a co-author on the study that proposed the Grand Tack model, in which he and his colleagues proposed that Jupiter migrated from its original orbit after it formed. At first, the planet moved closer to Mars’ current orbit, then back out towards where it is today.

Diagram comparing two possible explanations for how the Asteroid Belt formed. Credit: Sean Raymond/planetplanet.net

In the process, the asteroid belt would have been cleared, and Mars would have been deprived of mass, thus leading to its diminutive size – relative to Earth and Venus. This resolved a key problem with classical theories of Asteroid Belt formation, which was known as the “small Mars problem”. In short, all previous simulations of Solar planet formation tended to produce Mars analogs that were far more massive than Mars is today.

However, the Grand Tack hypothesis still contained theoretical uncertainties, which prompted Raymond and Izodoro to consider the the Empty Primordial Belt theory. “Our new result lends credence to an alternate model in which planetesimals never formed in the asteroid belt at all,” he said. “Different pieces of this new alternative model have been developed in recent years, and I think they add up to make a solid alternative to the Grand Tack model.”

Looking ahead, Raymond says that he and Izodoro hope to conduct further studies and simulations to see if either theory can be confirmed or falsified. “That’s the next step,” he said. “Until the next (seemingly-)crazy idea!”

Further Reading: Science Advances, PlanetPlanet

Dawn Probe Finds Evidence of Subsurface Ice on Vesta

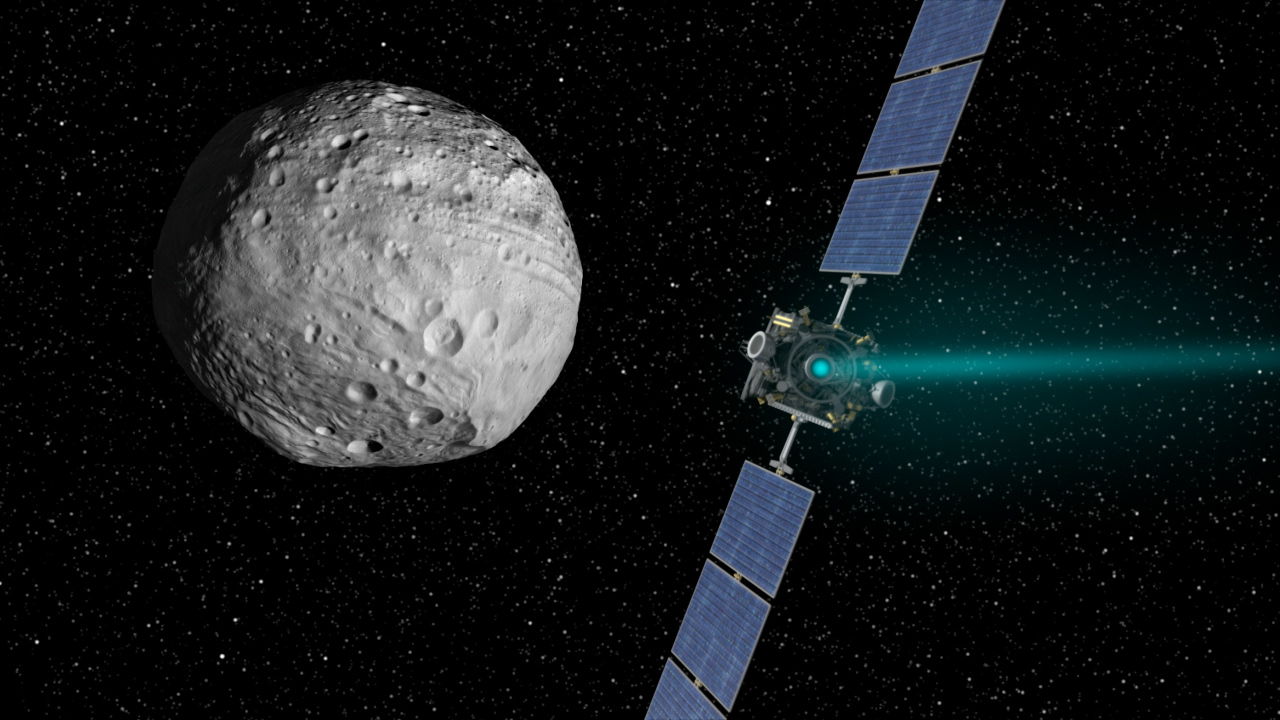
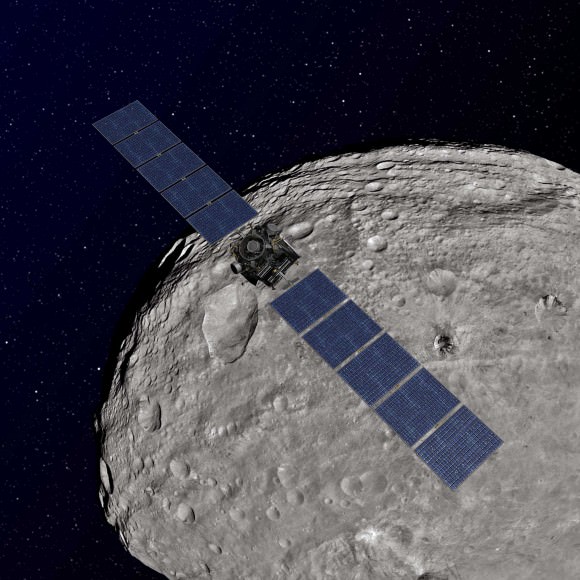
Artist's concept of the Dawn spacecraft arriving at Vesta. Image credit: NASA/JPL-Caltech

In 2011, NASA’s Dawn spacecraft established orbit around the large asteroid (aka. planetoid) known as Vesta. Over the course of the next 14 months, the probe conducted detailed studies of Vesta’s surface with its suite of scientific instruments. These findings revealed much about the planetoid’s history, its surface features, and its structure – which is believed to be differentiated, like the rocky planets.

In addition, the probe collected vital information on Vesta’s ice content. After spending the past three years sifting through the probe’s data, a team of scientists has produced a new study that indicates the possibility of subsurface ice. These findings could have implications when it comes to our understanding of how Solar bodies formed and how water was historically transported throughout the Solar System.

Their study, titled “Orbital Bistatic Radar Observations of Asteroid Vesta by the Dawn Mission“, was recently published in the scientific journal Nature Communications. Led by Elizabeth Palmer, a graduate student from Western Michigan University, the team relied on data obtained by the communications antenna aboard the Dawn spacecraft to conduct the first orbital bistatic radar (BSR) observation of Vesta.

Artist rendition of Dawn spacecraft orbiting Vesta. Credit: NASA/JPL-Caltech

This antenna – the High-Gain telecommunications Antenna (HGA) – transmitted X-band radio waves during its orbit of Vesta to the Deep Space Network (DSN) antenna on Earth. During the majority of the mission, Dawn’s orbit was designed to ensure that the HGA was in the line of sight with ground stations on Earth. However, during occultations – when the probe passed behind Vesta for 5 to 33 minutes at a time – the probe was out of this line of sight.

Nevertheless, the antenna was continuously transmitting telemetry data, which caused the HGA-transmitted radar waves to be reflected off of Vesta’s surface. This technique, known as bistatic radar (BSR) observations has been used in the past to study the surfaces of terrestrial bodies like Mercury, Venus, the Moon, Mars, Saturn’s moon Titan, and the comet 67P/CG.

But as Palmer explained, using this technique to study a body like Vesta was a first for astronomers:

“This is the first time that a bistatic radar experiment was conducted in orbit around a small body, so this brought several unique challenges compared to the same experiment being done at large bodies like the Moon or Mars. For example, because the gravity field around Vesta is much weaker than Mars, the Dawn spacecraft does not have to orbit at a very high speed to maintain its distance from the surface. The orbital speed of the spacecraft becomes important, though, because the faster the orbit, the more the frequency of the ‘surface echo’ gets changed (Doppler shifted) compared to the frequency of the ‘direct signal’ (which is the unimpeded radio signal that travels directly from Dawn’s HGA to Earth’s Deep Space Network antennas without grazing Vesta’s surface). Researchers can tell the difference between a ‘surface echo’ and the ‘direct signal’ by their difference in frequency—so with Dawn’s slower orbital speed around Vesta, this frequency difference was very small, and required more time for us to process the BSR data and isolate the ‘surface echoes’ to measure their strength.”

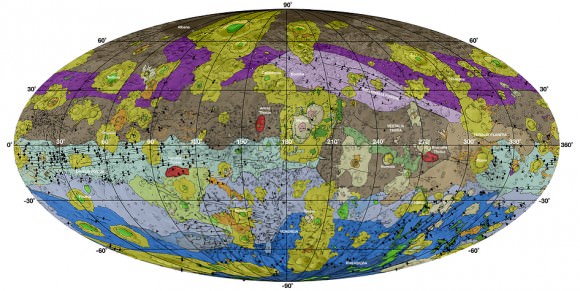
This high-res geological map of Vesta is derived from Dawn spacecraft data. Brown colors represent the oldest, most heavily cratered surface. Credit: NASA/JPL-Caltech/ASU

By studying the reflected BSR waves, Palmer and her team were able to gain valuable information from Vesta’s surface. From this, they observed significant differences in surface radar reflectivity. But unlike the Moon, these variations in surface roughness could not be explained by cratering alone and was likely due to the existence of ground-ice. As Palmer explained:

“We found that this was the result of differences in the roughness of the surface at the scale of a few inches.  Stronger surface echoes indicate smoother surfaces, while weaker surface echoes have bounced off of rougher surfaces. When we compared our surface roughness map of Vesta with a map of subsurface hydrogen concentrations—which was measured by Dawn scientists using the Gamma Ray and Neutron Detector (GRaND) on the spacecraft—we found that extensive smoother areas overlapped areas that also had heightened hydrogen concentrations!”

In the end, Palmer and her colleagues concluded that the presence of buried ice (past and/or present) on Vesta was responsible for parts of the surface being smoother than others. Basically, whenever an impact happened on the surface, it transferred a great deal of energy to the subsurface. If buried ice was present there, it would be melted by the impact event, flow to the surface along impact-generated fractures, and then freeze in place.

Much in the same way that moon’s like Europa, Ganymede and Titania experience surface renewal because of the way cryovolcanism causes liquid water to reach the surface (where it refreezes), the presence of subsurface ice would cause parts of Vesta’ surface to be smoothed out over time. This would ultimately lead to the kinds of uneven terrain that Palmer and her colleagues witnessed.

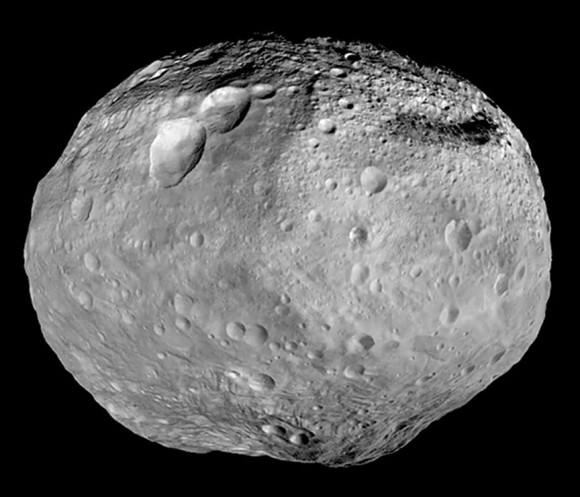
The planetoid Vesta, which was studied by the Dawn probe between July 2011 and September 2012. Credit: NASA

This theory is supported by the large concentrations of hydrogen that were detected over smoother terrains that measure hundreds of square kilometers. It is also consistent with geomorphological evidence obtained from the Dawn Framing Camera images, which showed signs of of transient water flow over Vesta’s surface. This study also contradicted some previously-held assumptions about Vesta.

As Palmer noted, this could also have implications as far as our understanding of the history and evolution of the Solar System is concerned:

Asteroid Vesta was expected to have depleted any water content long ago through global melting, differentiation, and extensive regolith gardening by impacts from smaller bodies. However, our findings support the idea that buried ice may have existed on Vesta, which is an exciting prospect since Vesta is a protoplanet that represents an early stage in the formation of a planet. The more we learn about where water-ice exists throughout the Solar System, the better we will understand how water was delivered to Earth, and how much was intrinsic to Earth’s interior during the early stages of its formation.”

This work was sponsored by NASA’s Planetary Geology and Geophysics program, a JPL-based effort that focuses on fostering the research of terrestrial-like planets and major satellites in the Solar System. The work was also conducted with the assistance of the USC’s Viterbi School of Engineering as part of an ongoing effort to improve radar and microwave imaging to locate subsurface sources of water on planets and other bodies.

Further Reading: USC, Nature Communications

Northrop Grumman Acquires Orbital ATK for $9.2 Billion

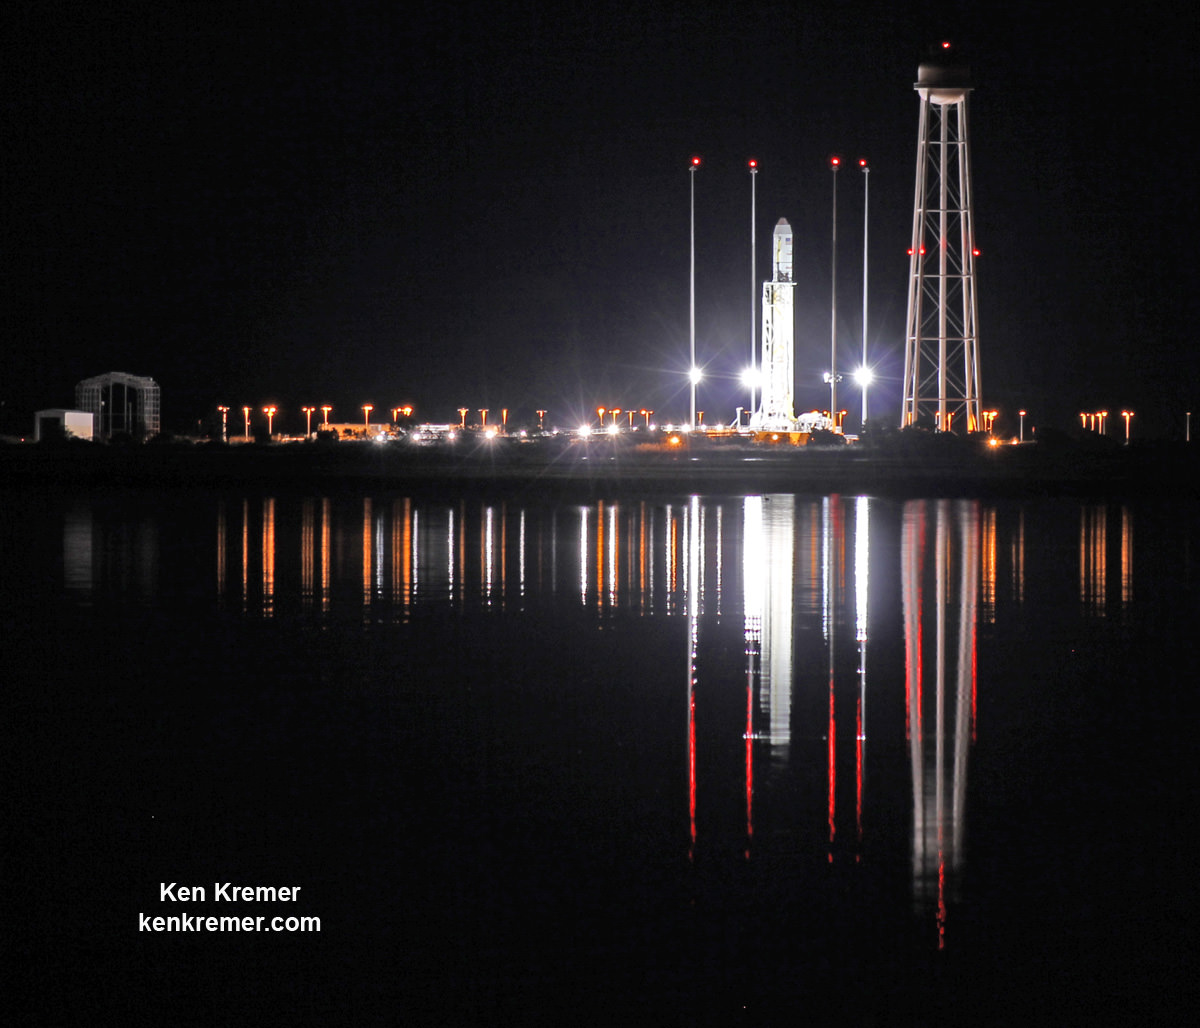
Antares rocket stands erect, reflecting off the calm waters the night before a launch from NASA’s Wallops Flight Facility, VA, on Oct. 28, 2014. Credit: Ken Kremer/kenkremer.com
Orbital ATK Antares rocket stands erect, reflecting off the calm waters the night before a launch from NASA’s Wallops Flight Facility, VA, on Oct. 28, 2014. Credit: Ken Kremer/kenkremer.com

Aerospace giant Northrop Grumman will acquire Orbital ATK for approximately $9.2 billion, in a deal the companies announced Monday and they say will “expand capability” is largely “complementary” and involves “little overlap.”

Orbital ATK specializes in a wide variety of launch vehicles, satellites, missiles and munitions that Northrop believes will significantly enhance capabilities it lacks while offering Orbital significantly more technical and financial resources to grow sales and business opportunities.

Under the terms of the huge deal West Falls Church, Virginia based Northrop will dole out approximately $7.8 billion in cash to buy Dulles, Virginia based Orbital ATK and assume $1.4 billion in net debt. Orbital ATK shareholders will receive all-cash consideration of $134.50 per share, which is about a 20% premium above the stock’s price of $110 per share at the close of trading Friday, Sept. 15.

Rumors of the deal first appeared on Sunday.

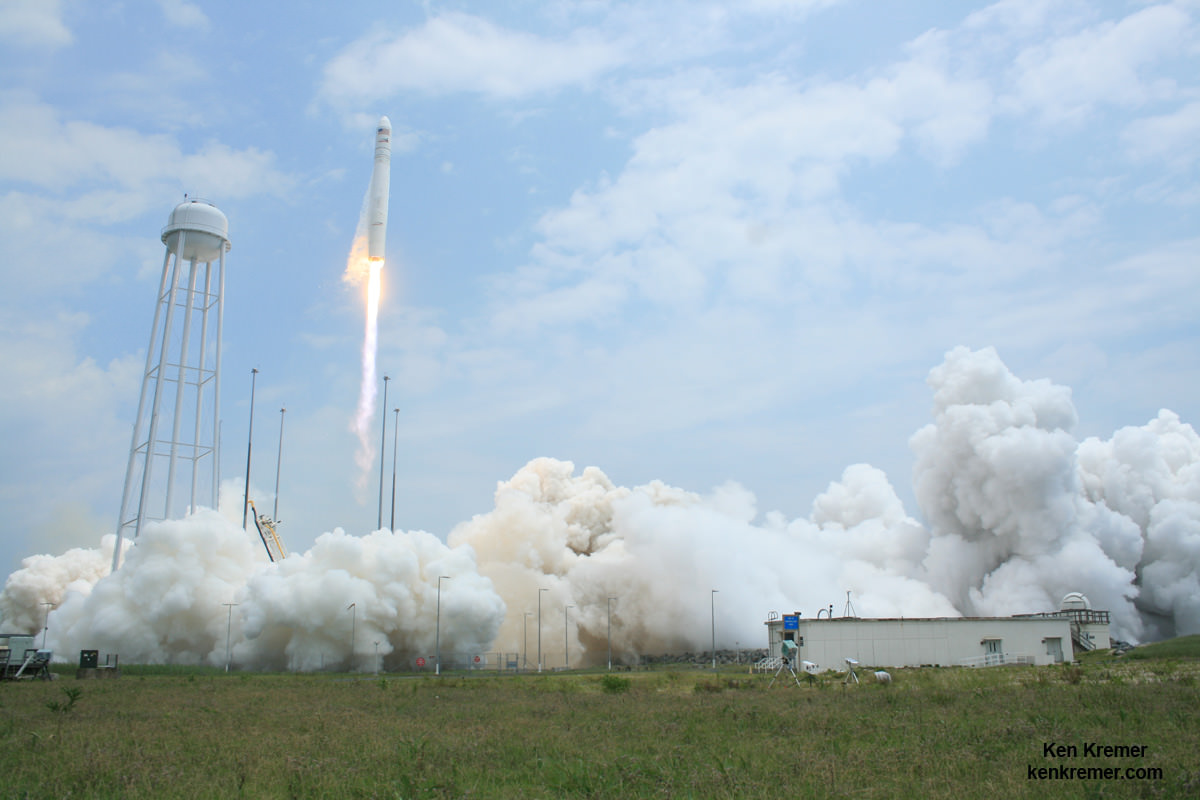
Orbital Sciences Corporation Antares rocket and Cygnus spacecraft blasts off on July 13 2014 from Launch Pad 0A at NASA Wallops Flight Facility , VA, on the Orb-2 mission and loaded with over 3000 pounds of science experiments and supplies for the crew aboard the International Space Station. Credit: Ken Kremer – kenkremer.com

The final purchase is expected to take place around mid-2018, subject to approval by government regulators and Orbital ATK shareholders.

The Boards of Directors of both companies have already given unanimous approval to the mega buyout.

“Our two companies represent a very complementary fit,” Wes Bush, chief executive officer and president of Northrop Grumman said in a conference call on Monday, Sept. 18.

“We have very little overlap, and we fully expect our combined portfolios of leading technologies, along with our aligned and innovation-focused cultures, to yield significant value creation through revenue, cost and operational synergies, accelerating our profitable growth trajectory.”

Northrop indicated that Orbital ATK will operate as a separate fourth unit – at least initially – and that Orbital programs will benefit from the increased financial resources available from Northrup.

“Upon completion of the acquisition, Northrop Grumman plans to establish Orbital ATK as a new, fourth business sector to ensure a strong focus on operating performance and a smooth transition into Northrop Grumman.”

For his part Orbital ATK CEO David Thompson was very pleased with the buyout and future opportunities.

“The agreement reflects the tremendous value that Orbital ATK has created for our customers, our shareholders and our employees,” David Thompson, Orbital ATK president and chief executive officer said at the conference call.

“The combination will allow our team as a new business sector within Northrop Grumman to maintain strong operational performance on existing customer programs and to pursue new opportunities that require greater technical and financial resources than we currently possess.”

“Our collective customers should benefit from the expanded capabilities for innovation, increased speed of delivery and improved affordability of production resulting from the combination.”

“The combination of our companies and human capital will also significantly benefit our customers,” Bush elaborated. “Together, we can offer our customers enhanced mission capabilities and more competitive offerings in areas such as space, missiles and strategic deterrents.

“Our shareholders can expect revenue synergies from these new business opportunities.”

Northrop Grumman sales for 2017 amount to about $25 billion vs. about $4.5 billion for Orbital ATK
Orbital ATK itself is the product of a very recent merger in 2015 of Orbital Sciences and ATK.

The company employs over 13,000 people including over 4,200 scientists and engineers. It holds a heft backlog of contracts worth more than $15 billion.

Northrop Grumman employs over 68,000 people and is the fifth largest defense contractor.

“The agreement will also provide expanded career options for our employees as part of a larger, more diverse aerospace and defense company,” said Thompson.

It will also benefit stockholders.

“The transaction represents a truly compelling financial proposition for our shareholders, valuing the enterprise at about $9.2 billion and providing our investors with more than 120% total return over the 3-year period from the completion of the Orbital ATK merger in early 2015 to the expected closing in the first half of 2018.”

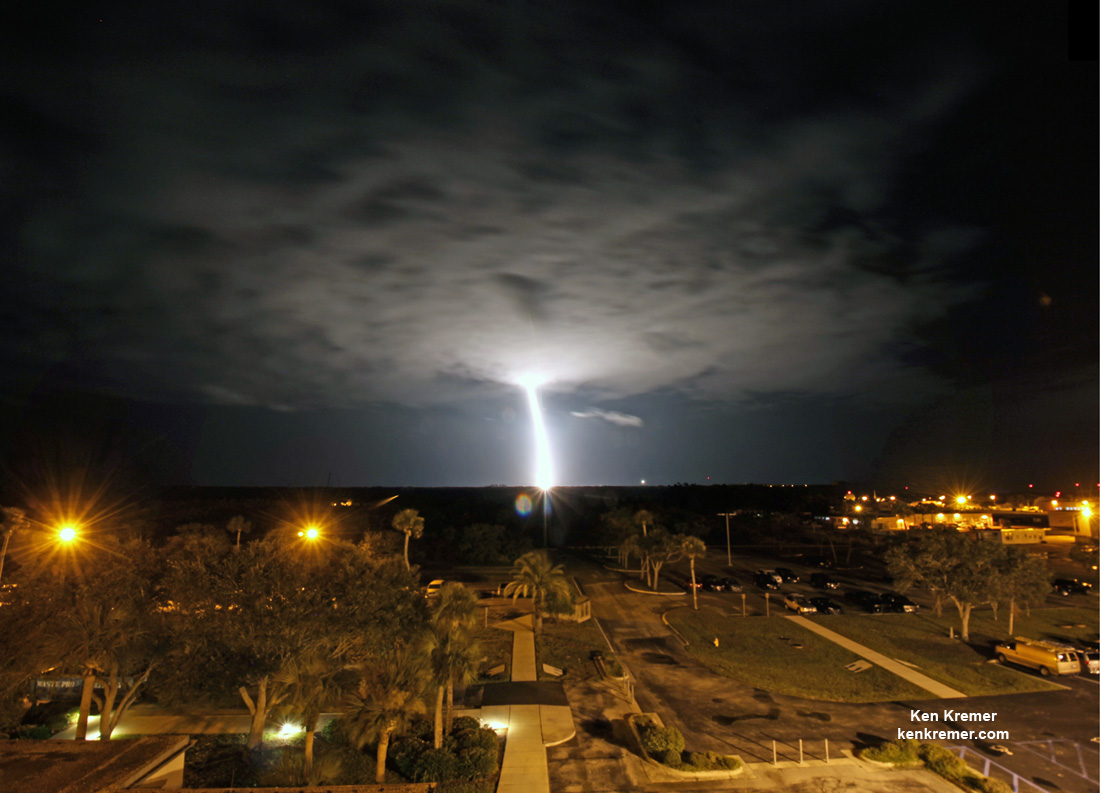
Orbital ATK Minotaur IV rocket streaks to orbit through low hanging clouds that instantly illuminate as the booster engines flames pass through. This first Minotaur launch from the Cape carried the ORS-5 satellite tracker to equatorial orbit for the U.S. Air Force at 2:04 a.m. EDT on August 26, 2017 from Cape Canaveral Air Force Station in Florida. Credit: Ken Kremer/kenkremer.com

Orbital ATK launchers run the gamut from small to medium to large.

The rockets include the massive solid rocket boosters for NASA’s Space Launch System (SLS) heavy lift rocket under development, the Antares liquid fueled booster used to launch Cygnus cargo freighters to the International Space Station for NASA, the Minotaur family of medium class solid rocket launchers, as well as sounding rockets for a variety of low weight science missions.

The most recent Orbital ATK launch took place on Aug. 26 when a Minotaur 4 rocket (a retired Peacekeeper ICBM) lifted off from Cape Canaveral with a USAF surveillance satellite.

Orbital ATK also has a thriving satellite manufacturing business building NASA science, commercial, government and military satellites.

Northrop Grumman is the prime contractor for NASA’s James Webb Space Telescope and designed the optics and spacecraft bus under contract for NASA’s Goddard Space Flight Center in Greenbelt, Maryland.

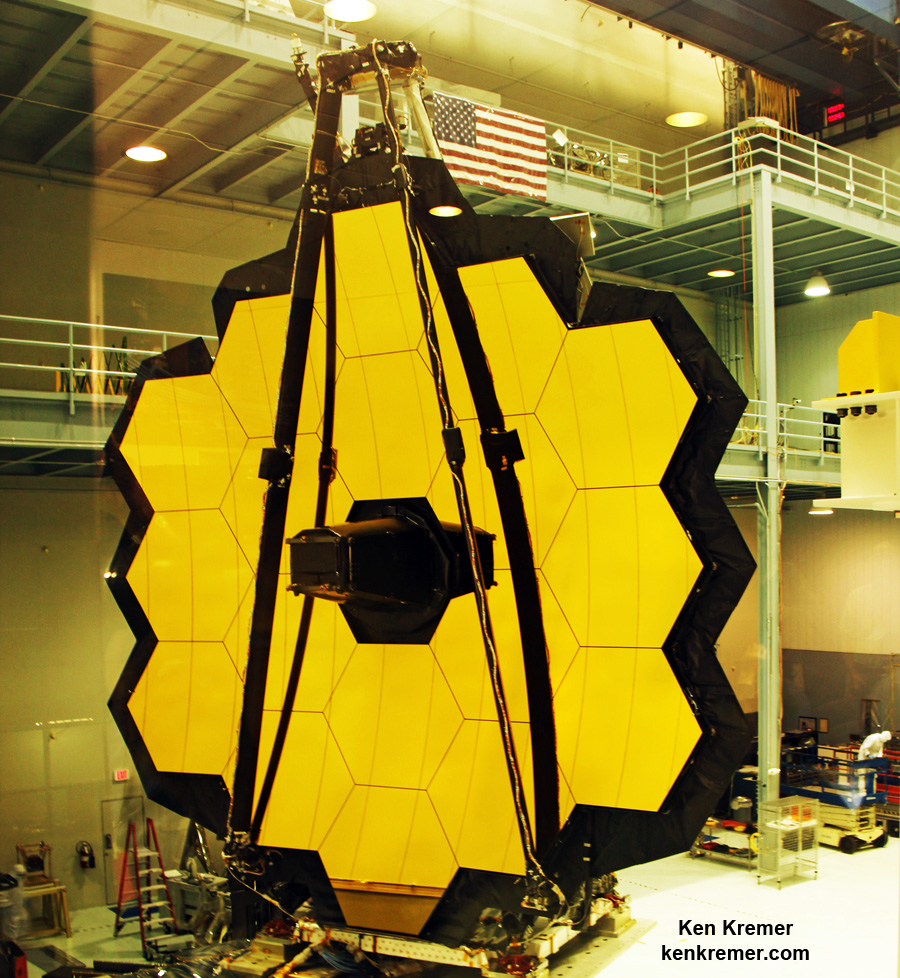
The 18-segment gold coated primary mirror of NASA’s James Webb Space Telescope is raised into vertical alignment in the largest clean room at the agency’s Goddard Space Flight Center in Greenbelt, Maryland, on Nov. 2, 2016. The secondary mirror mount booms are folded down into stowed for launch configuration. Credit: Ken Kremer/kenkremer.com

The purchase is also estimated to result in $150 million in annual cost savings by 2020.

“We believe that this combination represents a compelling value creation opportunity for the customers, shareholders and employees of both our companies,” stated Bush. “Through our combination, all of our stakeholders will benefit from expanded capabilities, accelerated innovation and greater competitiveness in critical global security domains.”

Watch for Ken’s continuing onsite NASA mission and launch reports direct from the Kennedy Space Center, and Cape Canaveral Air Force Station, Florida, and NASA Wallops Flight Facility, Va.

Stay tuned here for Ken’s continuing Earth and Planetary science and human spaceflight news.

Ken Kremer

The Orbital ATK Antares rocket, with the Cygnus OA-5 spacecraft onboard, is raised into the vertical position on launch Pad-0A for planned launch on Oct. 17, 2016, at NASA’s Wallops Flight Facility in Virginia. Credit: Ken Kremer/kenkremer

Venus Express Probe Reveals the Planet’s Mysterious Night Side

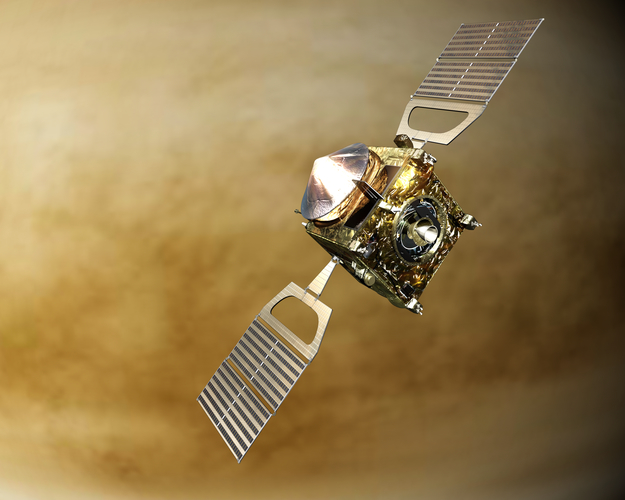
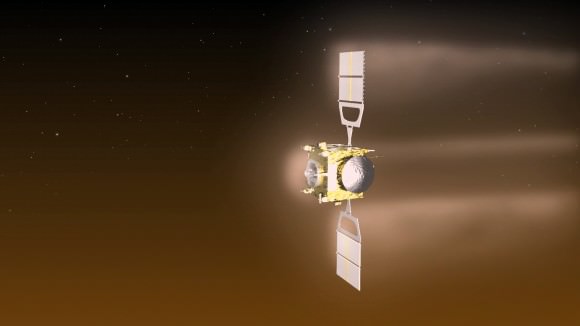
Artist's impression of the Venus Express spacecraft in orbit around Venus. Credit: ESA

Venus’ atmosphere is as mysterious as it is dense and scorching. For generations, scientists have sought to study it using ground-based telescopes, orbital missions, and the occasional atmospheric probe. And in 2006, the ESA’s Venus Express mission became the first probe to conduct long-term observations of the planet’s atmosphere, which revealed much about its dynamics.

Using this data, a team of international scientists – led by researchers from the Japan Aerospace and Exploration Agency (JAXA) – recently conducted a study that characterized the wind and upper cloud patterns on the night side of Venus. In addition to being the first of its kind, this study also revealed that the atmosphere behaves differently on the night side, which was unexpected.

The study, titled “Stationary Waves and Slowly Moving Features in the Night Upper Clouds of Venus“, recently appeared in the scientific journal Nature Astronomy. Led by Javier Peralta, the International Top Young Fellow of JAXA, the team consulted data obtained by Venus Express’ suite of scientific instruments in order to study the planet’s previously-unseen cloud types, morphologies, and dynamics.

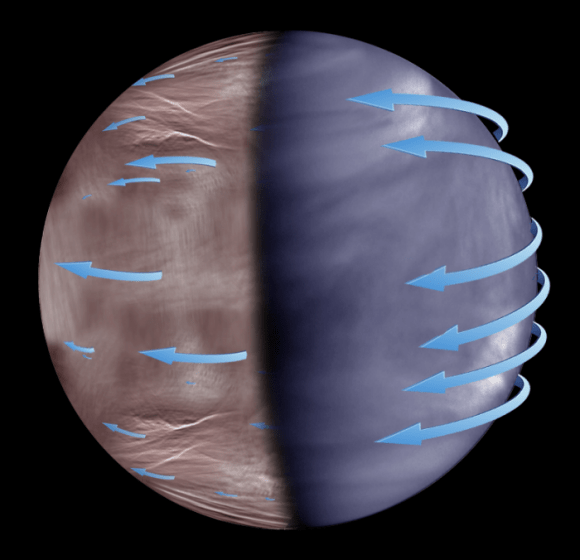
The atmospheric super-rotation at the upper clouds of Venus. While the super-rotation is present in both day and night sides of Venus, it seems more uniform in the day. Credits: JAXA, ESA, J. Peralta and R. Hueso.

Whereas plenty of studies have been conducted of Venus’ atmosphere from soace, this was the first time that a study was not focused on the dayside of the planet. As Dr. Peralta explained in an ESA press statement:

This is the first time we’ve been able to characterize how the atmosphere circulates on the night side of Venus on a global scale. While the atmospheric circulation on the planet’s dayside has been extensively explored, there was still much to discover about the night side. We found that the cloud patterns there are different to those on the dayside, and influenced by Venus’ topography.

Since the 1960s, astronomers have been aware that Venus’ atmosphere behaves much differently that those of other terrestrial planets. Whereas Earth and Mars have atmospheres that co-rotate at approximately the same speed as the planet, Venus’ atmosphere can reach speeds of more than 360 km/h (224 mph). So while the planet takes 243 days to rotate once on its axis, the atmosphere takes only 4 days.

This phenomena, known as “super-rotation”, essentially means that the atmosphere moves over 60 times faster than the planet itself. In addition, measurements in the past have shown that the fastest clouds are located at the upper cloud level, 65 to 72 km (40 to 45 mi) above the surface. Despite decades of study, atmospheric models have been unable to reproduce super-rotation, which indicated that some of the mechanics were unknown.

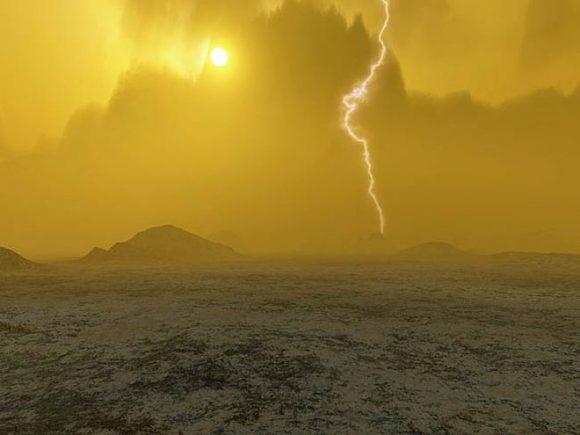
Artist’s impression of the atmosphere of Venus, showing its lightning storms and a volcano in the distance. Credit and ©: European Space Agency/J. Whatmore

As such, Peralta and his international team – which included researchers from the Universidad del País Vasco in Spain, the University of Tokyo, the Kyoto Sangyo University, the Center for Astronomy and Astrophysics (ZAA) at Berlin Technical University, and the Institute of Astrophysics and Space Planetology in Rome – chose to look at the unexplored side to see what they could find. As he described it:

“We focused on the night side because it had been poorly explored; we can see the upper clouds on the planet’s night side via their thermal emission, but it’s been difficult to observe them properly because the contrast in our infrared images was too low to pick up enough detail.”

This consisted of observing Venus’ night side clouds with the probe’s Visible and Infrared Thermal Imaging Spectrometer (VIRTIS). The instrument gathered hundreds of images simultaneously and different wavelengths, which the team then combined to improve the visibility of the clouds. This allowed the team to see them properly for the first time, and also revealed some unexpected things about Venus’ night side atmosphere.

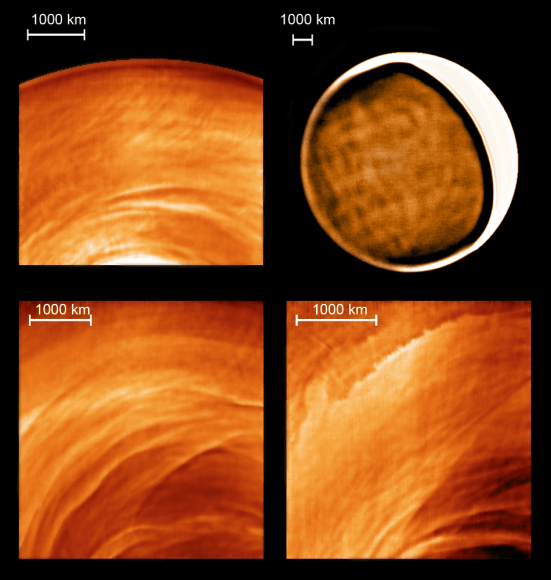
What they saw was that atmospheric rotation appeared to be more chaotic on the night side than what has been observed in the past on the dayside. The upper clouds also formed different shapes and morphologies – i.e. large, wavy, patchy, irregular and filament-like patterns  – and were dominated by stationary waves, where two waves moving in opposite directions cancel each other out and create a static weather pattern.

Examples of new types of cloud morphology discovered on the night side of Venus thanks to Venus Express (ESA) and the infrared telescope IRTF (NASA). Credits: ESA/NASA/J. Peralta and R. Hueso.

The 3D properties of these stationary waves were also obtained by combining VIRTIS data with radio-science data from the Venus Radio Science experiment (VeRa). Naturally, the team was surprised to find these kinds of atmospheric behaviors since they were inconsistent with what has been routinely observed on the dayside. Moreover, they contradict the best models for explaining the dynamics of Venus’ atmosphere.

Known as Global Circulation Models (GCMs), these models predict that on Venus, super-rotation would occur in much the same way on both the dayside and the night side. What’s more, they noticed that stationary waves on the night side appeared to coincide with high-elevation features. As Agustin Sánchez-Lavega, a researcher from the University del País Vasco and a co-author on the paper, explained:

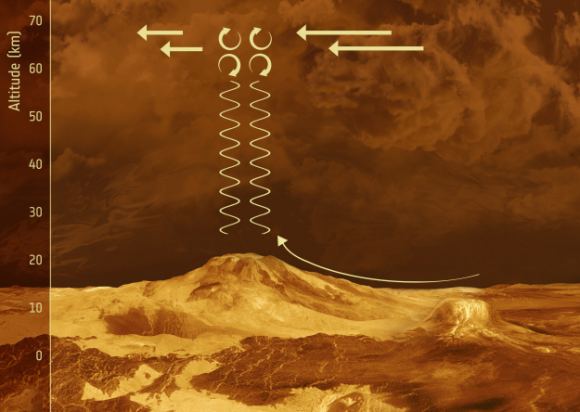
Stationary waves are probably what we’d call gravity waves–in other words, rising waves generated lower in Venus’ atmosphere that appear not to move with the planet’s rotation. These waves are concentrated over steep, mountainous areas of Venus; this suggests that the planet’s topography is affecting what happens way up above in the clouds.

This is not the first time that scientists have spotted a possible link between Venus’ topography and its atmospheric motion. Last year, a team of European astronomers produced a study that showed how weather patterns and rising waves on the dayside appeared to be directly connected to topographical features. These findings were based on UV images taken by the Venus Monitoring Camera (VMC) on board the Venus Express.

Schematic illustration of the proposed behaviour of gravity waves in the vicinity of mountainous terrain on Venus. Credit: ESA

Finding something similar happening on the night side was something of a surprise, until they realized they weren’t the only ones to spot them. As Peralta indicated:

It was an exciting moment when we realized that some of the cloud features in the VIRTIS images didn’t move along with the atmosphere. We had a long debate about whether the results were real–until we realised that another team, led by co-author Dr. Kouyama, had also independently discovered stationary clouds on the night side using NASA’s Infrared Telescope Facility (IRTF) in Hawaii! Our findings were confirmed when JAXA’s Akatsuki spacecraft was inserted into orbit around Venus and immediately spotted the biggest stationary wave ever observed in the Solar System on Venus’ dayside.

These findings also challenge existing models of stationary waves, which are expected to form from the interaction of surface wind and high-elevation surface features. However, previous measurements conducted by the Soviet-era Venera landers have indicated that surface winds might too weak for this to happen on Venus. In addition, the southern hemisphere, which the team observed for their study, is quite low in elevation.

And as Ricardo Hueso of the University of the Basque Country (and a co-author on the paper) indicated, they did not detect corresponding stationary waves in the lower cloud levels. “We expected to find these waves in the lower levels because we see them in the upper levels, and we thought that they rose up through the cloud from the surface,” he said. “It’s an unexpected result for sure, and we’ll all need to revisit our models of Venus to explore its meaning.”

Artist’s impression of Venus Express performing aerobreaking maneuvers in the planet’s atmosphere in June and July 2014. Credit: ESA–C. Carreau

From this information, it seems that topography and elevation are linked when it comes to Venus’ atmospheric behavior, but not consistently. So the standing waves observed on Venus’ night side may be the result of some other undetected mechanism at work. Alas, it seems that Venus’ atmosphere – in particular, the key aspect of super-rotation – still has some mysteries for us.

The study also demonstrated the effectiveness of combining data from multiple sources to get a more detailed picture of a planet’s dynamics. With further improvements in instrumentation and data-sharing (and perhaps another mission or two to the surface) we can expect to get a clearer picture of what is powering Venus’ atmospheric dynamics before long.

With a little luck, there may yet come a day when we can model the atmosphere of Venus and predict its weather patterns as accurately as we do those of Earth.

Further Reading: ESA, Nature Astronomy

Study of Martian Sedimentary Layers Reveals More About the Planet’s Past

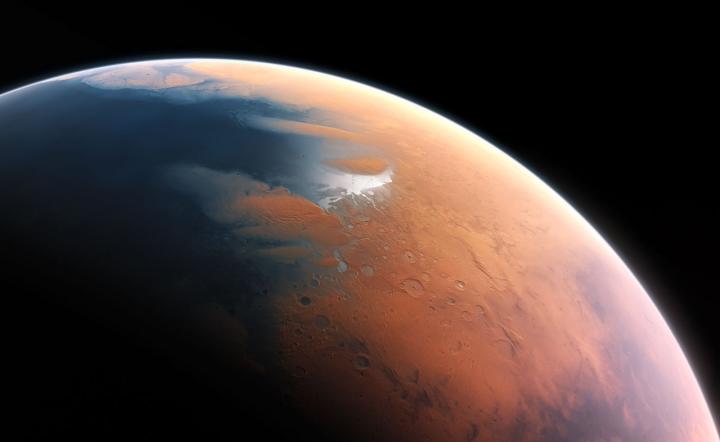
An artist’s impression of what Mars might have looked like with water. Credit: ESO/M. Kornmesser

As of 2016, Mars became the permanent residence of no less than eight robotic missions, a combination of orbiters, rovers and landers. Between extensive studies of the Martian atmosphere and surface, scientists have learned a great deal about the planet’s history and evolution. In particular, they have uncovered voluminous amounts of evidence that Mars once had flowing water on its surface.

The most recent evidence to this effect from the University of Texas at Austin, where researchers have produced a study detailing how water deposited sediment in Mars’ Aeolis Dorsa region. According to their research, this area contains extensive sedimentary deposits that act as a historical record of Mars, cataloguing the influence played by water-based erosion over time.

The study, titled “Fluvial Stratigraphy of Valley Fills at Aeolis Dorsa, Mars: Evidence for Base-Level Fluctuations Controlled by a Downstream Water Body“, recently appeared in the scientific journal GeoScienceWorld. Led by Benjamin D. Cardenas – a geologist with the Jackson School of Geosciences at the University of Texas at Austin – the team examined satellite data of the Aeolis Dorsa region to study the structure of sedimentary deposits.

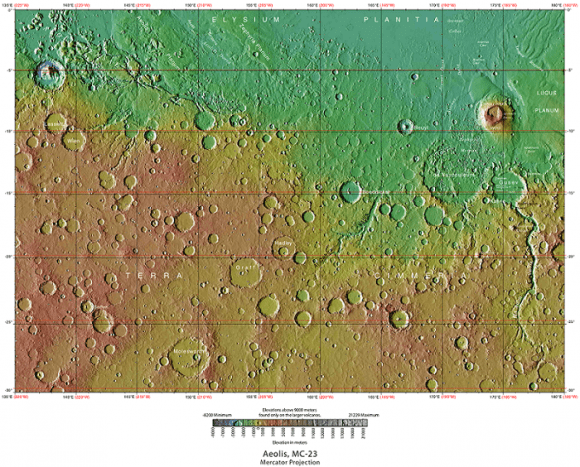
MOLA Topographic Map of Aeolis Quadrangle (MC-23) on the planet Mars. Credit: USGS

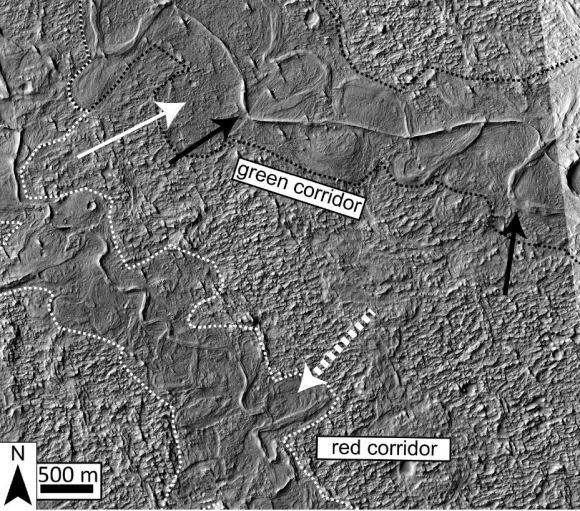
For years, Aeolis Dorsa has been of interest to scientists since it contains some of the most densely-packed sedimentary layers on Mars, which were deposited by flowing water (aka. fluvial deposits). These deposits are visible from orbit because of the way they have undergone a process known as “topographic inversion” – which consists of deposits filling low river channels, then being exhumed to create incised valleys.

By definition, incised valleys are topographic lows produced by “riverine” erosion – i.e. relating to a river or riverbank. On Earth, these valleys are commonly created by rising sea levels, and then filled with sediment as a result of falling sea levels. As sea levels rise, the valleys are cut from the landscape as the waters move inland; and as the sea levels drop, retreating waters deposit sediment within them.

According to the study, this process has created an opportunity for geophysicists and planetary scientist to observe Mars’ geological record in three dimensions and across significant distances. As Cardenas told Universe Today via email:

“Sedimentary rocks in general record information about the environments under which they were deposited. Fluvial (river) deposits specifically record information about the way rivers migrated laterally, the way they aggraded vertically, and how these things changed over time.”
The dotted white arrow points to curved strata recording point bar growth and river migration while the black arrow shows topographically inverted river deposits outcropping as ridges (e.g., black arrow). Credit: hou.usra.edu

Here on Earth, the statigraphy (i.e. the order and position of sedimentary layers) of sedimentary rocks has been used by geologists for generations to place constraints on what conditions were like on our planet billions of years ago. It has only been in recent history that the study of sedimentary layers has been used to place constraints on what environmental conditions were like on other planetary bodies (like Mars) billions of years ago.

However, most of these studies have produced data that has been unable to resolve sedimentary packaging at the sub-meter scale. Instead, satellite images have been used to define large-scale stratigraphic relationships, such as deposition patterns along past water channels. In other words, the studies have focused on cataloging the existence of past water flows on Mars more than what has happened since then.

As Cardenas indicated, he and his team took a different approach, one which considered that Mars has experienced changes over the past 3.5 billion years. As he explained:

“In general, there has been the assumption that a lot of the martian surface is not particularly different than it was 3.5 billion years ago. We make an effort to demonstrate that the modern surface at our study area, Aeolis Dorsa, is the result of burial, exhumation, and un-equal erosion, and it can’t be assumed that the modern surface represents the ancient surface at all. We really try to show that what we see today, the features we can measure today, are sedimentary deposits of rivers, and not actual rivers. This is incredibly important to realize when you start making interpretations of your observations, and it is frequently a missed point.”
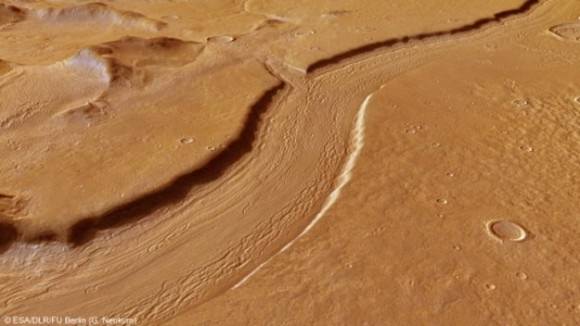
Perspective view of Reull Vallis based on images taken by the ESA’s Mars Express. Reull Vallis, a river-like structure, is believed to have formed when running water flowed in the distant martian past. Credit and Copyright: ESA/DLR/FU Berlin (G. Neukum)

For the sake of their research, Cardenas and his team used stereo pairs of high-resolution images and topographic data taken by the Context Camera (CTX) and the High Resolution Imaging Science Experiment (HiRISE) aboard the Mars Reconnaissance Orbiter (MRO). This data was then combined with the Integrated Software for Imagers and Spectrometers (ISIS) –  a digital image-processing package used by the U.S. Geological Survey (USGS) – and NASA’s Ames Stereo Pipeline.

These processed the paired images into high-resolution topographic data and digital elevation models (DEMs) which were then compared to data from the Mars Orbiting Laser Altimeter (MOLA) instrument aboard the Mars Global Surveyor (MSG). The final result was a series of DEMs that were orders of magnitude higher in terms of resolution than anything previously produced.

For all of this, Cardenas and his colleagues were able to identify stacking patterns in the fluvial deposits, noted changes in sedimentation styles, and suggested mechanisms for their creation. In addition, the team introduced a brand new method to measure the flow direction of the rivers that left these deposits, which allowed them to see how the landscape has changed over the past few billion years.

“The study shows there was a large body of water on Mars ~3.5 billion years ago, and that this body of water increased and decreased in volume slowly enough that river sedimentation had time to adjust styles,” said Cardenas. “This is more in line with slower climatic changes, and less in line with catastrophic hydrologic events. Aeolis Dorsa is positioned along hypothesized coastlines of an ancient northern ocean on Mars. It’s interesting to find coastal river deposits at Aeolis Dorsa, but it doesn’t help us constrain the size of the water body (lake, ocean, etc.)”

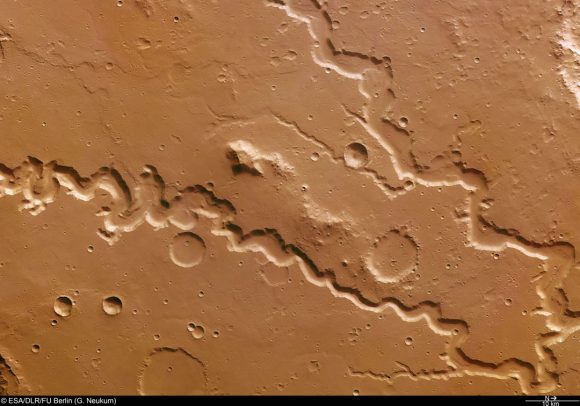
Nanedi Valles, a roughly 800-kilometre valley believed to be caused by ground-water outflow. Copyright ESA/DLR/FU Berlin (G. Neukum)

In essence, Cardenas and his colleagues concluded that – similar to Earth – falling and rising water levels in a large water body forced the formation of the paleo-valleys in their study area. And in a way that is similar to what is happening on Earth today, rivers that formed in coastal regions were strongly influenced by changes in water levels of a large, downstream water body.

For some time, it has been something of a foregone conclusion that the surface of Mars is dead, its features frozen in time. But as this study demonstrated, the landscape has undergone significant changes since it lost its atmosphere and surface water. These findings will no doubt be the subject of interest as we get closer to mounting a crewed mission to the Martian surface.

Further Reading: GSA, GeoScienceWorld

Astronomy Cast Ep. 457: Why Did Cassini Have To Die? In Memoriam

It’s time to say goodbye to an old friend, NASA’s Cassini spacecraft, which has been orbiting within the Saturnian system since 2004. But why does a seemingly healthy spacecraft and mission need to come to an end? Today we look back at the mission, some of the amazing discoveries, and why its finale was necessary.

We usually record Astronomy Cast every Friday at 12:00 pm PDT / 3:00 pm EDT/ 19:00 PM UTC. You can watch us live on here on AstronomyCast.com, or the AstronomyCast YouTube page.

If you would like to support Astronomy Cast, please visit our page at Patreon here – https://www.patreon.com/astronomycast. We greatly appreciate your support!

If you would like to join the Weekly Space Hangout Crew, visit their site here and sign up. They’re a great team who can help you join our online discussions!