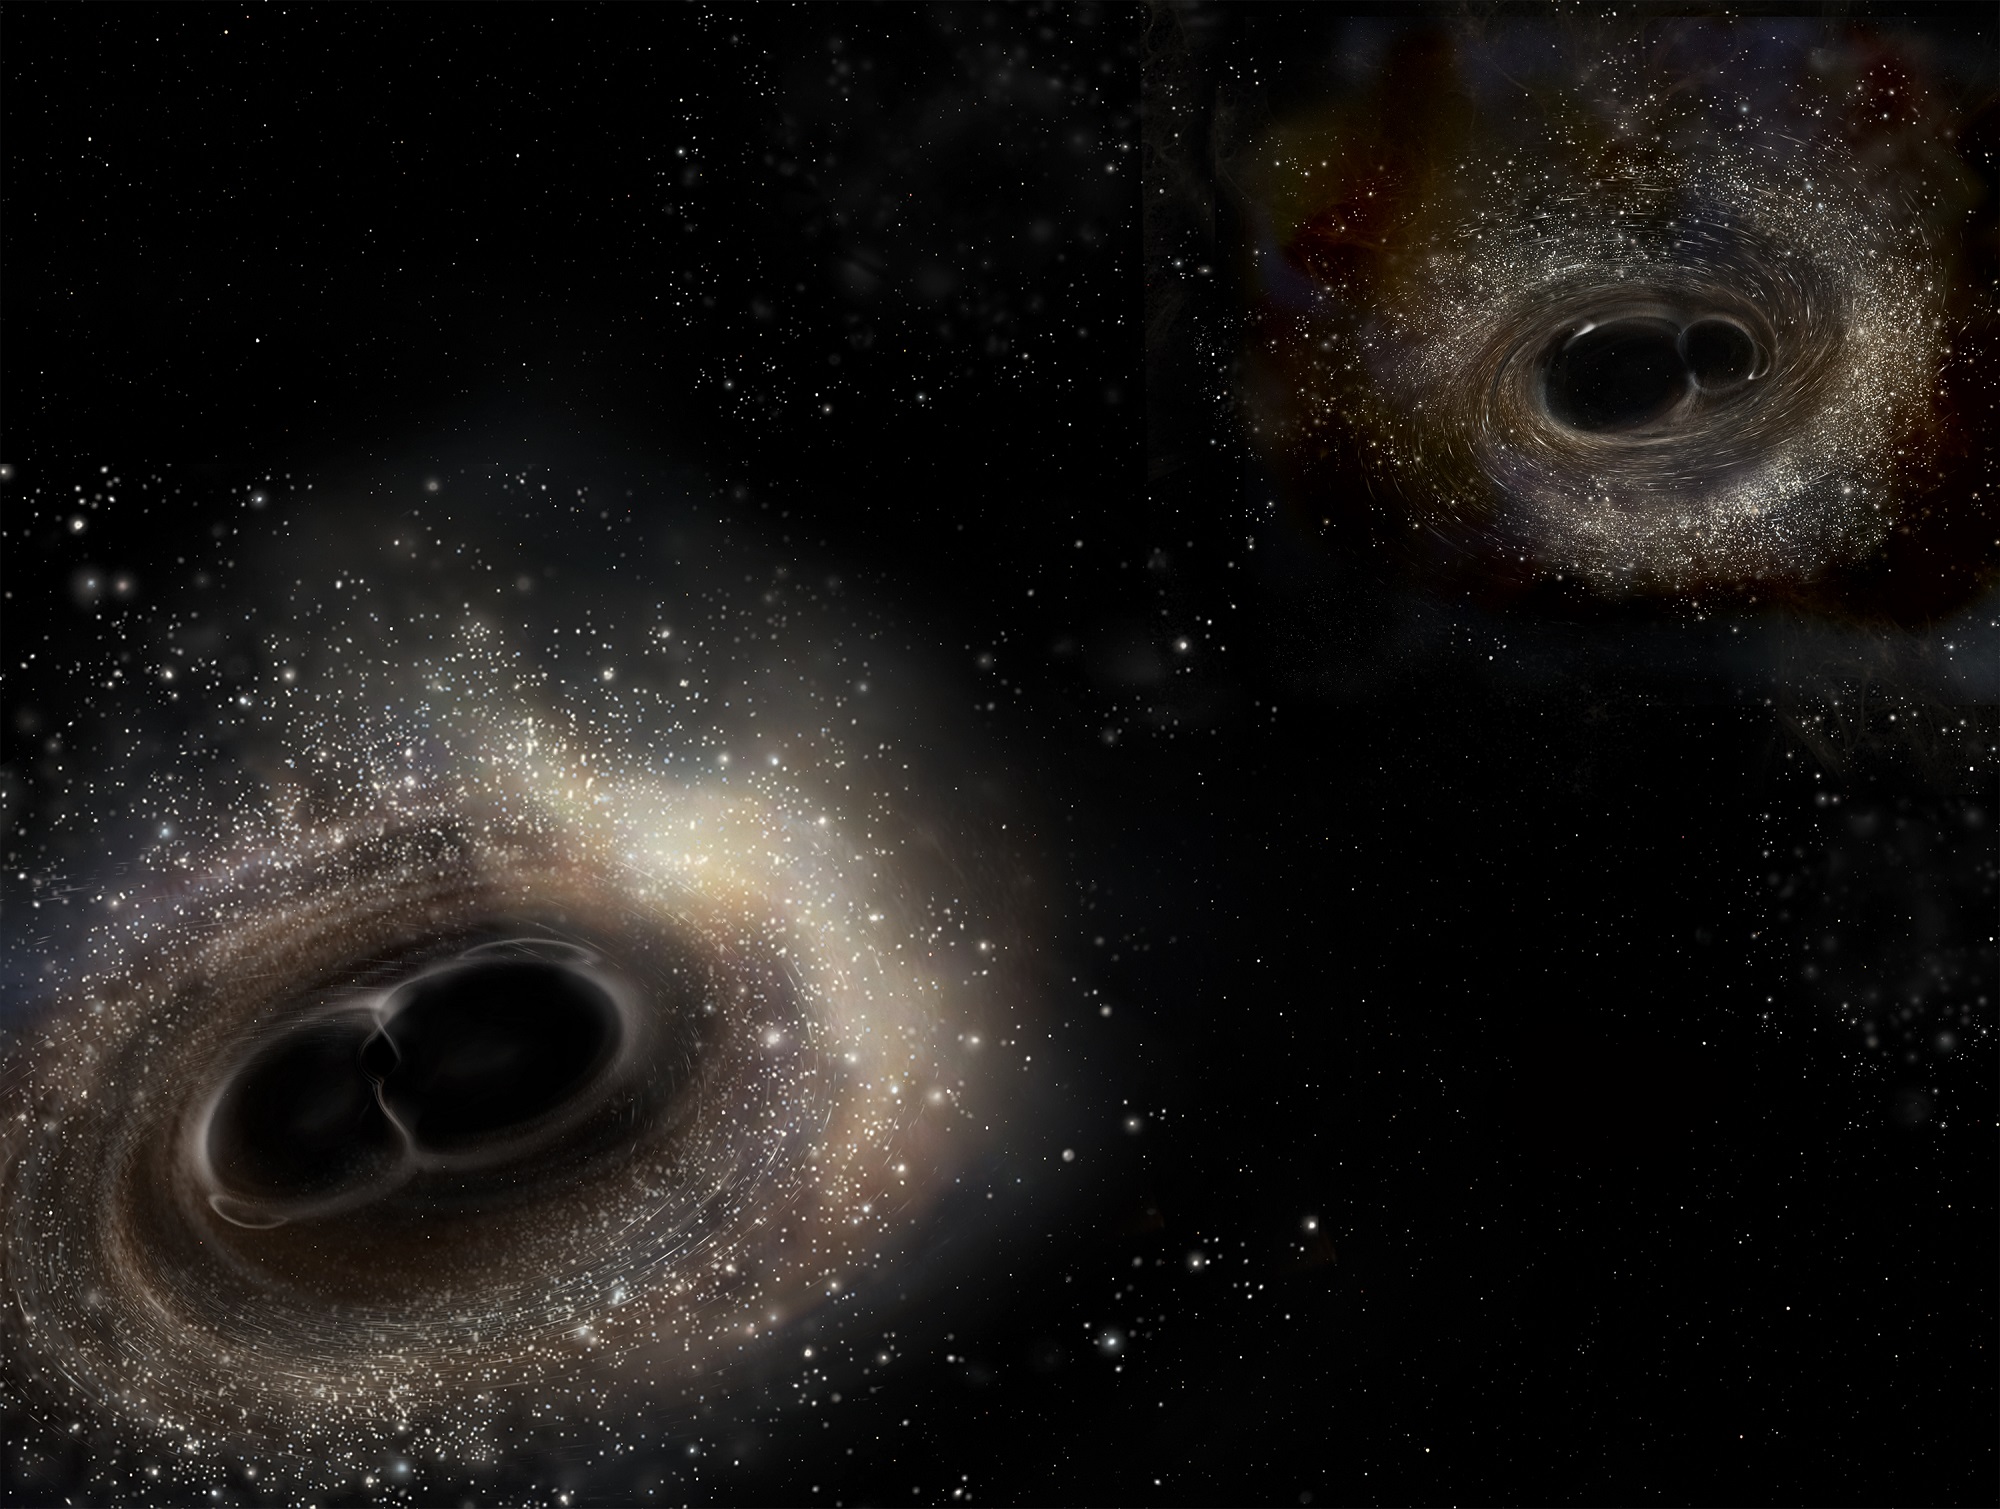
Artist's impression of merging binary black holes. Credit: LIGO/A. Simonnet.
Dark matter remains largely mysterious, but astrophysicists keep trying to crack open that mystery. Last year’s discovery of gravity waves by the Laser Interferometer Gravitational Wave Observatory (LIGO) may have opened up a new window into the dark matter mystery. Enter what are known as ‘primordial black holes.’
Theorists have predicted the existence of particles called Weakly Interacting Massive Particles (WIMPS). These WIMPs could be what dark matter is made of. But the problem is, there’s no experimental evidence to back it up. The mystery of dark matter is still an open case file.
When LIGO detected gravitational waves last year, it renewed interest in another theory attempting to explain dark matter. That theory says that dark matter could actually be in the form of Primordial Black Holes (PBHs), not the aforementioned WIMPS.
Primordial black holes are different than the black holes you’re probably thinking of. Those are called stellar black holes, and they form when a large enough star collapses in on itself at the end of its life. The size of these stellar black holes is limited by the size and evolution of the stars that they form from.
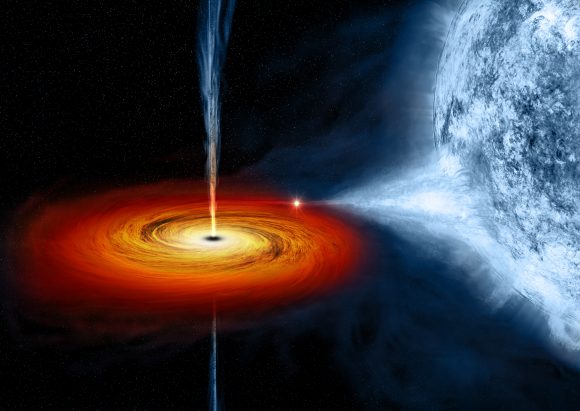
This artist’s drawing shows a stellar black hole as it pulls matter from a blue star beside it. Could the stellar black hole’s cousin, the primordial black hole, account for the dark matter in our Universe? Credits: NASA/CXC/M.Weiss
Unlike stellar black holes, primordial black holes originated in high density fluctuations of matter during the first moments of the Universe. They can be much larger, or smaller, than stellar black holes. PBHs could be as small as asteroids or as large as 30 solar masses, even larger. They could also be more abundant, because they don’t require a large mass star to form.
When two of these PBHs larger than about 30 solar masses merge together, they would create the gravitational waves detected by LIGO. The theory says that these primordial black holes would be found in the halos of galaxies.
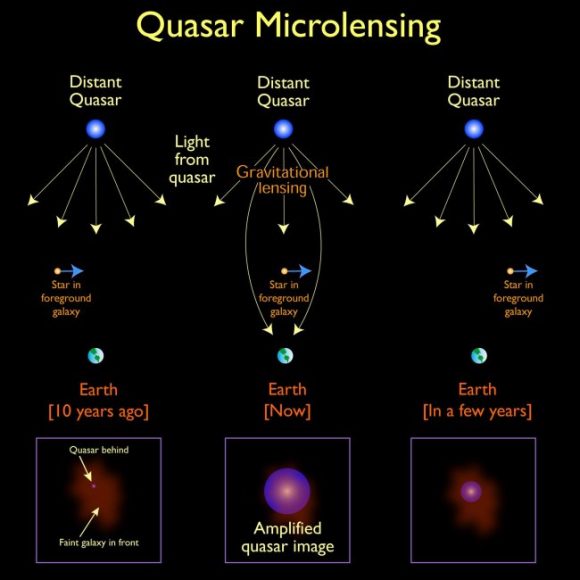
If there are enough of these intermediate sized PBHs in galactic halos, they would have an effect on light from distant quasars as it passes through the halo. This effect is called ‘micro-lensing’. The micro-lensing would concentrate the light and make the quasars appear brighter.
A depiction of quasar microlensing. The microlensing object in the foreground galaxy could be a star (as depicted), a primordial black hole, or any other compact object. Credit: NASA/Jason Cowan (Astronomy Technology Center).
The effect of this micro-lensing would be stronger the more mass a PBH has, or the more abundant the PBHs are in the galactic halo. We can’t see the black holes themselves, of course, but we can see the increased brightness of the quasars.
Working with this assumption, a team of astronomers at the Instituto de Astrofísica de Canarias examined the micro-lensing effect on quasars to estimate the numbers of primordial black holes of intermediate mass in galaxies.
“The black holes whose merging was detected by LIGO were probably formed by the collapse of stars, and were not primordial black holes.” -Evencio Mediavilla
The study looked at 24 quasars that are gravitationally lensed, and the results show that it is normal stars like our Sun that cause the micro-lensing effect on distant quasars. That rules out the existence of a large population of PBHs in the galactic halo. “This study implies “says Evencio Mediavilla, “that it is not at all probable that black holes with masses between 10 and 100 times the mass of the Sun make up a significant fraction of the dark matter”. For that reason the black holes whose merging was detected by LIGO were probably formed by the collapse of stars, and were not primordial black holes”.
Depending on you perspective, that either answers some of our questions about dark matter, or only deepens the mystery.
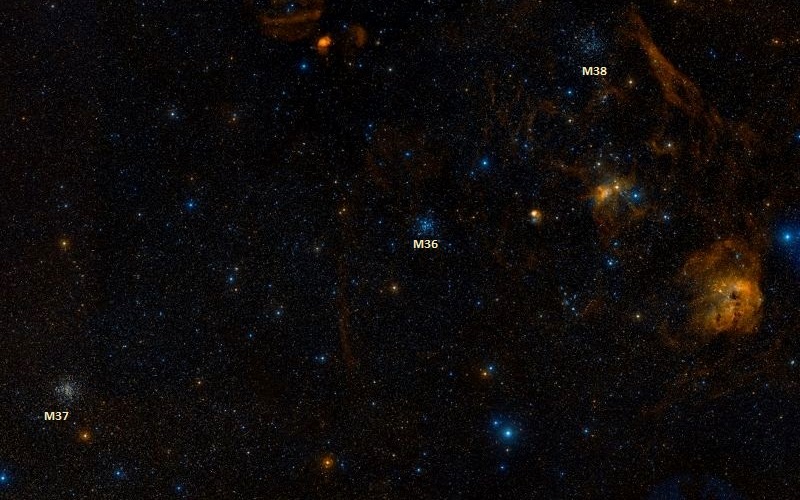
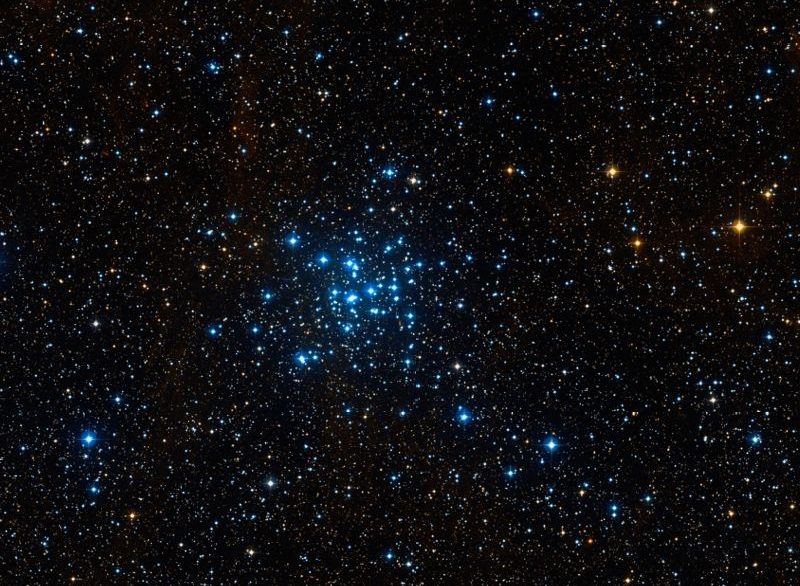
The open star cluster Messier 38, in proximity to Messier 36 and Messier 37. Credit: Wikisky
Welcome back to Messier Monday! In our ongoing tribute to the great Tammy Plotner, we take a look at the Pinweel Cluster, otherwise known as Messier 36. Enjoy!
During the 18th century, famed French astronomer Charles Messier noted the presence of several “nebulous objects” in the night sky. Having originally mistaken them for comets, he began compiling a list of them so that others would not make the same mistake he did. In time, this list (known as the Messier Catalog) would come to include 100 of the most fabulous objects in the night sky.
Included in this list is the open star cluster Messier 36, also known as the Pinwheel Cluster. This cluster is so-named because of its association with the Auriga constellation (aka. “the Charioteer”). Though similar in size and make-up to the Pleiades Cluster (Messier 45), the Pinwheel Cluster is actually ten times farther away from Earth – and one of the most distant of any clusters catalogued by Messier.
What You Are Looking At:
Located a little more than 4000 light years from our solar system, this group of about 60 stars spans across about 14 light years of space. As you are studying it, you’ll notice one star which seems brighter than the rest… With good reason! Its a spectral type B2 and about 360 more luminous than our Sun. Many of the cluster members here are also B-type stars and rapid rotators.
Close-up of the central region of Messier 36. Credit: Wikisky
This means that 25 million year old Messier 36 shares a lot in common with another nearby star cluster, the Pleiades. By taking a deep look at young clusters with stars of varying ages, astronomers are able to how long circumstellar disks may last – giving us a clue as to whether or not planet-forming stars may lay within them.
“We have completed the first systematic and homogeneous survey for circumstellar disks in a sample of young clusters that both span a significant range in age and contain statistically significant numbers of stars whose masses span nearly the entire stellar mass spectrum. Analysis of the combined survey indicates that the cluster disk fraction is initially very high and rapidly decreases with increasing cluster age, such that one-half the stars within the clusters lose their disks in 3 million years. Moreover, these observations yield an overall disk lifetime of ~6 million years in the surveyed cluster sample. This is the timescale for essentially all the stars in a cluster to lose their disks. This should set a meaningful constraint for the planet-building timescale in stellar clusters.”
“The open cluster M36 (NGC 1960), which apparently forms the center of the Aur OB1 association, has been the subject of numerous analyses, and of these the earliest studies are today of historical interest only. NGC 1960 has recently attracted attention as the most likely origin of a massive OB star that exploded about 40,000 yr ago, creating the supernova remnant Simeis 147, an old supernova remnant listed in the catalog compiled at Simeiz by Gaze & Shajn (1952). A pulsar, PSR J0538+2817, has been found near the center of Simeis 147.”
2MASS Atlas Image Mosaic of the open star cluster Messier 36. Credit: NASA/IPAC/Caltech/University of Massachusetts
And the search for planet-building stars within M36 hasn’t stopped yet. The Spitzer Space telescope will also be investigating it, thanks to a proposal made by George Rieke:
“We propose a deep IRAC/MIPS survey of NGC 1960, a ~20 Myr-old massive cluster unexplored in the mid infrared. This cluster is at a key stage in terrestrial planet formation. Our survey will likely detect infrared excess emission from debris disks and transition disks from ~ 100 intermediate-mass (1-3 solar mass) stars. Together with ground-based photometry/spectroscopy of this cluster, proposed observations of 10 Myr-old NGC 6871, scheduled cycle 4 observations of the massive 13 Myr old clusters h and chi Persei, and existing data on NGC 2547 at 30 Myr, this survey will yield robust constraints on the frequency of debris/transition disks as a function of spectral type, age, and cluster environment at a critical age range for planet formation. This survey will provide a benchmark study of the observable signatures of terrestrial planet formation that will inform James Webb Space Telescope observations of planet-forming disks a decade from now.”
History of Observation:
The presence of this awesome star cluster was first recorded by Giovanni Batista Hodierna before 1654 and re-discovered by Le Gentil in 1749. However, it was Charles Messier who took the time to carefully record its position for future generations:
“In the night of September 2 to 3, 1764, I have determined the position of a star cluster in Auriga, near the star Phi of that constellation. With an ordinary refractor of 3 feet and a half, one has difficulty to distinguish these small stars; but when employing a stronger instrument, one sees them very well; they don’t contain between them any nebulosity: their extension is about 9 minutes of arc. I have compared the middle of this cluster with the star Phi Aurigae, and I have determined its position; its right ascension was 80d 11′ 42″, and its declination 34d 8′ 6″ north.”
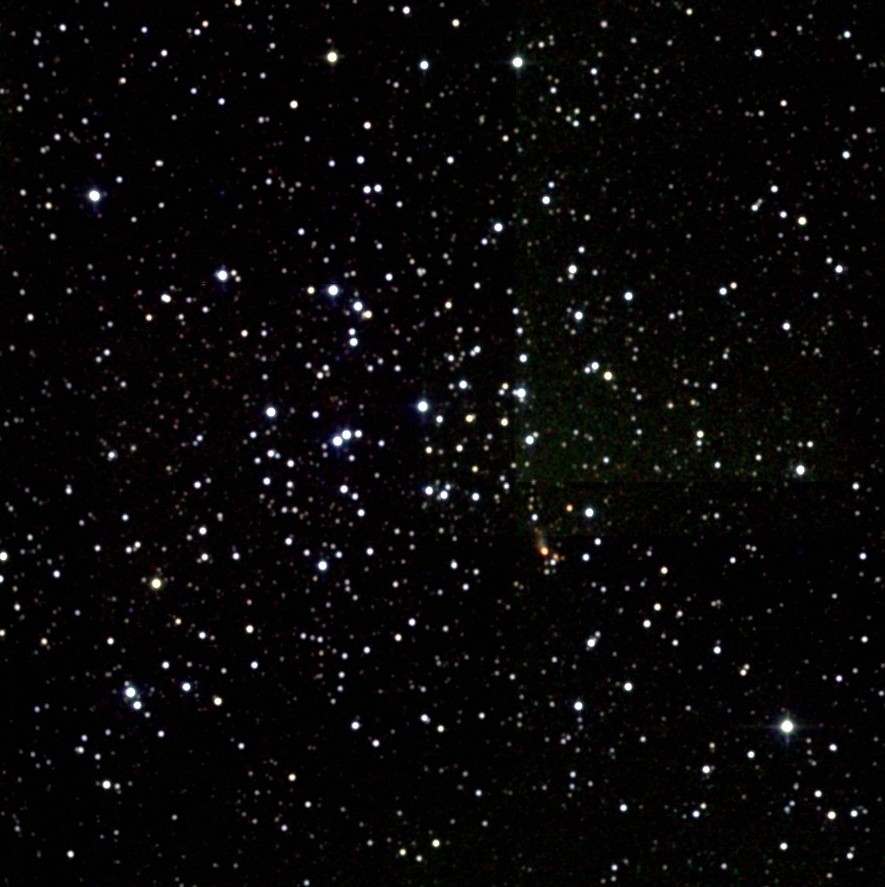
M36 Open Cluster. Credit: NOAO/AURA/NSF
It would be observed again by Caroline, William and John Herschel who would be the first to note the double star in M36’s center. Although none of their notes are particularly glowing on this awesome star cluster, Admiral Symth does come to the historic rescue!
“A neat double star in a splendid cluster, on the robe below the Waggoner’s left thigh, and near the centre of the Galaxy stream. A [mag] 8 and B 9, both white; in a rich though open splash of stars from the 8th to the 14th magnitudes, with numerous outliers, like the device of a star whose rays are formed by very small stars. This object was registered by M. [Messier] in 1764; and the double star, as H. [John Herschel] remarks, is admirably placed, for future astronomers to ascertain whether there be internal motion in clusters. A line carried from the central star in Orion’s belt, through Zeta Tauri, and continued about 13deg beyond, will reach the cluster, following Phi Aurigae by about two degrees.”
Locating Messier 36:
Locating Messier 36 is relatively easy once you understand the constellation of Auriga. Looking roughly like a pentagon in shape, start by identifying the brightest of these stars – Capella. Due south of it is the second brightest star which shares its border with Beta Tauri, El Nath. By aiming binoculars at El Nath, go north about 1/3 the distance between the two and enjoy all the stars!
You will note two very conspicuous clusters of stars in this area, and so did Le Gentil in 1749. Binoculars will reveal the pair in the same field, as will telescopes using lowest power. The dimmest of these is the M38, and will appear vaguely cruciform in shape. At roughly 4200 light years away, larger aperture will be needed to resolve the 100 or so fainter members. About 2 1/2 degrees to the southeast (about a finger width) you will see the much brighter M36.
The location of M36 in the Auriga constellation. Credit: IAU and Sky and Telescope Magazine (Roger Sinnott & Rick Fienberg)
More easily resolved in binoculars and small scopes, this “jewel box” galactic cluster is quite young and about 100 light years closer. If you continue roughly on the same trajectory about another 4 degrees southeast you will find open cluster M37. This galactic cluster will appear almost nebula-like to binoculars and very small telescopes – but comes to perfect resolution with larger instruments.
While all three open star clusters make fine choices for moonlit or light polluted skies, remember that high sky light means less faint stars which can be resolved – robbing each cluster of some of its beauty. Messier 36 is intermediate brightness of the trio and you’ll quite enjoy its “X” shape and many pairings of stars!
Has the central double changed with time? Why not observe for yourself and see!
Object Name: Messier 36 Alternative Designations: M36, NGC 1960, Pinwheel Cluster Object Type: Galactic Open Star Cluster Constellation: Auriga Right Ascension: 05 : 36.1 (h:m) Declination: +34 : 08 (deg:m) Distance: 4.1 (kly) Visual Brightness: 6.3 (mag) Apparent Dimension: 12.0 (arc min)
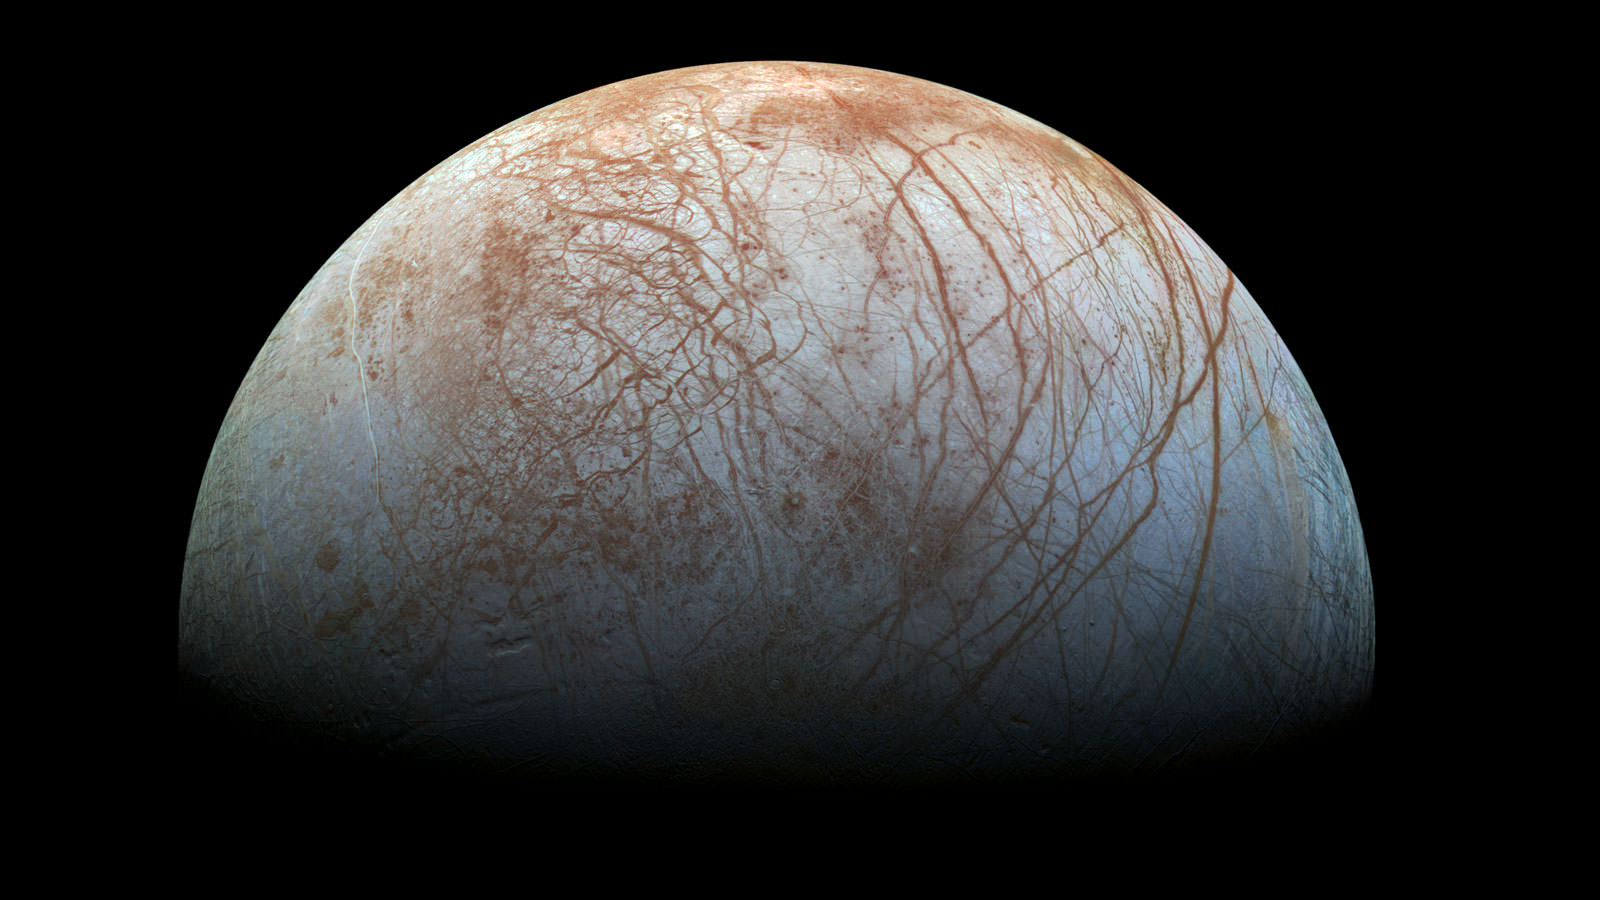
The fascinating surface of Jupiter’s icy moon Europa looms large in this newly-reprocessed color view, made from images taken by NASA's Galileo spacecraft in the late 1990s. This is the color view of Europa from Galileo that shows the largest portion of the moon's surface at the highest resolution. Credits: NASA/JPL-Caltech/SETI Institute
Earlier this week, NASA hosted the “Planetary Science Vision 2050 Workshop” at their headquarters in Washington, DC. Running from Monday to Wednesday – February 27th to March 1st – the purpose of this workshop was to present NASA’s plans for the future of space exploration to the international community. In the course of the many presentations, speeches and panel discussions, many interesting proposals were shared.
Among them were two presentations that outlined NASA’s plan for the exploration of Jupiter’s moon Europa and other icy moons. In the coming decades, NASA hopes to send probes to these moons to investigate the oceans that lie beneath theirs surfaces, which many believe could be home to extra-terrestrial life. With missions to the “ocean worlds” of the Solar System, we may finally come to discover life beyond Earth.
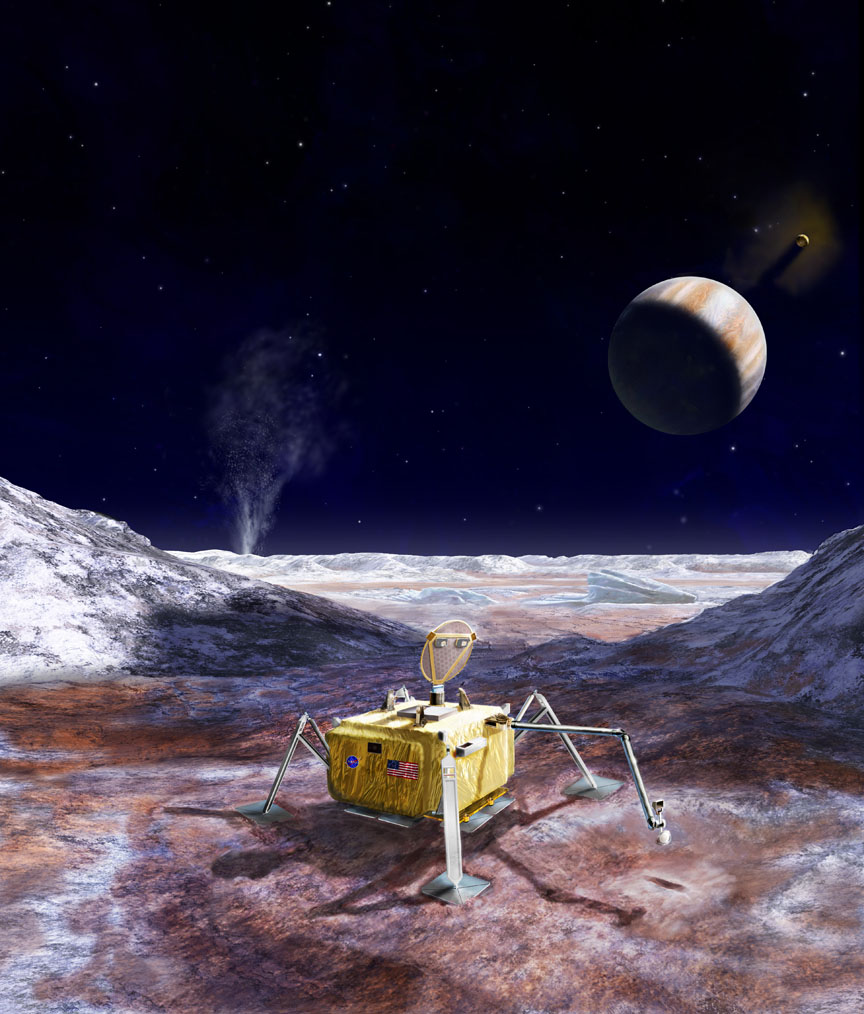
Artist’s rendering of a potential future mission to land a robotic probe on the surface of Jupiter’s moon Europa. Credits: NASA/JPL-Caltech
This report was drafted by NASA’s Planetary Science Division (PSD) in response to a congressional directive to begin a pre-Phase A study to assess the scientific value and engineering design of a Europa lander mission. These studies, which are known as Science Definition Team (SDT) reports, are routinely conducted long before missions are mounted in order to gain an understanding of the types of challenges it will face, and what the payoffs will be.
In addition to being the co-chair of the Science Definition Team, Hand also served as head of the project science team, which included members from the JPL and the California Institute of Technology (Caltech). The report he and his colleagues prepared was finalized and issued to NASA on February 7th, 2017, and outlined several objectives for scientific study.
As was indicated during the course of the presentation, these objectives were threefold. The first would involve searching for biosignatures and signs of life through analyses of Europa’s surface and near-subsurface material. The second would be to conduct in-situ analyses to characterize the composition of non-ice near-subsurface material, and determine the proximity of liquid water and recently-erupted material near the lander’s location.
The third and final goal would be to characterize the surface and subsurface properties and what dynamic processes are responsible for shaping them, in support for future exploration missions. As Hand explained, these objectives are closely intertwined:
“Were biosignatures to be found in the surface material, direct access to, and exploration of, Europa’s ocean and liquid water environments would be a high priority goal for the astrobiological investigation of our Solar System. Europa’s ocean would harbor the potential for the study of an extant ecosystem, likely representing a second, independent origin of life in our own solar system. Subsequent exploration would require robotic vehicles and instrumentation capable of accessing the habitable liquid water regions in Europa to enable the study of the ecosystem and organisms.”
Artist’s impression of a hypothetical ocean cryobot (a robot capable of penetrating water ice) in Europa. Credit: NASA
In other words, if the lander mission detected signs of life within Europa’s ice sheet, and from material churned up from beneath by resurfacing events, then future missions – most likely involving robotic submarines – would definitely be mounted. The report also states that any finds that are indicative of life would mean that planetary protections would be a major requirement for any future mission, to avoid the possibility of contamination.
But of course, Hand also admitted that there is a chance the lander will find no signs of life. If so, Hand indicated that future missions would be tasked with gaining “a better understanding of the fundamental geological and geophysical process on Europa, and how they modulate exchange of material with Europa’s ocean.” On the other hand, he claimed that even a null-result (i.e. no signs of life anywhere) would still be a major scientific find.
Ever since the Voyager probes first detected possible signs of an interior ocean on Europa, scientists have dreamed of the day when a mission might be possible to explore the interior of this mysterious moon. To be able to determine that life does not exist there could no less significant that finding life, in that both would help us learn more about life in our Solar System.
The Science Definition Team’s report will also be the subject of a townhall meeting at the 2017 Lunar and Planetary Science Conference (LPSC) – which will be taking place from March 20th to 24th in The Woodlands, Texas. The second event will be on April 23rd at the Astrobiology Science Conference (AbSciCon) held in Mesa, Arizona. Click here to read the full report.
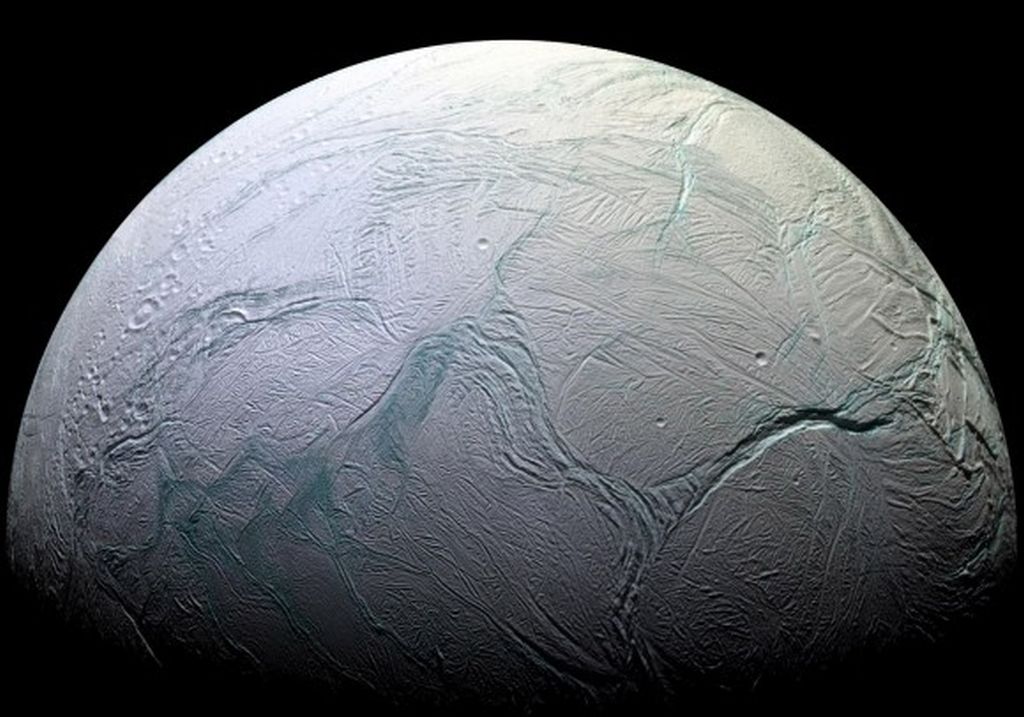
Saturn’s moon Enceladus is another popular destination for proposed missions since it is believed to potentially host extra-terrestrial life. Credit: NASA/JPL/Space Science Institute
The second presentation, titled “Roadmaps to Ocean Worlds” took place later on Monday, Feb. 27th. This presentation was put on by members of the the Roadmaps to Ocean Worlds (ROW) team, which is chaired by Dr. Amandra Hendrix – a senior scientist at the Planetary Science Institute in Tuscon, Arizona – and Dr. Terry Hurford, a research assistant from NASA’s Science and Exploration Directorate (SED).
As a specialist in UV spectroscopy of planetary surfaces, Dr. Hendrix has collaborated with many NASA missions to explore icy bodies in the Solar System – including the Galileo and Cassini probes and the Lunar Reconnaissance Orbiter (LRO). Dr. Hurford, meanwhile, specializes in the geology and geophysics of icy satellites, as well as the effects orbital dynamics and tidal stresses have on their interior structures.
Founded in 2016 by NASA’s Outer Planets Assessment Group (OPAG), ROW was tasked with laying the groundwork for a mission that will explore “ocean worlds” in the search for life elsewhere in the Solar System. During the course of the presentation, Hendrix and Hurford laid out the findings from the ROW report, which was completed in January of 2017.
As they state in this report, “we define an ‘ocean world’ as a body with a current liquid ocean (not necessarily global). All bodies in our solar system that plausibly can have or are known to have an ocean will be considered as part of this document. The Earth is a well-studied ocean world that can be used as a reference (“ground truth”) and point of comparison.”
Dwarf planet Ceres is shown in this false-color renderings, which highlight differences in surface materials. The image is centered on Ceres brightest spots at Occator crater. Credit: NASA/JPL-Caltech/UCLA/MPS/DLR/IDA
By this definition, bodies like Europa, Ganymede,Callisto, and Enceladus would all be viable targets for exploration. These worlds are all known to have subsurface oceans, and there has been compelling evidence in the past few decades that point towards the presence of organic molecules and prebiotic chemistry there as well. Triton, Pluto,Ceres and Dione are all mentioned as candidate ocean worlds based on what we know of them.
Titan also received special mention in the course of the presentation. In addition to having an interior ocean, it has even been ventured that extremophile methanogenic lifeforms could exist on its surface:
“Although Titan possesses a large subsurface ocean, it also has an abundant supply of a wide range of organic species and surface liquids, which are readily accessible and could harbor more exotic forms of life. Furthermore, Titan may have transient surface liquid water such as impact melt pools and fresh cryovolcanic flows in contact with both solid and liquid surface organics. These environments present unique and important locations for investigating prebiotic chemistry, and potentially, the first steps towards life.”
Ultimately, the ROW’s pursuit of life on “ocean worlds” consists of four main goals. These include identifying ocean worlds in the solar system, which would mean determining which of the worlds and candidate worlds would be well-suited to study. The second is to characterize the nature of these oceans, which would include determining the properties of the ice shell and liquid ocean, and what drives fluid motion in them.
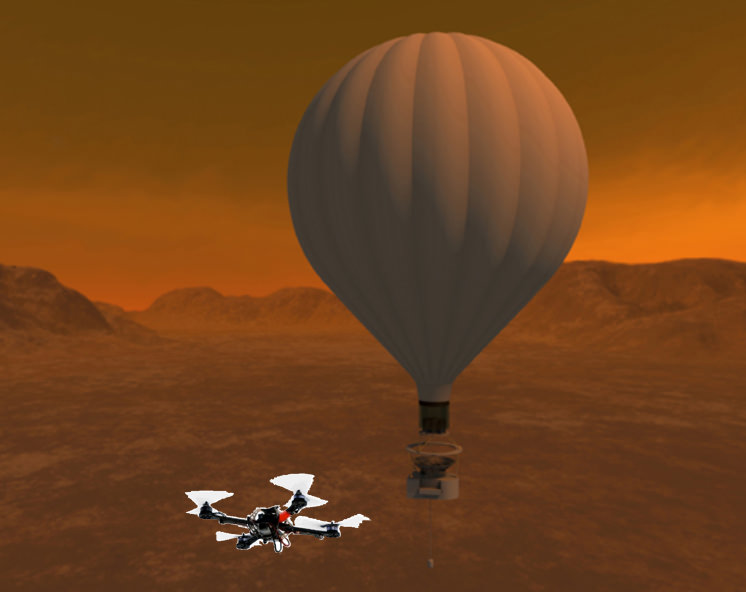
Artist’s conception of the Titan Aerial Daughtercraft on Saturn’s moon Titan. Credit: NASA
The third sub-goal involves determining if these oceans have the necessary energy and prebiotic chemistry to support life. And the fourth and final goal would be to determine how life might exist in them – i.e. whether it takes the form of extremophile bacteria and tiny organisms, or more complex creatures. Hendrix and Hurford also covered the kind of technological advances that will be needed for such missions to happen.
Naturally, any such mission would require the development of power sources and energy storage systems that would be suitable for cryogenic environments. Autonomous systems for pinpoint landing and technologies for aerial or landed mobility would also be needed. Planetary protection technologies would be necessary to prevent contamination, and electronic/mechanical systems that can survive in an ocean world environment too,
While these presentations are merely proposals of what could happen in the coming decades, they are still exciting to hear about. If nothing else, they show how NASA and other space agencies are actively collaborating with scientific institutions around the world to push the boundaries of knowledge and exploration. And in the coming decades, they hope to make some substantial leaps.
If all goes well, and exploration missions to Europa and other icy moons are allowed to go forward, the benefits could be immeasurable. In addition to the possibility of finding life beyond Earth, we will come to learn a great deal about our Solar System, and no doubt learn something more about humanity’s place in the cosmos.
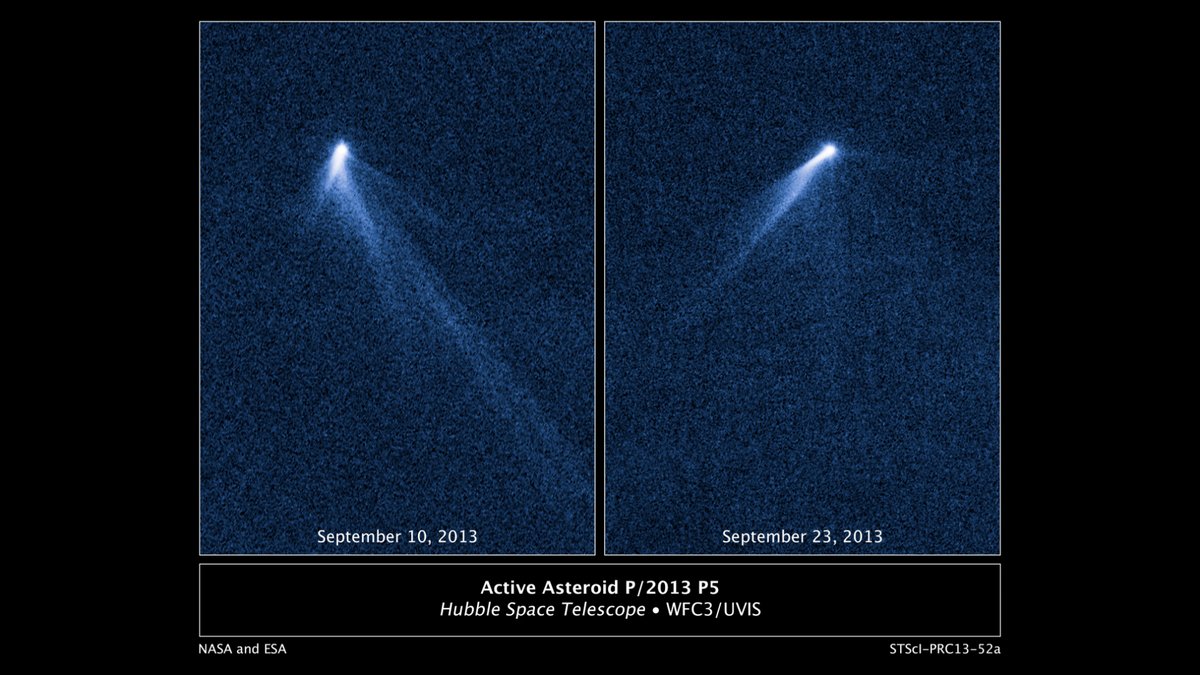
Images from the Hubble Space Telescope of activated asteroid P/2013P5 where the dust tail can be seen. Source: NASA/ESA.
In the 18th and 19th centuries, astronomers made some profound discoveries about asteroids and comets within our Solar System. From discerning the true nature of their orbits to detecting countless small objects in the Main Asteroid Belt, these discoveries would inform much of our modern understanding of these bodies.
A general rule about comets and asteroids is that whereas the former develop comas or tails as they undergo temperature changes, the latter do not. However, a recent discovery by an international group of researchers has presented another exception to this rule. After viewing a parent asteroid in the Main Belt that split into a pair, they noted that both fragments formed tails of their own.
The reason asteroids do not do behave like comets has a lot to do with where they are situated. Located predominantly in the Main Belt, these bodies have relatively circular orbits around the Sun and do not experience much in the way of temperature changes. As a result, they do not form tails (or halos), which are created when volatile compounds (i.e. nitrogen, hydrogen, carbon dioxide, methane, etc.) sublimate and form clouds of gas.
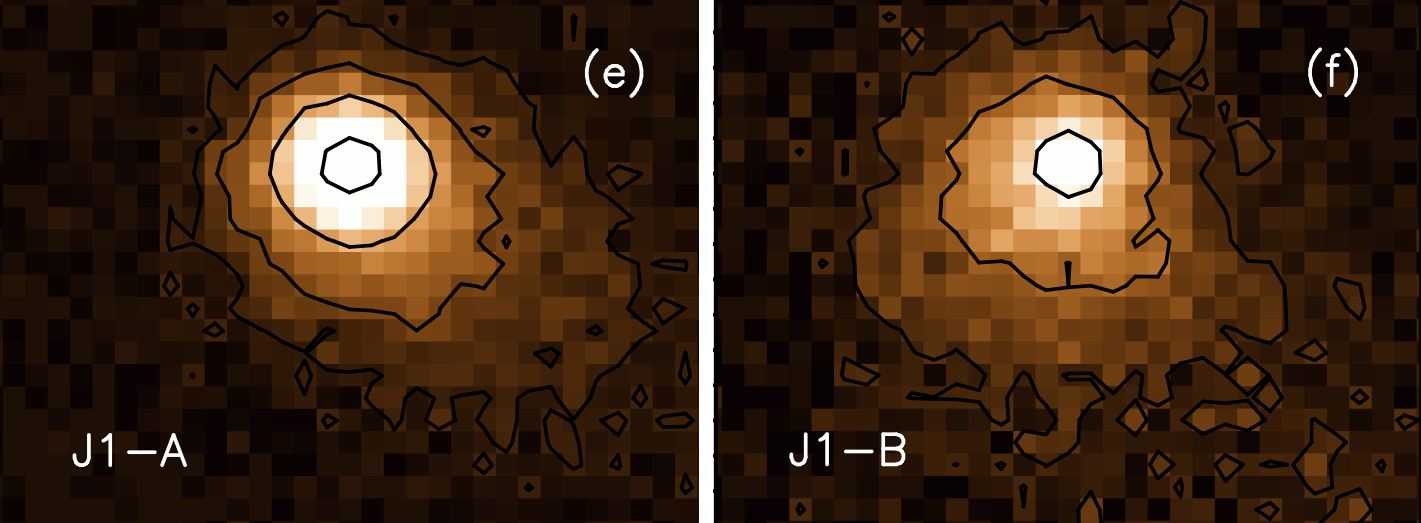
Images of the P/2016 J1 asteroid pair taken on May 15th, 2016. They show a central region, the asteroid, and a diffuse blot corresponding to the dust tail. Credit: IAA
As astronomical phenomena go, asteroid pairs are quite common. They are created when an asteroid breaks in two, which can be the result of excess rotational speed, impact with another body, or because of the destabilization of binary systems (i.e. asteroid that orbit each other). Once this happens, these two bodies will orbit the Sun rather than being gravitational bound to each other, and progressively drift farther apart.
However, when monitoring the asteroid P/2016 J1, an international team from the Institute of Astrophysics in Andalusia (IAA-CSIC) noticed something interesting. Apparently, both fragments in the pair had become “activated” – that is to say, they had formed tails. As Fernando Moreno, a researcher at IAA-CSIC who led the project, said in an Institute press release:
“Both fragments are activated, i.e., they display dust structures similar to comets. This is the first time we observe an asteroid pair with simultaneous activity… In all likelihood, the dust emission is due to the sublimation of ice that was left exposed after the fragmentation.”
While this is not the first instance where asteroids proved to be an exception to the rule and began forming clouds of sublimated gas around them, this is the first time it was observed happening with an asteroid pair. And it seems that the formation of this tail was in response to the breakup, which is believed to have happened six years ago, during the previous orbit of the asteroid.
An artist’s conception of two tidally locked objects orbiting the Sun from afar (2010 WG9). Credit: zmescience
In 2016, the research team used the Great Telescope of the Canary Islands (GTC) on the island of La Palma and the Canada-France-Hawaii Telescope (CFHT) at Mauna Kea to confirm that the asteroid had formed a pair. Further analysis revealed that the asteroids were activated between the end of 2015 and the beginning of 2016, when they reached the closest point in their orbit with the Sun (perihelion).
This analysis also revealed that the fragmentation of the asteroid and the bout of activity were unrelated. In other words, the sublimation has happened since the breakup and was not the cause of it. Because of this, these objects are quite unique as far as Solar System bodies go.
Not only are they two more exceptions to the rule governing comets and asteroids (there are only about twenty known cases of asteroids forming tales), the timing of their breakup also means that they are the youngest asteroid pair in the Solar System to date. Not bad for a bunch of rocks!
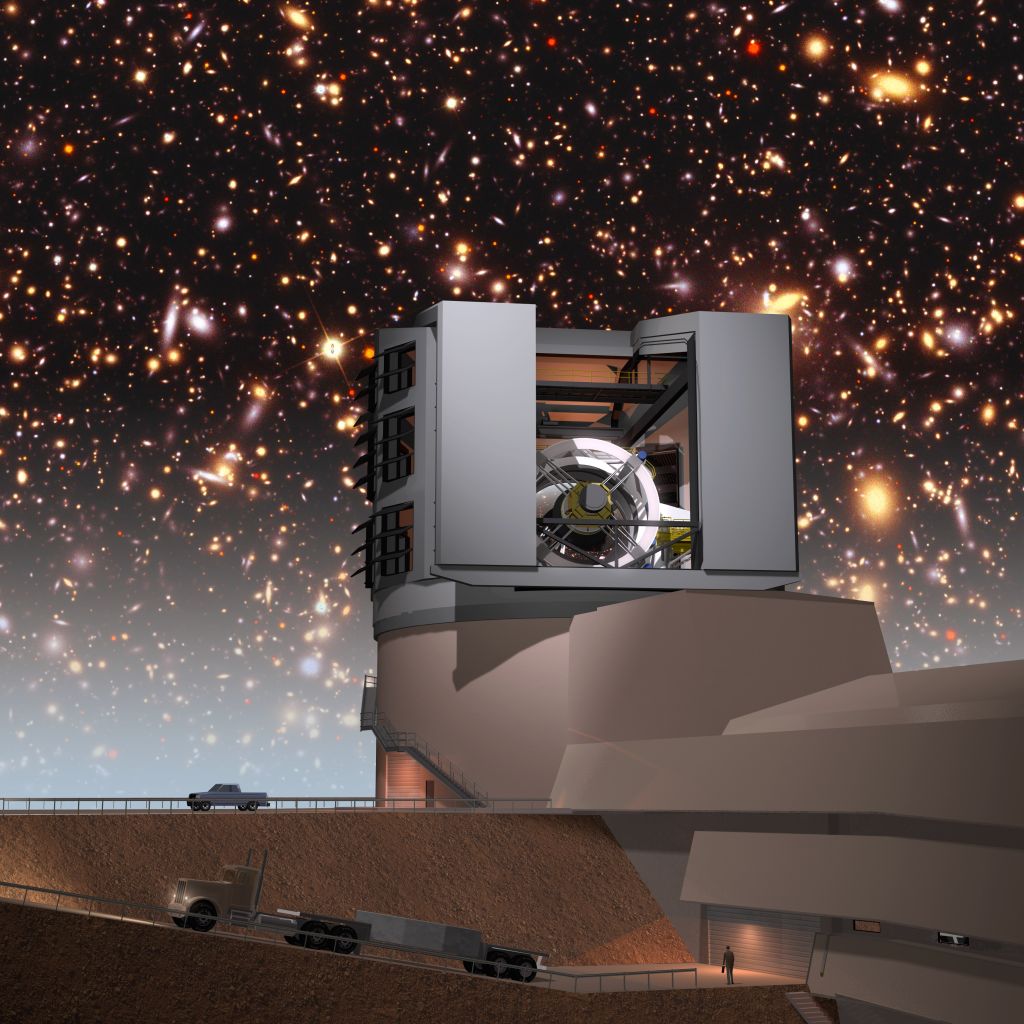
An artist's illustration of the Large Synoptic Survey Telescope with a simulated night sky. The team hopes to use the LSST to further refine their search for hard-surface supermassive objects. Image: Todd Mason, Mason Productions Inc. / LSST Corporation
We humans have an insatiable hunger to understand the Universe. As Carl Sagan said, “Understanding is Ecstasy.” But to understand the Universe, we need better and better ways to observe it. And that means one thing: big, huge, enormous telescopes.
In this series we’ll look at 6 of the world’s Super Telescopes:
While the world’s other Super Telescopes rely on huge mirrors to do their work, the LSST is different. It’s a huge panoramic camera that will create an enormous moving image of the Universe. And its work will be guided by three words: wide, deep, and fast.
While other telescopes capture static images, the LSST will capture richly detailed images of the entire available night sky, over and over. This will allow astronomers to basically “watch” the movement of objects in the sky, night after night. And the imagery will be available to anyone.
The LSST is being built by a group of institutions in the US, and even got some money from Bill Gates. It will be situated atop Cerro Pachon, a peak in Northern Chile. The Gemini South and Southern Astrophysical Research Telescopes are also situated there.
The Camera Inside the ‘Scope
At the heart of the LSST is its enormous digital camera. It weighs over three tons, and the sensor is segmented in a similar way that other Super Telescopes have segmented mirrors. The LSST’s camera is made up of 189 segments, which together create a camera sensor about 2 ft. in diameter, behind a lens that is over 5 ft. in diameter.
Each image that the LSST captures is 40 times larger than the full moon, and will measure 3.2 gigapixels. The camera will capture one of these wide-field images every 20 seconds, all night long. Every few nights, the LSST will give us an image of the entire available night sky, and it will do that for 10 years.
“The LSST survey will open a movie-like window on objects that change brightness, or move, on timescales ranging from 10 seconds to 10 years.” – LSST: FROM SCIENCE DRIVERS TO REFERENCE DESIGN AND ANTICIPATED DATA PRODUCTS
The LSST will capture a vast, movie-like image of over 40 billion objects. This will range from distant, enormous galaxies all the way down to Potentially Hazardous Objects as small as 140 meters in diameter.
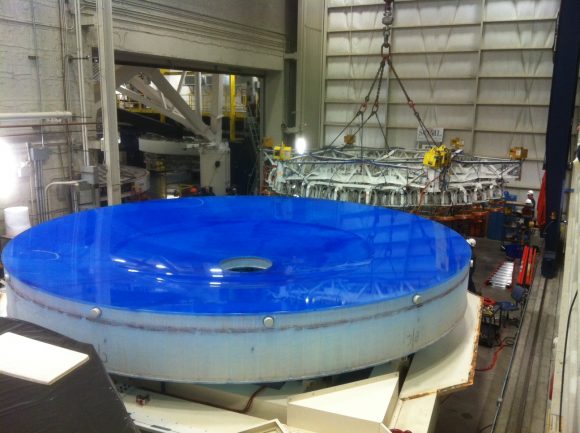
The primary-tertiay mirror at its construction facility. Image: LSST
There’s a whole other side to the LSST which is a little more challenging. We get the idea of an in-depth, moving, detailed image of the sky. That’s intuitively easy to engage with. But there’s another side, the data mining challenge.
The Data Challenge
The whole endeavour will create an enormous amount of data. Over 15 terabytes will have to be processed every night. Over its 10 year lifespan, it will capture 60 petabytes of data.
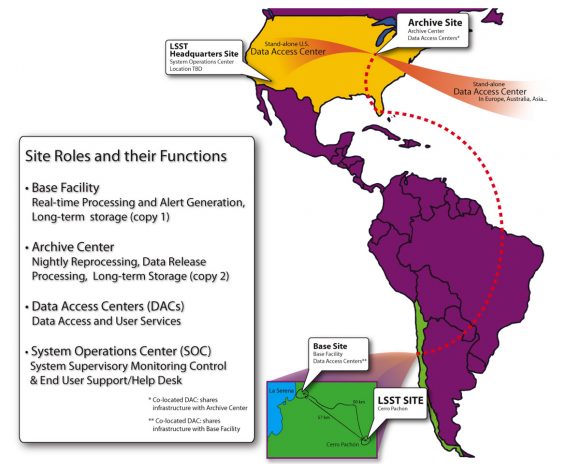
Once data is captured by the LSST, it will travel via two dedicated 40 GB lines to the Data Processing and Archive Center. That Center is a super-computing facility that will manage all the data and make it available to users. But when it comes to handling the data, that’s just the tip of the iceberg.
“LSST is a new way to observe, and gaining knowledge from the Big Data LSST delivers is indeed a challenge.” – Suzanne H. Jacoby, LSST
The sheer amount of data created by the LSST is a challenge that the team behind it saw coming. They knew they would have to build the capacity of the scientific community in advance, in order to get the most out of the LSST.
Handling all of the data from the LSST requires its own infrastructure. Image: LSST
As Suzanne Jacoby, from the LSST team, told Universe today, “To prepare the science community for LSST Operations, the LSST Corporation has undertaken an “Enabling Science” effort which funds the LSST Data Science Fellowship Program (DSFP). This two-year program is designed to supplement existing graduate school curriculum and explores topics including statistics, machine learning, information theory, and scalable programming.”
The Science
The Nature of Dark Matter and Understanding Dark Energy
Contributing to our understanding Dark Energy and Dark Matter is a goal of all of the Super Telescopes. The LSST will map several billion galaxies through time and space. It will help us understand how Dark Energy behaves over time, and how Dark Matter affects the development of cosmic structure.
Cataloging the Solar System
The raw imaging power of the LSST will be a game-changer for mapping and cataloguing our Solar System. It’s thought that the LSST could detect between 60-90% of all potentially hazardous asteroids (PHAs) larger than 140 meters in diameter, as far away as the main asteroid belt. This will not only contribute to NASA’s goal of identifying threats to Earth posed by asteroids, but will help us understand how planets formed and how our Solar System evolved.
Exploring the Changing Sky
The repeated imaging of the night sky, at great depth and with excellent image quality, should tell us a lot about supernovae, variable stars, and possible other events we haven’t even discovered yet. There are always surprising results whenever we build a new telescope or send a probe to a new destination. The LSST will probably be no different.
Milky Way Structure & Formation
The LSST will give us an unprecedented look at the Milky Way. It will survey over half of the sky, and will do so repeatedly. Hundreds of times, in fact. The end result will be an enormously detailed look at the motion of millions of stars in our galaxy.
Open Access
Perhaps the best part of the whole LSST project is that the all of the data will be available to everyone. Anyone with a computer and an internet connection will be able to access LSST’s movie of the Universe. It’s warm and fuzzy, to be sure, to have the results of large science endeavours like this available to anyone. But there’s more to it. The LSST team suspects that the majority of the discoveries resulting from its rich data will come from unaffiliated astronomers, students, and even amateurs.
It was designed from the ground up in this way, and there will be no delay or proprietary barriers when it comes to public data access. In fact, Google has signed on as a partner with LSST because of the desire for public access to the data. We’ve seen what Google has done with Google Earth and Google Sky. What will they come up with for Google LSST?
The Sloan Digital Sky Survey (SDSS), a kind of predecessor to the LSST, was modelled in the same way. All of its data was available to astronomers not affiliated with it, and out of over 6000 papers that refer to SDSS data, the large majority of them were published by astronomers not affiliated with SDSS.
First Light
We’ll have to wait a while for all of this to come our way, though. First light for the LSST won’t be until 2021, and it will begin its 10 year run in 2022. At that time, be ready for a whole new look at our Universe. The LSST will be a game-changer.
Special Guest:
Dr. Alan Stern is the Principal Investigator on the New Horizons mission. He will be joining us today to update everyone on what we now know about Pluto now that all of the New Horizons data have been received.
We use a tool called Trello to submit and vote on stories we would like to see covered each week, and then Fraser will be selecting the stories from there. Here is the link to the Trello WSH page (http://bit.ly/WSHVote), which you can see without logging in. If you’d like to vote, just create a login and help us decide what to cover!
If you would like to join the Weekly Space Hangout Crew, visit their site here and sign up. They’re a great team who can help you join our online discussions!
If you’d like to join Fraser and Paul Matt Sutter on their tour to Iceland in February, 2018, you can find the information at astrotouring.com.
If you would like to sign up for the AstronomyCast Solar Eclipse Escape, where you can meet Fraser and Pamela, plus WSH Crew and other fans, visit our site here and sign up!
We record the Weekly Space Hangout every Friday at 12:00 pm Pacific / 3:00 pm Eastern. You can watch us live on Universe Today, or the Universe Today YouTube page
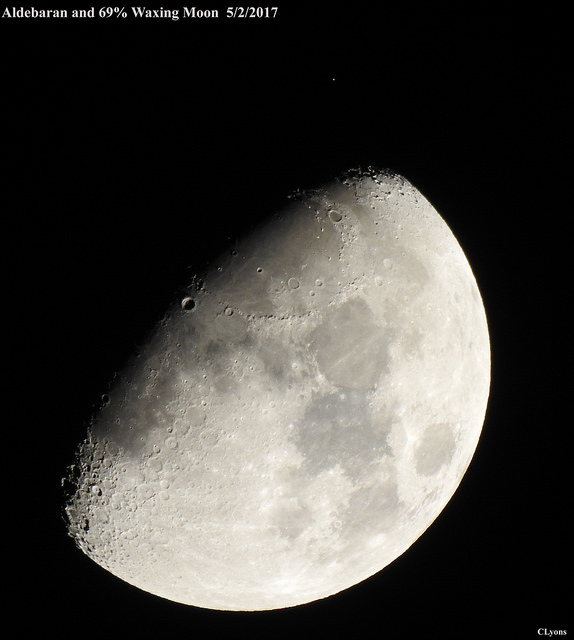
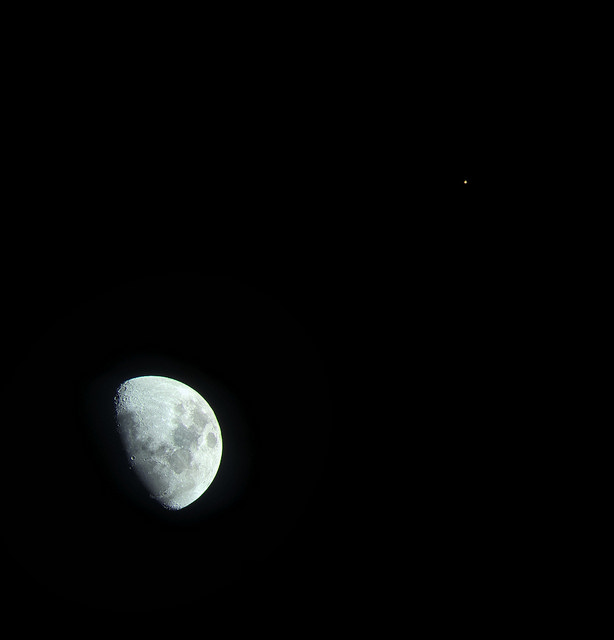
The Moon nearing Aldebaran on February 5th, 2017. Image credit and copyright: Chris Lyons.
The Moon nearing Aldebaran on February 5th, 2017. Image credit and copyright: Chris Lyons.
Ever watch the Moon cover up a star? There’s a great chance to see just such an event this coming weekend, when the waxing gibbous Moon occults (passes in front of) the bright star Aldebaran for much of North America on Saturday night, March 4th.
Shining at magnitude +0.85, Aldebaran is the brightest star that lies along the Moon’s path in the current epoch, and is one of four +1st magnitude stars that the Moon can occult. The other three are Regulus, Antares and Spica. This is the 29th in a series of 49 occultations of Aldebaran worldwide spanning from January 29th, 2015 to September 3rd, 2018, meaning Aldebaran hides behind the Moon once every lunation as it crosses through the constellation Taurus and the Hyades open star cluster in 2017. Like eclipses belonging to the same saros cycle, successive occultations of bright stars shift westward by about 120 degrees westward longitude and slowly drift to the north. Europe saw last month’s occultation of Aldebaran, and Asia is up next month on April 1st.
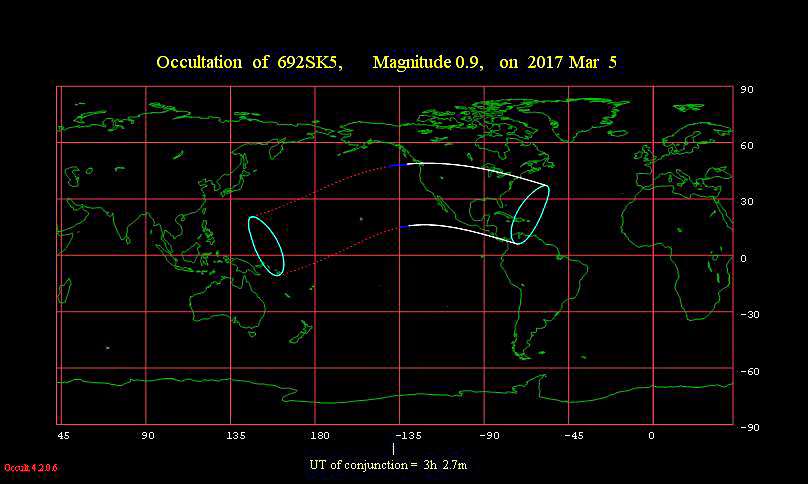
The occultation footprint for Saturday night’s event. Credit: Occult 4.2 software.
All of the contiguous ‘lower 48 states’ except northern New England see Saturday night’s occultation, and under dark skies, to boot. It’s a close miss for Canada. Mexico, central America and the Caribbean will also witness the event under dark skies. Hawaii will see the event under daytime skies. We can attest that this is indeed possible using binocs or a telescope, as we caught Aldebaran near the daytime Moon during last month’s event.
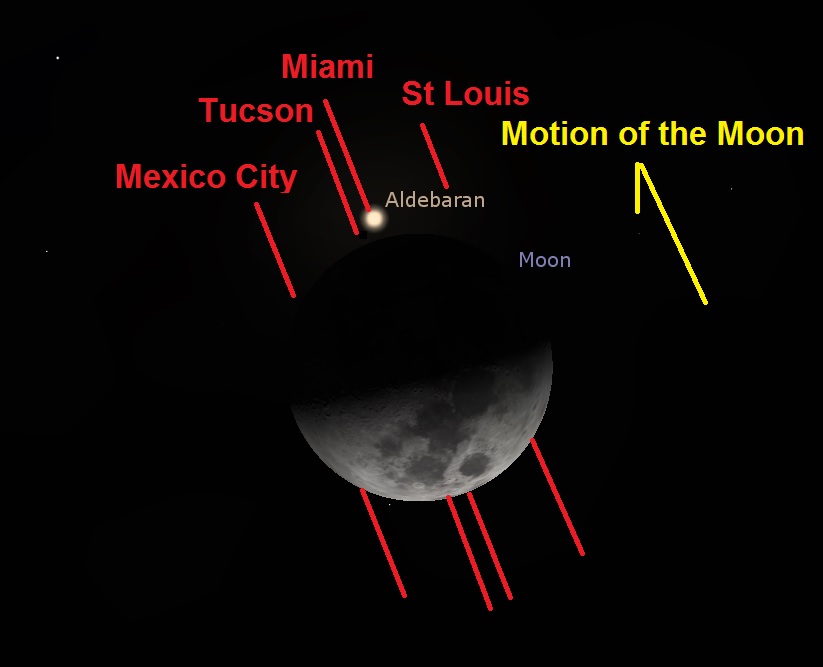
Occultations give us a chance to see a split second magic act, in a Universe that often unfolds over eons and epochs. The motion you’re seeing is mostly that of the Moon, and to a lesser extent, that of the Earth as the star abruptly ‘winks out’.
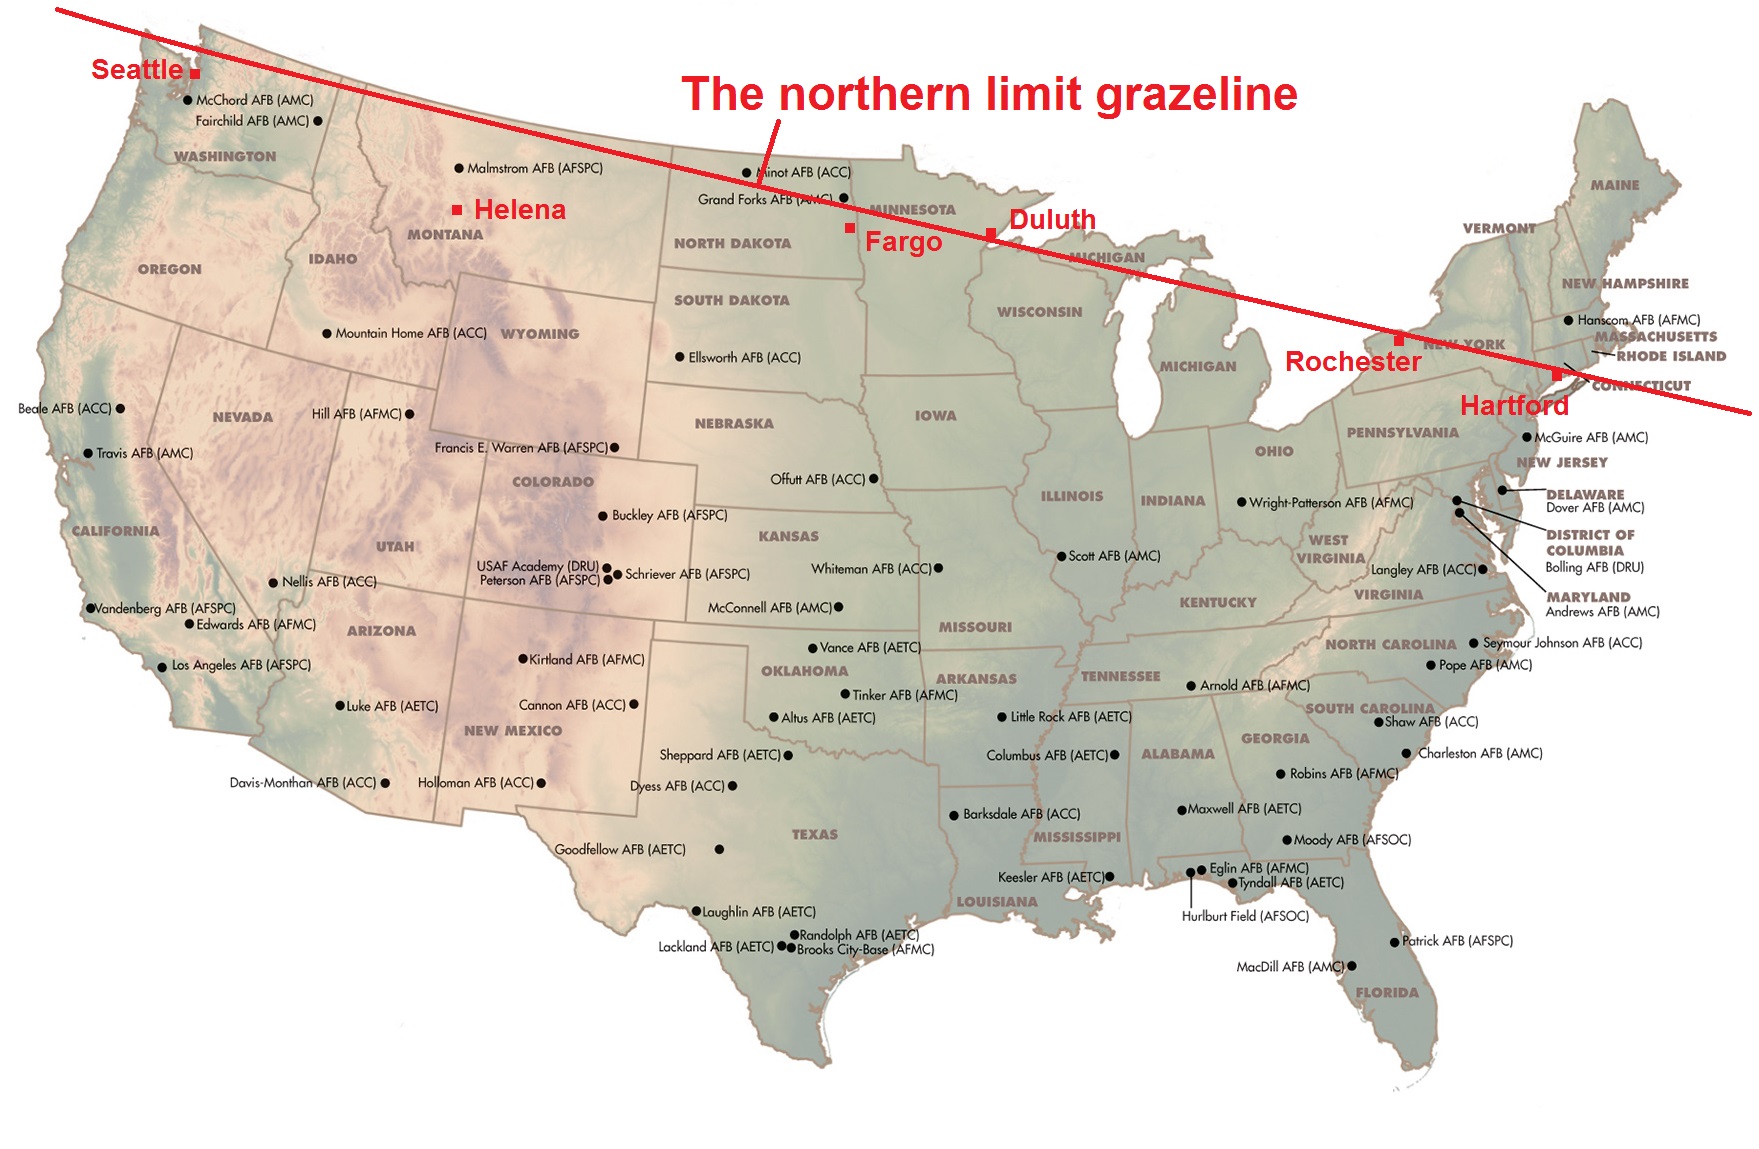
Observers in northern tier states might witness an additional spectacle, as Aldebaran grazes the northern limb of the Moon. This can make for an unforgettable sight, as the star successively winks in at out from behind lunar peaks and valleys. The graze line for Saturday night follows the U.S./Canadian border from Washington state, Idaho and Montana, then transects North Dakota, Minnesota just below Duluth and northern Wisconsin, Michigan and New York and Connecticut. Brad Timerson over at the international Occultation Timing Association has a good page set up for the circumstances for the grazing event, and the IOTA has a page detailing ingress (start) and egress times for the event for specific cities.
The northern limit grazeline for Saturday night’s occultation. Credit: USAF/Wikimedia Commons/Dave Dickinson
You’ll be able to see the occultation of Aldebaran with the unaided eye, no telescope over binocular needed, though it will be fun to follow along with optics as well. The ingress along the leading dark limb of the Moon is always more dramatic, while reemergence on the bright limb is a more subtle affair.
The path of the occultation for select cities. Credit: Stellarium.
A simple video aimed afocally through a telescope eyepiece can easily capture the event. We like to run WWV radio on AM shortwave in the background while video recording so as to get a good time hack of the event on audio. Finally, set up early, watch those battery levels in the frigid March night, and be sure to balance out your exposure times to capture both Aldebaran and the dazzling limb of the Moon.
Can you see it? The Moon paired with Aldebaran on February 5th. Image credit and copyright: Lucca Ruggiero.
Anyone Live-casting the event? It’ll be a tough one low to the horizon here in central Florida, but a livestream would certainly be possible for folks westward with Aldebaran and the Moon high in the sky. Let us know of any planned webcasts, and we’ll promote accordingly.
The Moon also occults several other bright stars this week, leading up to an occultation of Regulus on March 10th favoring the southern Atlantic. Read all about occultations, eclipses, comets and more in our free e-book, 101 Astronomical Events for 2017 from Universe Today.
Don’t miss Saturday night’s stunning occultation, and let us know of your tales of astronomical tribulation and triumph.
-Send those astro-images in to Universe Today’s Flickr forum, and you might just see ’em featured here in a future article.
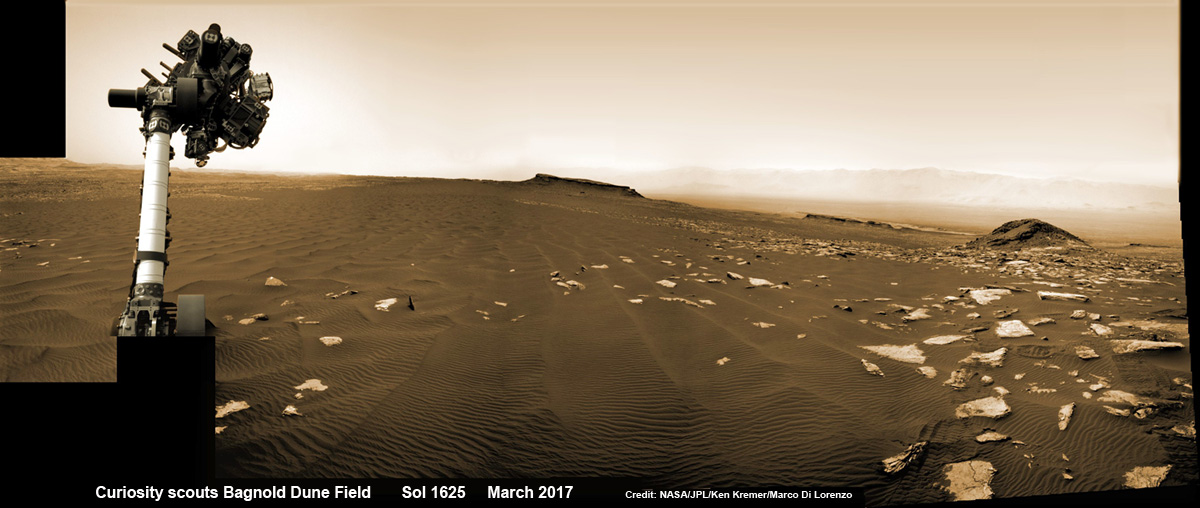
Curiosity rover raises robotic arm high while scouting the Bagnold Dune Field and observing dust devils inside Gale Crater on Mars on Sol 1625, Mar. 2, 2017, in this navcam camera mosaic stitched from raw images and colorized. Note: Wheel tracks at right, distant crater rim in background. Credit: NASA/JPL/Ken Kremer/kenkremer.com/Marco Di Lorenzo
Curiosity rover raises robotic arm high while scouting the Bagnold Dune Field and observing dust devils inside Gale Crater on Mars on Sol 1625, Mar. 2, 2017, in this navcam camera mosaic stitched from raw images and colorized. Note: Wheel tracks at right, distant crater rim in background. Credit: NASA/JPL/Ken Kremer/kenkremer.com/Marco Di Lorenzo
Tis a season of incredible wind driven activity on Mars like few before witnessed by our human emissaries ! Its summer on the Red Planet and the talented scientists directing NASA’s Curiosity rover have targeted the robots cameras so proficiently that they have efficiently spotted a multitude of ‘Dust Devils’ racing across across the dunes fields of Gale Crater– see below.
The ‘Dust Devils’ are actually mini tornadoes like those seen on Earth.
This sequence of images shows a dust-carrying whirlwind, called a dust devil, on lower Mount Sharp inside Gale Crater, as viewed by NASA’s Curiosity Mars Rover during the summer afternoon of Sol 1613 (Feb. 18, 2017). The navcam camera images are in pairs that were taken about 12 seconds apart, with an interval of about 90 seconds between pairs. Timing is accelerated and not fully proportional in this animation. Contrast has been modified to make frame-to-frame changes easier to see. A black frame provides a marker between repeats of the sequence. Credit: NASA/JPL-Caltech/TAMU
Furthermore they whip up the dust more easily in the lower gravity field on Mars compared to Earth. Mars gravity is about one third of Earth’s.
Right now it’s summer inside the rovers southern hemisphere landing site at Gale Crater. And summer is the windiest time of the Martian year.
“Dust devils are whirlwinds that result from sunshine warming the ground, prompting convective rising of air that has gained heat from the ground. Observations of Martian dust devils provide information about wind directions and interaction between the surface and the atmosphere,” as described by researchers.
So now is the best time to observe and photograph the dusty whirlwinds in action as they flitter amazingly across the craters surface carrying dust in their wake.
This sequence of images shows a dust-carrying whirlwind, called a dust devil, scooting across ground inside Gale Crater, as observed on the local summer afternoon of NASA’s Curiosity Mars Rover’s 1,597th Martian day, or sol (Feb. 1, 2017). Set within a broader southward view from the rover’s Navigation Camera, the rectangular area outlined in black was imaged multiple times over a span of several minutes to check for dust devils. Images from the period with most activity are shown in the inset area. The images are in pairs that were taken about 12 seconds apart, with an interval of about 90 seconds between pairs. Timing is accelerated in this animation. Credits: NASA/JPL-Caltech/TAMU
Therefore researchers are advantageously able to utilize Curiosity in a new research campaign that “focuses on modern wind activity in Gale” on the lower slope of Mount Sharp — a layered mountain inside the crater.
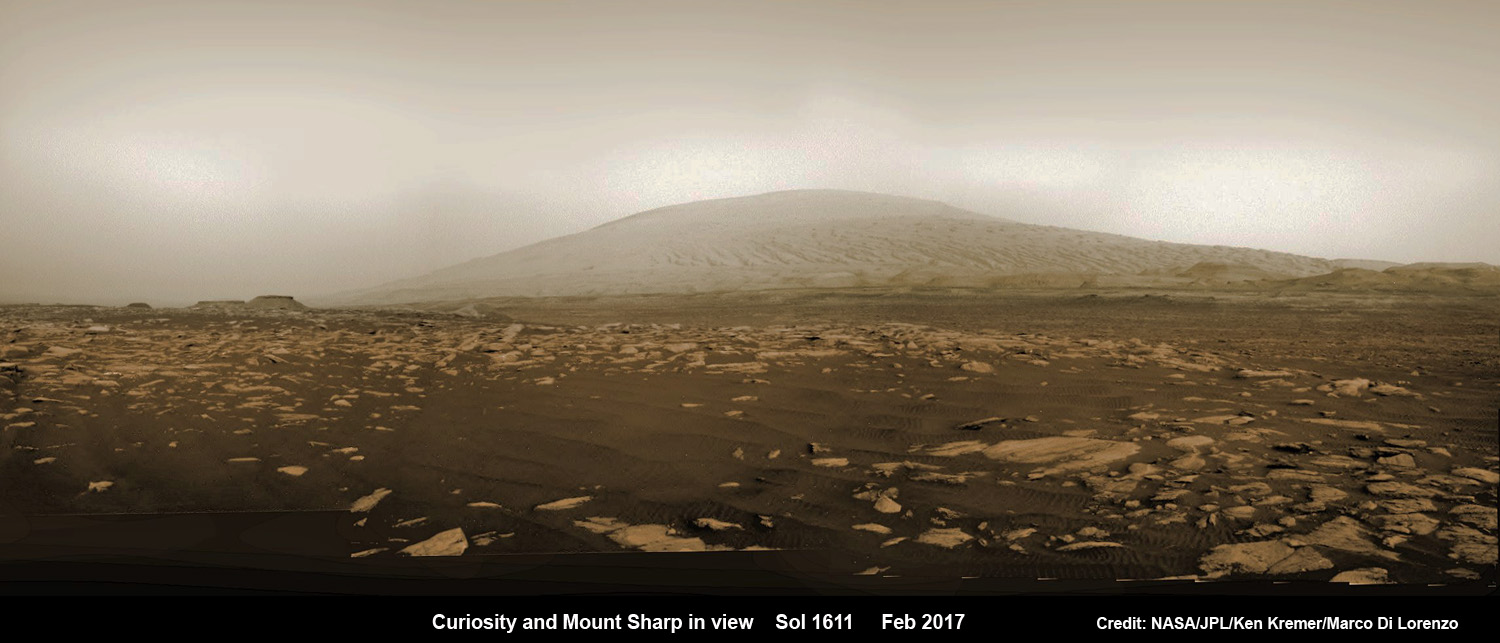
NASA’s Curiosity rover explores sand dunes inside Gale Crater with Mount Sharp in view on Mars on Sol 1611, Feb. 16, 2017, in this navcam camera mosaic stitched from raw images and colorized. Credit: NASA/JPL/Ken Kremer/kenkremer.com/Marco Di Lorenzo
Indeed, this past month Curiosity began her second sand dune campaign focusing on investigating active dunes on the mountain’s northwestern flank that are ribbon-shaped linear dunes.
“In these linear dunes, the sand is transported along the ribbon pathway, while the ribbon can oscillate back and forth, side to side,” said Nathan Bridges, a Curiosity science team member at the Johns Hopkins University Applied Physics Laboratory in Laurel, Maryland, in a statement.
The left side of this 360-degree panorama from NASA’s Curiosity Mars rover shows the long rows of ripples on a linear shaped dune in the Bagnold Dune Field on the northwestern flank of Mount Sharp. The rover’s Navigation Camera recorded the component images of this mosaic on Feb. 5, 2017. Credits: NASA/JPL-Caltech
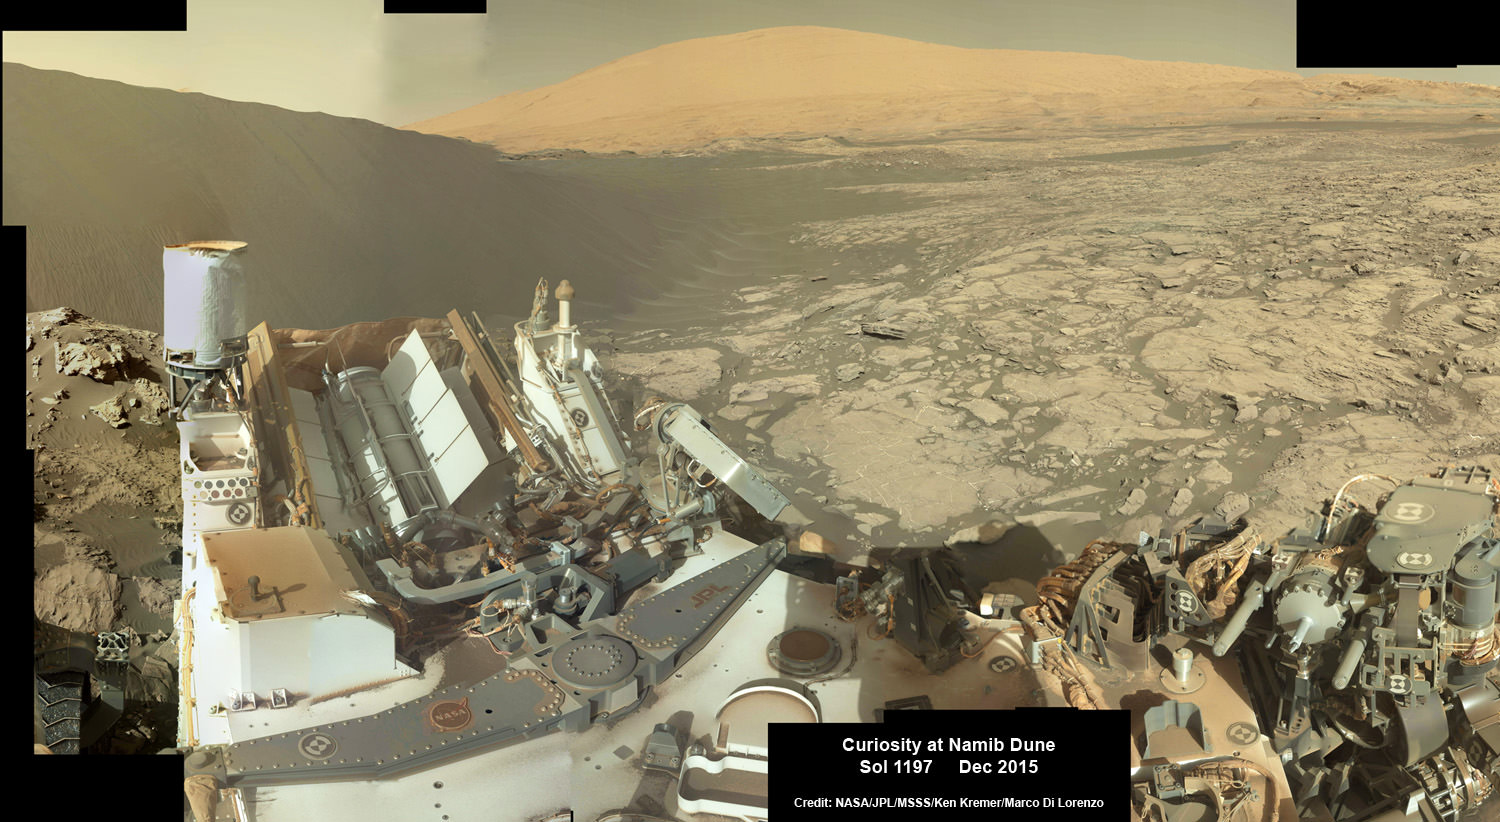
These new dunes are different from those investigated during the first dune campaign back in late 2015 and early 2016 that examined crescent-shaped dunes, including Namib Dune in our mosaic below.
The initial dune campaign actually involved the first ever up-close study of active sand dunes anywhere other than Earth, as I reported at the time.
Curiosity explores Red Planet paradise at Namib Dune during Christmas 2015 – backdropped by Mount Sharp. Curiosity took first ever self-portrait with Mastcam color camera after arriving at the lee face of Namib Dune. This photo mosaic shows a portion of the full self portrait and is stitched from Mastcam color camera raw images taken on Sol 1197, Dec. 19, 2015. Credit: NASA/JPL/MSSS/Ken Kremer/kenkremer.com/Marco Di Lorenzo
By snapping a series of targeted images pointed in just the right direction using the rovers mast mounted navigation cameras, or navcams, the researchers have composed a series of ‘Dust Devil’ movies – gathered together here for your enjoyment.
“We’re keeping Curiosity busy in an area with lots of sand at a season when there’s plenty of wind blowing it around,” said Curiosity Project Scientist Ashwin Vasavada of NASA’s Jet Propulsion Laboratory, Pasadena, California.
“One aspect we want to learn more about is the wind’s effect on sorting sand grains with different composition. That helps us interpret modern dunes as well as ancient sandstones.”
The movies amply demonstrate that Mars is indeed an active world and winds are by far the dominant force shaping and eroding the Red Planets alien terrain – despite the thin atmosphere less than 1 percent of Earth’s.
Indeed scientists believe that wind erosion over billions of years of time is what caused the formation of Mount Sharp at the center of Gale Crater by removing vast amounts of dust and sedimentary material — about 15,000 cubic miles (64,000 cubic kilometers) — as Mars evolved from a wet world to the dry, desiccated planet we see today.
Gale crater was originally created over 3.6 billion years ago when a gigantic asteroid or comet smashed into Mars. The devastating impact “excavated a basin nearly 100 miles (160 kilometers) wide. Sediments including rocks, sand and silt later filled the basin, some delivered by rivers that flowed in from higher ground surrounding Gale.”
Winds gradually carved away so much sediment and dirt that we are left with the magnificent mountain in view today.
The whirlwinds called “dust devils” have been recorded moving across terrain in the crater, in sequences of afternoon images taken several seconds apart.
The contrast has been enhanced to better show the dust devils in action.
Watch this short NASA video showing Martian Dust Devils seen by Curiosity:
Video Caption: Dust Devils On Mars Seen by NASA’s Curiosity Rover. On recent summer afternoons on Mars, navigation cameras aboard NASA’s Curiosity Mars rover observed several whirlwinds carrying Martian dust across Gale Crater. Dust devils result from sunshine warming the ground, prompting convective rising of air. All the dust devils were seen in a southward direction from the rover. Timing is accelerated and contrast has been modified to make frame-to-frame changes easier to see. Credit: NASA/JPL
The team is also using the probes downward-looking Mars Descent Imager (MARDI) camera for a straight down high resolution up-close view looking beneath the rover. The purpose is to check for daily movement of the dunes she is sitting on to see “how far the wind moves grains of sand in a single day’s time.”
This pair of images shows effects of one Martian day of wind blowing sand underneath NASA’s Curiosity Mars rover on a non-driving day for the rover. Each image was taken just after sundown by the rover’s downward-looking Mars Descent Imager (MARDI). The area of ground shown in the images spans about 3 feet (about 1 meter) left-to-right. The images were taken on Jan. 23, 2017 (Sol 1587) and Jan. 24, 2017 (Sol 1588). The day-apart images by MARDI were taken as a part of investigation of wind’s effects during Martian summer, the windiest time of year in Gale Crater. Credit: NASA/JPL-Caltech/MSSS
These dune investigations have to be done now, because the six wheeled robot will soon ascend Mount Sharp, the humongous layered mountain at the center of Gale Crater.
Ascending and diligently exploring the sedimentary lower layers of Mount Sharp, which towers 3.4 miles (5.5 kilometers) into the Martian sky, is the primary destination and goal of the rovers long term scientific expedition on the Red Planet.
“Before Curiosity heads farther up Mount Sharp, the mission will assess movement of sand particles at the linear dunes, examine ripple shapes on the surface of the dunes, and determine the composition mixture of the dune material,” researchers said.
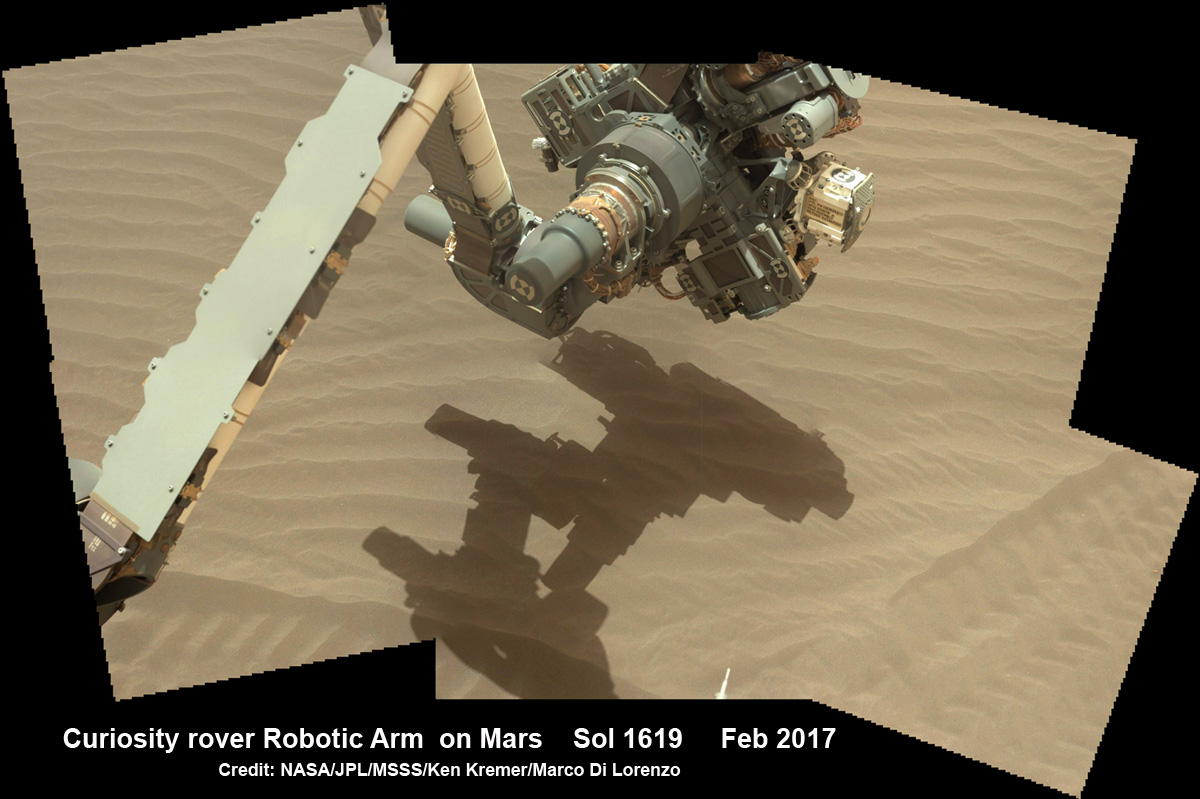
NASA’s Curiosity rover extends robotic arm to investigate sand dunes inside Gale Crater on Mars on Sol 1619, Feb. 24, 2017. Credit: NASA/JPL/MSSS/Ken Kremer/kenkremer.com/Marco Di Lorenzo
Curiosity is also using the science instruments on the robotic arm turret to gather detailed research measurements with the cameras and spectrometers.
As of today, Sol 1625, March 2, 2017, Curiosity has driven over 9.70 miles (15.61 kilometers) since its August 2012 landing inside Gale Crater, and taken over 391,000 amazing images.
Stay tuned here for Ken’s continuing Earth and planetary science and human spaceflight news.
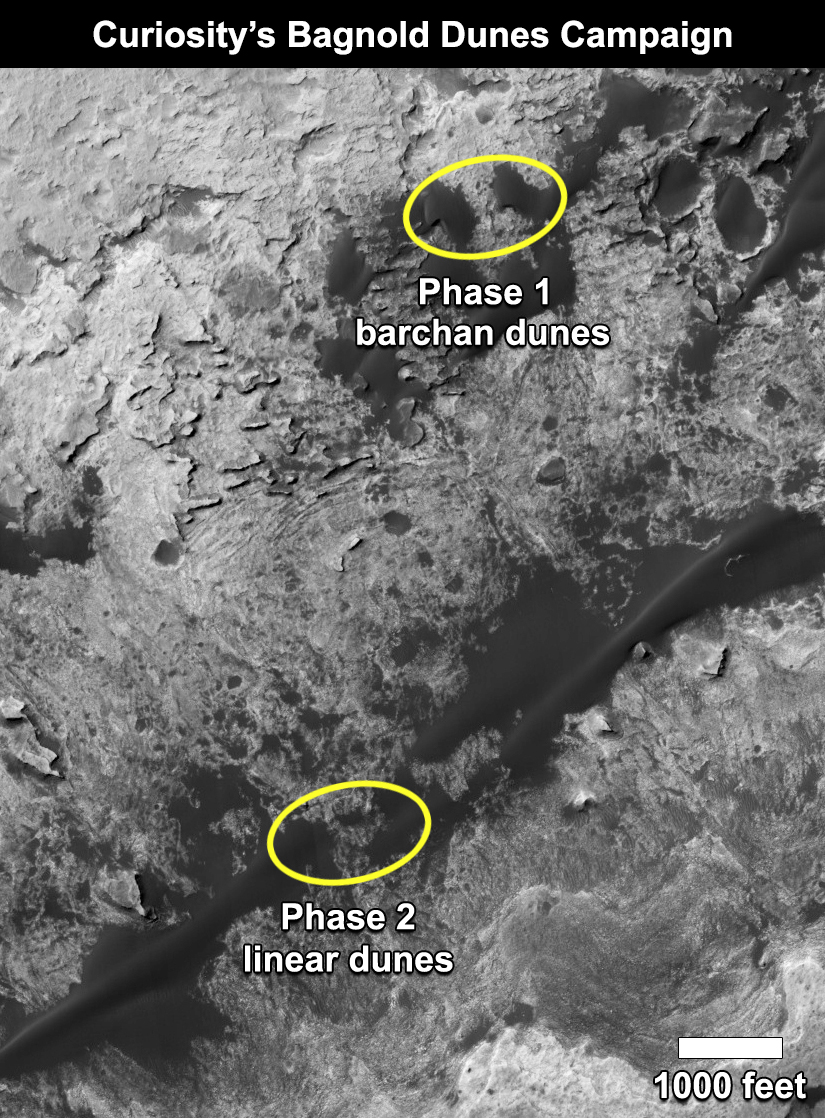
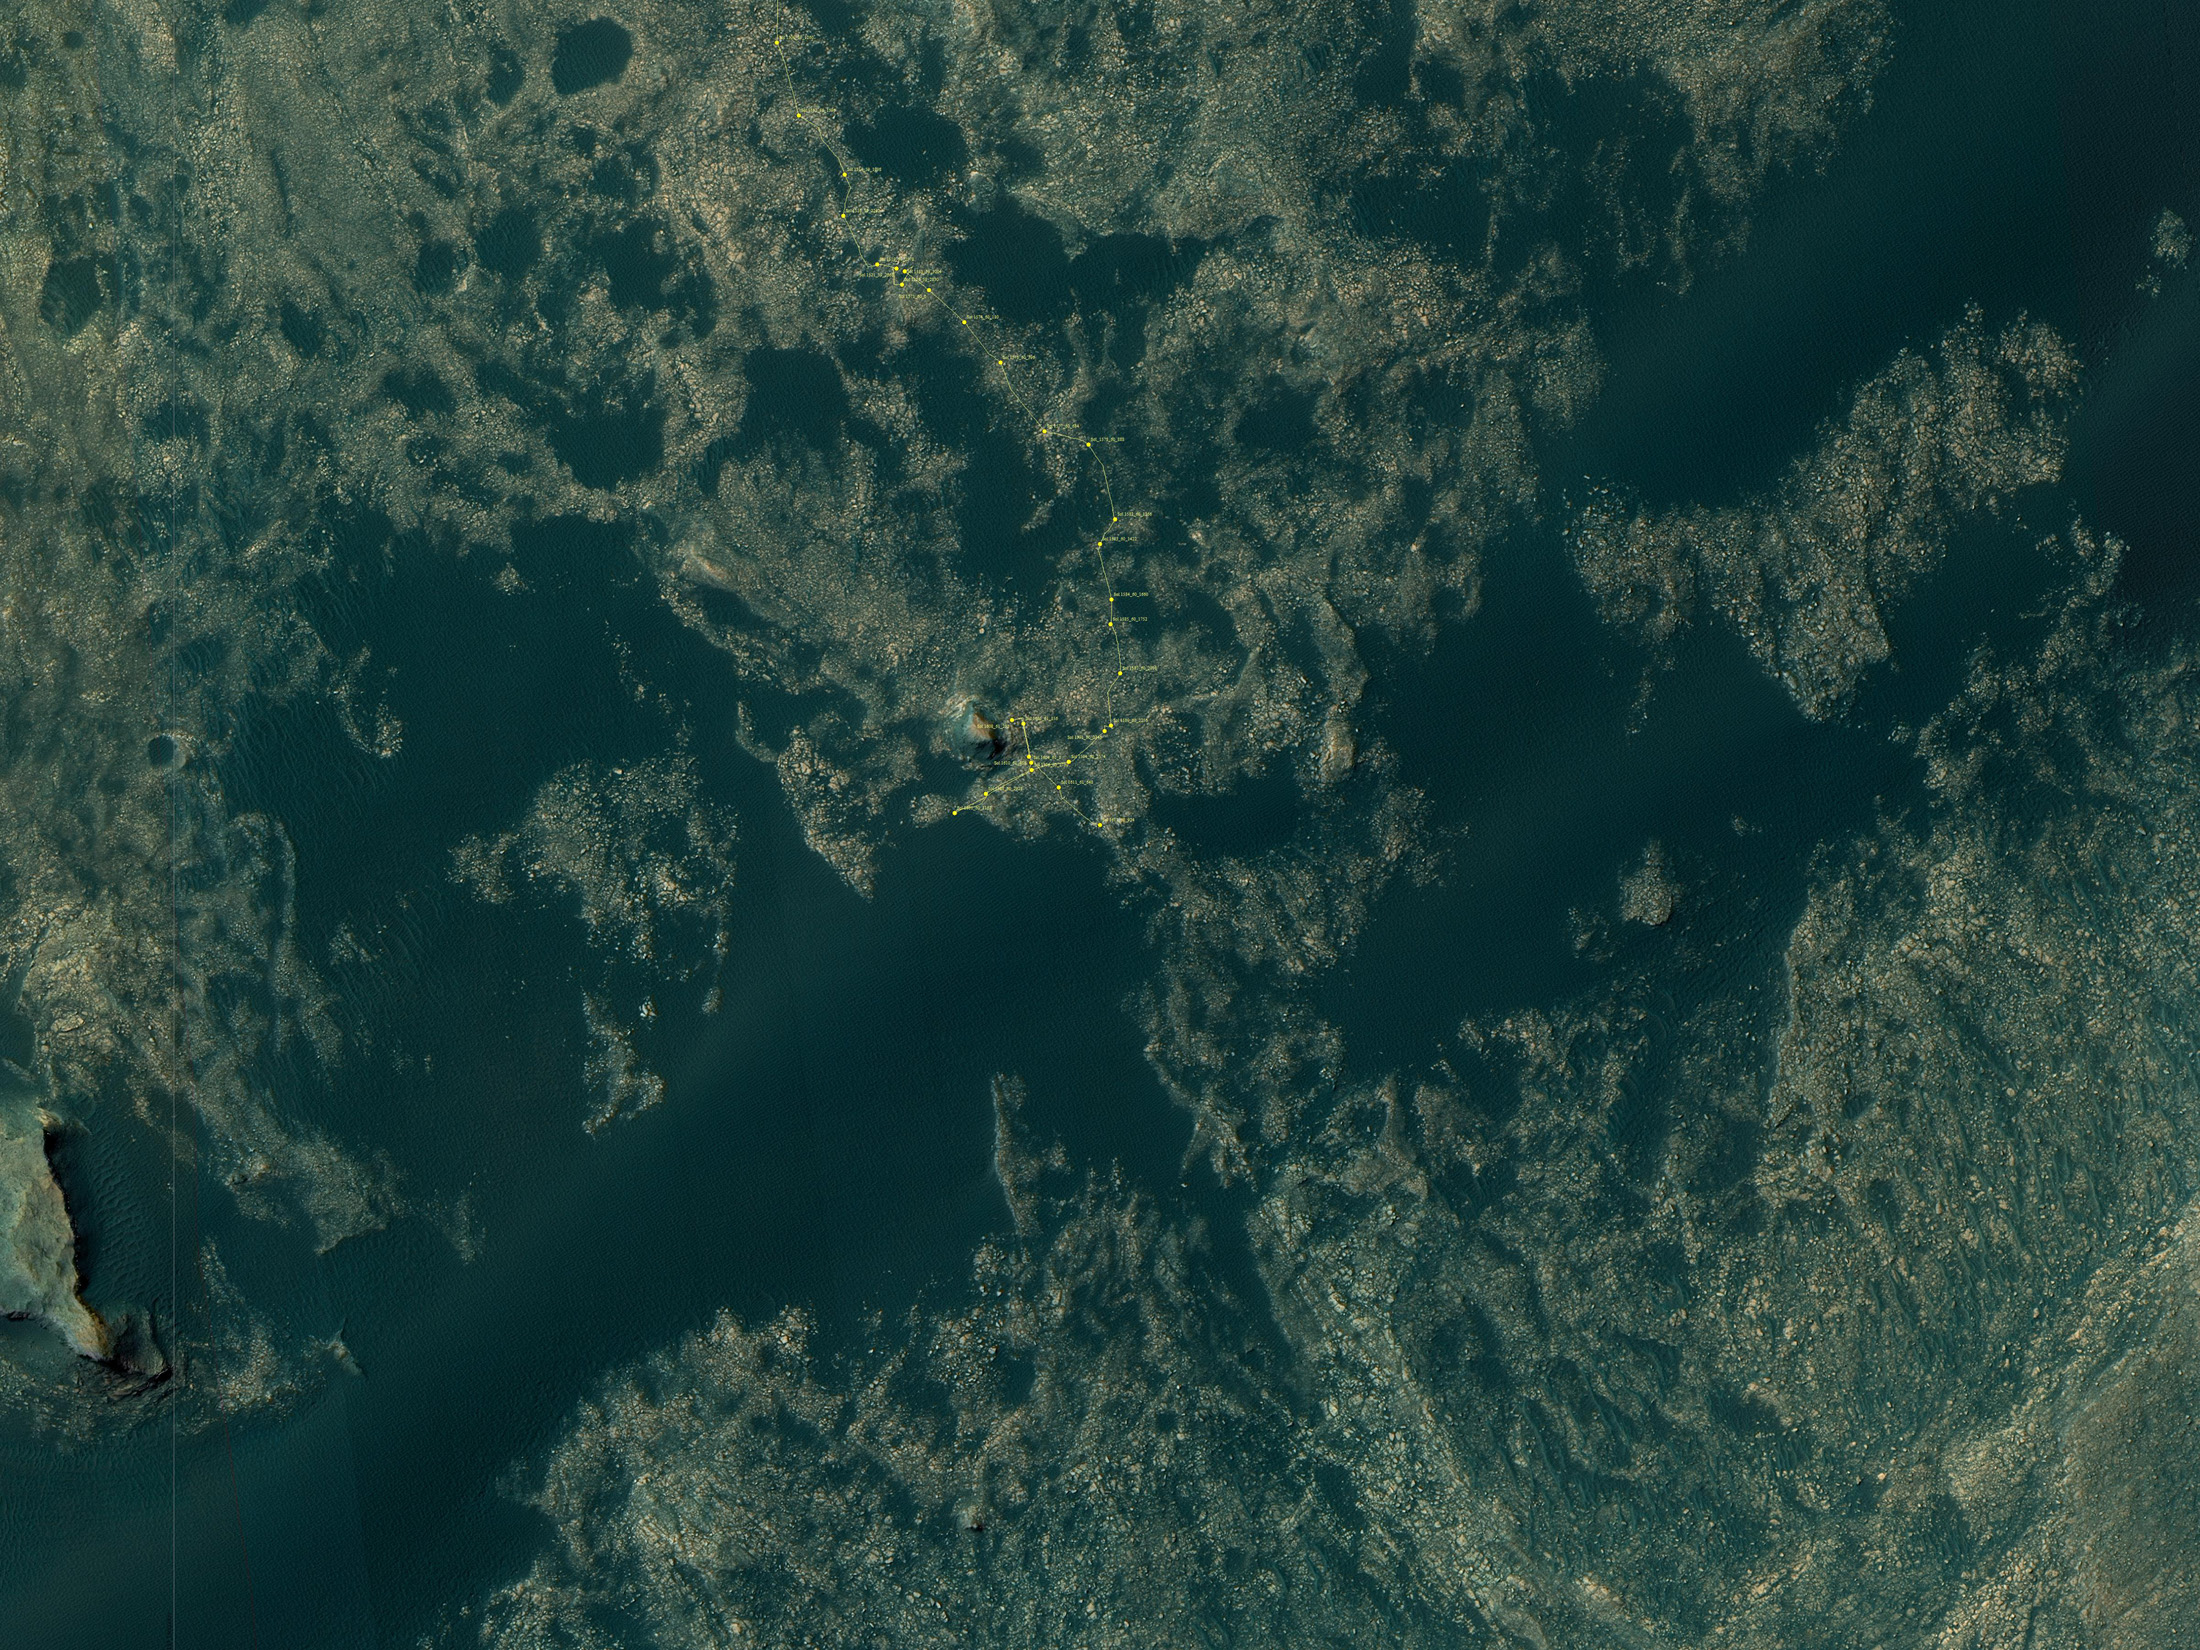
This map shows the two locations of a research campaign by NASA’s Curiosity Mars rover mission to investigate active sand dunes on Mars. In late 2015, Curiosity reached crescent-shaped dunes, called barchans. In February 2017, the rover reached a location where the dunes are linear in shape. Credits: NASA/JPL-Caltech/Univ. of ArizonaThis map shows the route driven by NASA’s Mars rover Curiosity through Sol 1612 (February 17, 2017) of the rover’s mission on Mars. The base image from the map is from the High Resolution Imaging Science Experiment Camera (HiRISE) in NASA’s Mars Reconnaissance Orbiter. Image Credit: NASA/JPL-Caltech/Univ. of Arizona
Artist's conception of a terraformed Mars. Credit: Ittiz/Wikimedia Commons
This week, NASA’s Planetary Science Division (PSD) hosted a community workshop at their headquarters in Washington, DC. Known as the “Planetary Science Vision 2050 Workshop“, this event ran from February 27th to March 1st, and saw scientists and researchers from all over the world descend on the capitol to attend panel discussions, presentations, and talks about the future of space exploration.
One of the more intriguing presentations took place on Wednesday, March 1st, where the exploration of Mars by human astronauts was discussed. In the course of the talk, which was titled “A Future Mars Environment for Science and Exploration“, Director Jim Green discussed how deploying a magnetic shield could enhance Mars’ atmosphere and facilitate crewed missions there in the future.
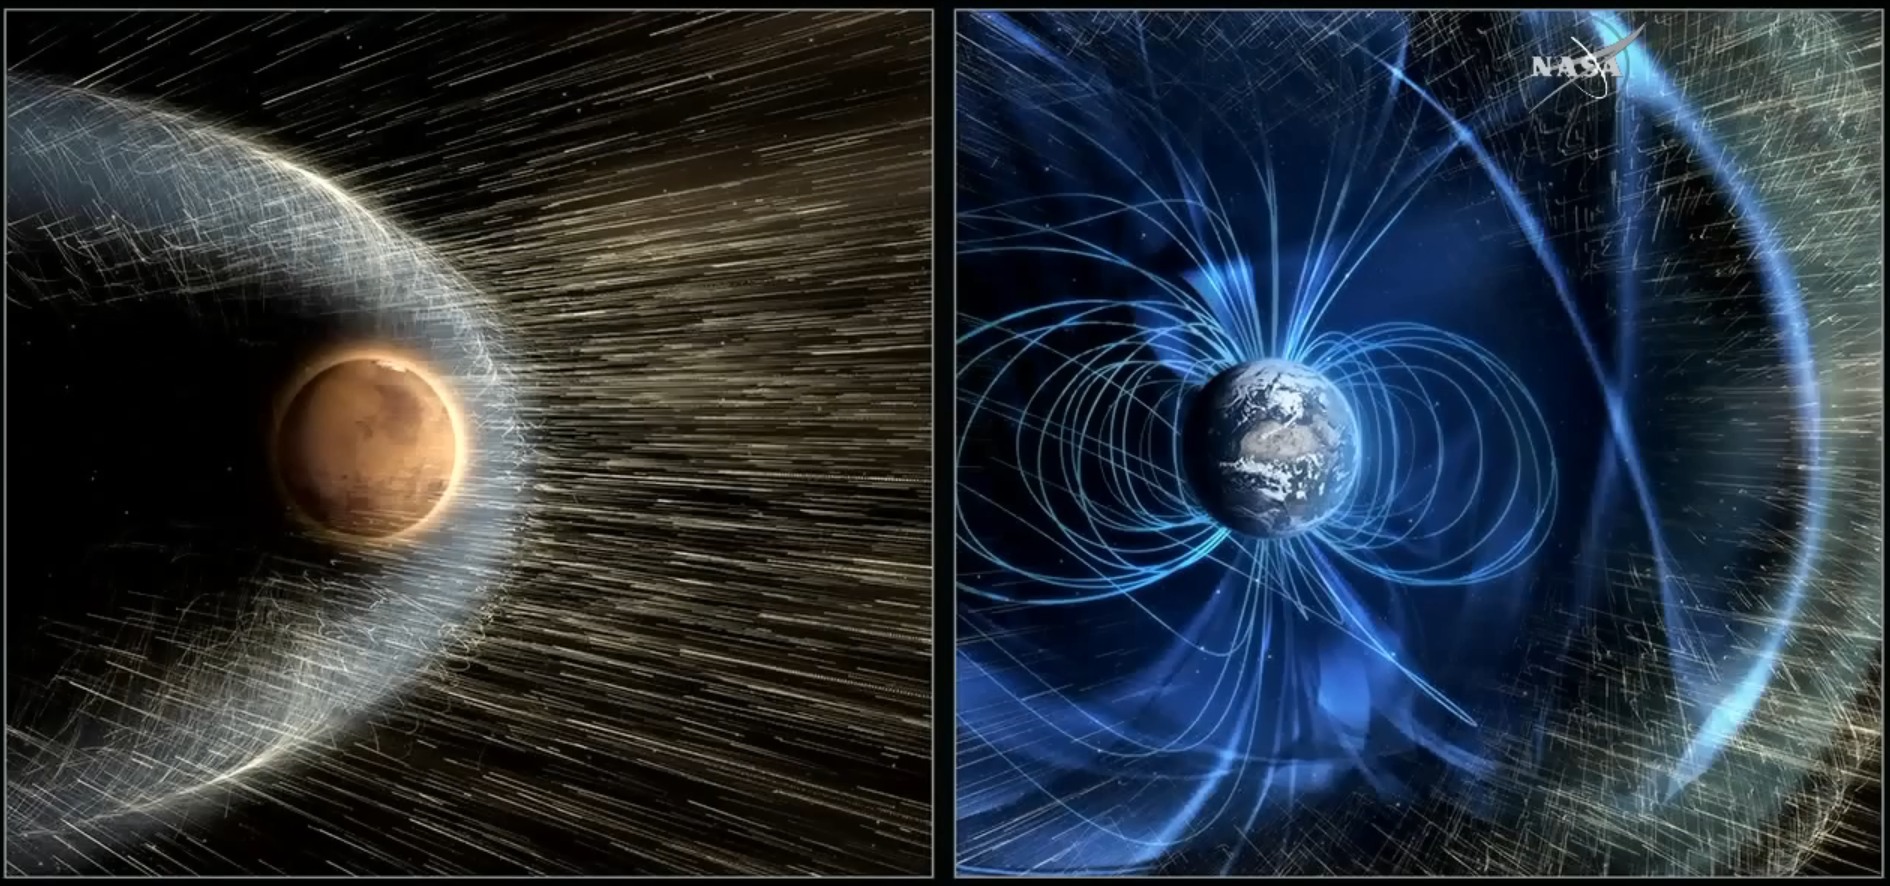
The current scientific consensus is that, like Earth, Mars once had a magnetic field that protected its atmosphere. Roughly 4.2 billion years ago, this planet’s magnetic field suddenly disappeared, which caused Mars’ atmosphere to slowly be lost to space. Over the course of the next 500 million years, Mars went from being a warmer, wetter environment to the cold, uninhabitable place we know today.
Artist’s rendering of a solar storm hitting Mars and stripping ions from the planet’s upper atmosphere. Credits: NASA/GSFC
This theory has been confirmed in recent years by orbiters like the ESA’s Mars Express and NASA’s Mars Atmosphere and Volatile EvolutioN Mission (MAVEN), which have been studying the Martian atmosphere since 2004 and 2014, respectively. In addition to determining that solar wind was responsible for depleting Mars’ atmosphere, these probes have also been measuring the rate at which it is still being lost today.
Without this atmosphere, Mars will continue to be a cold, dry place where life cannot flourish. In addition to that, future crewed mission – which NASA hopes to mount by the 2030s – will also have to deal with some severe hazards. Foremost among these will be exposure to radiation and the danger of asphyxiation, which will pose an even greater danger to colonists (should any attempts at colonization be made).
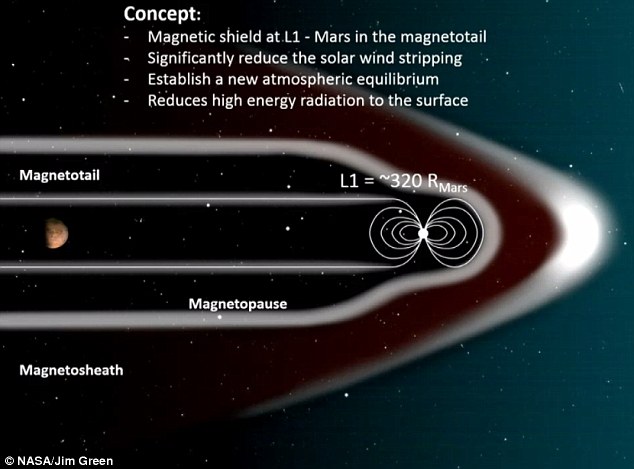
In answer to this challenge, Dr. Jim Green – the Director of NASA’s Planetary Science Division – and a panel of researchers presented an ambitious idea. In essence, they suggested that by positioning a magnetic dipole shield at the Mars L1 Lagrange Point, an artificial magnetosphere could be formed that would encompass the entire planet, thus shielding it from solar wind and radiation.
Naturally, Green and his colleagues acknowledged that the idea might sounds a bit “fanciful”. However, they were quick to emphasize how new research into miniature magnetospheres (for the sake of protecting crews and spacecraft) supports this concept:
“This new research is coming about due to the application of full plasma physics codes and laboratory experiments. In the future it is quite possible that an inflatable structure(s) can generate a magnetic dipole field at a level of perhaps 1 or 2 Tesla (or 10,000 to 20,000 Gauss) as an active shield against the solar wind.”
The proposed method for creating an artificial magnetic dipole at Mars’ L1 Lagrange Point. Credit: NASA/J.Green
In addition, the positioning of this magnetic shield would ensure that the two regions where most of Mars’ atmosphere is lost would be shielded. In the course of the presentation, Green and the panel indicated that these the major escape channels are located, “over the northern polar cap involving higher energy ionospheric material, and 2) in the equatorial zone involving a seasonal low energy component with as much as 0.1 kg/s escape of oxygen ions.”
To test this idea, the research team – which included scientists from Ames Research Center, the Goddard Space Flight Center, the University of Colorado, Princeton University, and the Rutherford Appleton Laboratory – conducted a series of simulations using their proposed artificial magnetosphere. These were run at the Coordinated Community Modeling Center (CCMC), which specializes in space weather research, to see what the net effect would be.
What they found was that a dipole field positioned at Mars L1 Lagrange Point would be able to counteract solar wind, such that Mars’ atmosphere would achieve a new balance. At present, atmospheric loss on Mars is balanced to some degree by volcanic outpassing from Mars interior and crust. This contributes to a surface atmosphere that is about 6 mbar in air pressure (less than 1% that at sea level on Earth).
As a result, Mars atmosphere would naturally thicken over time, which lead to many new possibilities for human exploration and colonization. According to Green and his colleagues, these would include an average increase of about 4 °C (~7 °F), which would be enough to melt the carbon dioxide ice in the northern polar ice cap. This would trigger a greenhouse effect, warming the atmosphere further and causing the water ice in the polar caps to melt.
At one time, Mars had a magnetic field similar to Earth, which prevented its atmosphere from being stripped away. Credit: NASA
By their calculations, Green and his colleagues estimated that this could lead to 1/7th of Mars’ oceans – the ones that covered it billions of years ago – to be restored. If this is beginning to sound a bit like a lecture on how to terraform Mars, it is probably because these same ideas have been raised by people who advocating that very thing. But in the meantime, these changes would facilitate human exploration between now and mid-century.
“A greatly enhanced Martian atmosphere, in both pressure and temperature, that would be enough to allow significant surface liquid water would also have a number of benefits for science and human exploration in the 2040s and beyond,” said Green. “Much like Earth, an enhanced atmosphere would: allow larger landed mass of equipment to the surface, shield against most cosmic and solar particle radiation, extend the ability for oxygen extraction, and provide “open air” greenhouses to exist for plant production, just to name a few.”
These conditions, said Green and his colleagues, would also allow for human explorers to study the planet in much greater detail. It would also help them to determine the habitability of the planet, since many of the signs that pointed towards it being habitable in the past (i.e. liquid water) would slowly seep back into the landscape. And if this could be achieved within the space of few decades, it would certainly help pave the way for colonization.
In the meantime, Green and his colleagues plan to review the results of these simulations so they can produce a more accurate assessment of how long these projected changes would take. It also might not hurt to conduct some cost-assessments of this magnetic shield. While it might seem like something out of science fiction, it doesn’t hurt to crunch the numbers!
Stay tuned for more stories from the Planetary Science Vision 2050 Workshop!