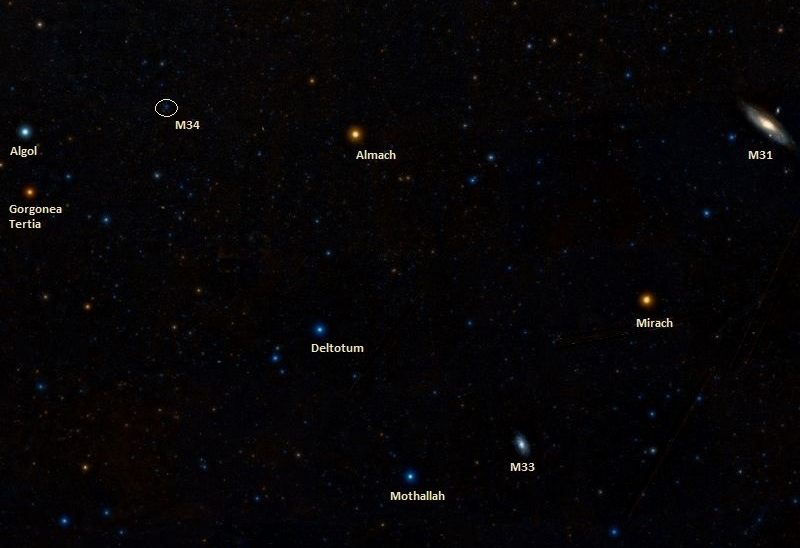
The location of Messier 34 in the northern skies. Credit: Wikisky
Welcome back to Messier Monday! In our ongoing tribute to the great Tammy Plotner, we take a look at the Triangulum Galaxy, also known as Messier 33. Enjoy!
During the 18th century, famed French astronomer Charles Messier noted the presence of several “nebulous objects” in the night sky. Having originally mistaken them for comets, he began compiling a list of them so that others would not make the same mistake he did. In time, this list (known as the Messier Catalog) would come to include 100 of the most fabulous objects in the night sky.
One of these objects is known as Messier 34, an open star cluster located in the northern Perseus constellation. Located at a distance of about 1,500 light years from Earth, it is one of the closest Messier objects to Earth, and is home to an estimated 400 stars. It is also bright enough to be seen with the naked eye or binoculars, where light conditions permit.
What You Are Looking At:
This cluster of stars started its journey off together through our galaxy some 180 million years ago as part of the “Local Association”… groups of stars like the Pleiades, Alpha Persei Cluster and the Delta Lyrae Cluster that share a common origin, but have become gravitationally unbound and are still moving together through space. We know the stars are related by their common movement and ages, but what else do we know about them?
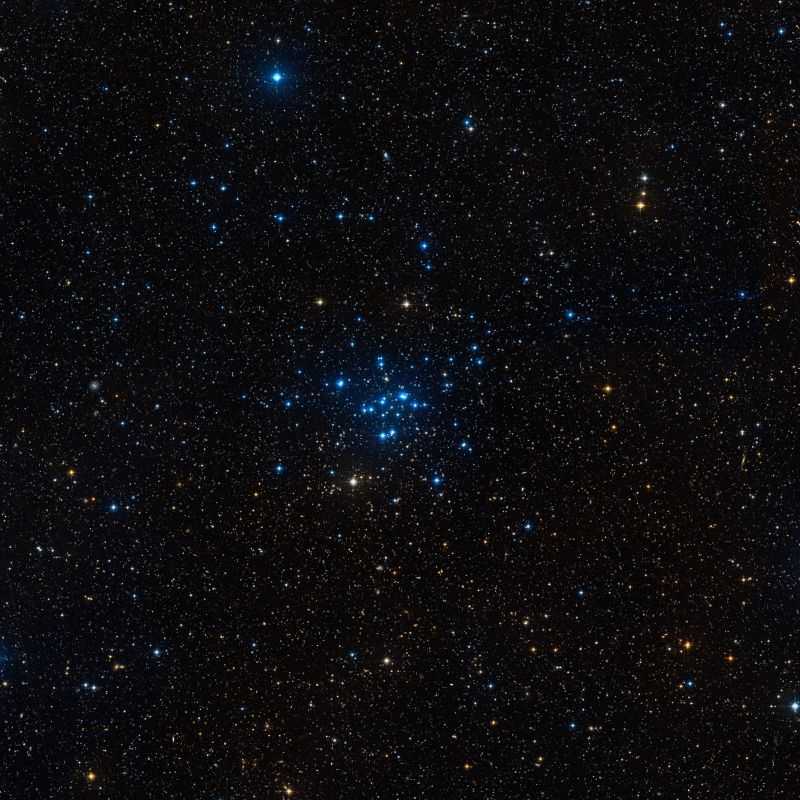
The core region of the Messier 34 open star cluster. Credit: Wikisky
Well, one thing we do know is that out of the 354 stars in the region survey, 89 of them are actual cluster members and that all six of the visual binaries and three of the four known Ap stars are members of the cluster. There’s even a giant among them! But like almost all stars out there, we know they usually aren’t singles and actually have companions. As Theodore Simon wrote in his 2000 study regarding NGC 1039 and NGC 3532:
“Roughly half the sources detected in both images have likely optical counterparts from earlier ground-based surveys. The remainder are either prospective cluster members or foreground/background stars, which can be decided only through additional photometry, spectroscopy, and proper-motion studies. There is some indication (at the 98% confidence level) that solar-type stars may lack the extreme rotation and activity levels shown by those in the much younger Pleiades and alpha Persei clusters, but a detailed assessment of the coronal X-ray properties of these clusters must await more sensitive observations in the future. If confirmed, this finding could help to rule out the possibility that stellar dynamo activity and rotational braking are controlled by a rapidly spinning central core as stars pass through this phase of evolution from the Pleiades stage to that represented by the Hyades.”
If there’s companion stars to be discovered, what else might be in the field that we just can quite “see”? Try white dwarfs. As Kate Rubin (et al.) published in the May 2008 issue of the Astronomical Journal:
“We present the first detailed photometric and spectroscopic study of the white dwarfs (WDs) in the field of the ~225 Myr old (log ?cl = 8.35) open cluster NGC 1039 (M34) as part of the ongoing Lick-Arizona White Dwarf Survey. Using wide-field UBV imaging, we photometrically select 44 WD candidates in this field. We spectroscopically identify 19 of these objects as WDs; 17 are hydrogen-atmosphere DA WDs, one is a helium-atmosphere DB WD, and one is a cool DC WD that exhibits no detectable absorption lines. Of the 17 DAs, five are at the approximate distance modulus of the cluster. Another WD with a distance modulus 0.45 mag brighter than that of the cluster could be a double-degenerate binary cluster member, but is more likely to be a field WD. We place the five single cluster member WDs in the empirical initial-final mass relation and find that three of them lie very close to the previously derived linear relation; two have WD masses significantly below the relation. These outliers may have experienced some sort of enhanced mass loss or binary evolution; however, it is quite possible that these WDs are simply interlopers from the field WD population.”
Close-up image of M34 showing its white dwarf population, taken by the Sloan Digital Sky Survey. Credit: SDSS
While it sounds a little confusing, it’s all about how star clusters evolve. As David Soderblom wrote in a 2001 study:
“We analyze Keck Hires observations of rotation in F, G, and K dwarf members of the open cluster M34 (NGC 1039), which is 250 Myr old, and we compare them to the Pleiades, Hyades, and NGC 6475. The upper bound to rotation seen in M34 is about a factor of two lower than for the 100 Myr-old Pleiades, but most M34 stars are well below this upper bound, and it is the overall convergence in rotation rates that is most striking. A few K dwarfs in M34 are still rapid rotators, suggesting that they have undergone core-envelope decoupling, followed by replenishment of surface angular momentum from an internal reservoir. Our comparison of rotation in these clusters indicates that the time scale for the coupling of the envelope to the core must be close to 100 Myr if decoupling does, in fact, occur.”
History of Observation:
M34 was probably first found by Giovanni Batista Hodierna before 1654, and independently rediscovered by Charles Messier in on August 25, 1764. As he described it in his notes:
“I have determined the position of a cluster of small stars between the head of the Medusa and the left foot of Andromeda almost on the parallel of the star Gamma of that letter constellation. With an ordinary refractor of 3 feet, one distinguishes these stars; the cluster may have 15 minutes in extension. I have determined its position with regard to the star Beta in the head of the Medusa; its right ascension has been concluded at 36d 51′ 37″, and its declination as 41d 39′ 32″ north.”
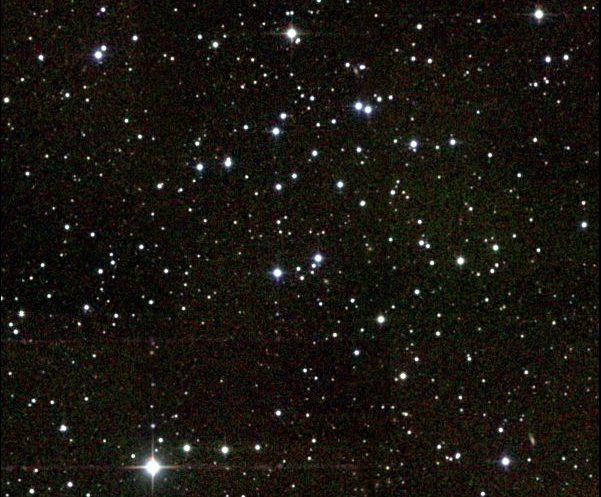
Image of Messier 34 taken by the Two Micron All-Sky Survey (2MASS) of Messier 34 (also known as M34 or NGC 1039). Credit: 2MASS/UMass/IPAC-Caltech/NASA/NSF
Over the years, a great many historic observers would turn a telescope its way to examine it – also looking for more. Said Sir William Herschel: “A cluster of stars; with 120, I think it is accompanied with mottled light, like stars at a distance.” Yet very little more can be seen except for the fact that most of the stars seem to be arranged in pairs – the most notable being optical double in the center – h 1123 – which was cataloged by Sir John Herschel on December 23rd, 1831.
Charles Messier discovered it independently on August 25th, 1764, and included it in the Messier Catalog. As he wrote in the first edition of the catalog:
“In the same night of [August] 25 to 26, I have determined the position of a cluster of small stars between the head of the Medusa [Algol] & the left foot of Andromeda almost on the parallel of the star Gamma of that letter constellation. With an ordinary [non-achromatic] refractor of 3 feet [FL], one distinguishes these stars; the cluster may have 15 minutes in extension. I have determined its position with regard to the star Beta in the head of the Medusa; its right ascension has been concluded at 36d 51? 37?, & its declination as 41d 39? 32? north.”
But as always, it was Admiral William Henry Smyth who described the object with the most florid prose. As he wrote in his notes when observing the cluster in October 1837, he noted the following:
“A double star in a cluster, between the right foot of Andromeda and the head of Medusa; where a line from Polaris between Epsilon Cassiopeiae and Alpha Persei to within 2deg of the parallel of Algol, will meet it. A and B, 8th magnitudes, and both white. It is in a scattered but elegant group of stars from the 8th to the 13th degree of brightness, on a dark ground, and several of them form into coarse pairs. This was first seen and registered by Messier, in 1764, as a “mass of small stars;” and in 1783 was resolved by Sir W. Herschel with a seven-foot reflector: with the 20-foot he made it “a coarse cluster of large stars of different sizes.” By the method he applied to fathom the galaxy, he concluded the profundity of this object not to exceed the 144th order.”
The location of Messier 34 in the northern Perseus constellation. Credit: IAU and Sky & Telescope magazine (Roger Sinnott & Rick Fienberg)
Locating Messier 34:
M34 is easily found in binoculars about two fields of view northwest of Algol(Beta Persei). You will know when you have found this distinctive star cluster because “X” marks the spot! In a telescope finderscope, it will appear as a faint, hazy spot and will fully resolve to most average telescopes. Messier 34 makes an excellent target for moonlit nights or light polluted areas and will stand up well to less than perfect sky conditions.
It can even be seen unaided from ideal locations! Enjoy your observations!
And as always, we’ve included the quick facts on this Messier Object to help you get started:
Object Name: Messier 34 Alternative Designations: M34, NGC 1039 Object Type: Galactic Open Star Cluster Constellation: Perseus Right Ascension: 02 : 42.0 (h:m) Declination: +42 : 47 (deg:m) Distance: 1.4 (kly) Visual Brightness: 5.5 (mag) Apparent Dimension: 35.0 (arc min)
Destroy and Rebuild, Pt. 3: How Do We Terraform Earth?
We always want to talk about how we can make Mars more Earth like, but the reality is that we’re making Earth more Venus-Like. We’re Venusforming Earth. What are the various factors we’re impacting on a global scale, and how can we fix them?
We usually record Astronomy Cast as a live Google+ Hangout on Air every Friday at 1:30 pm Pacific / 4:30 pm Eastern. You can watch here on Universe Today or from the Astronomy Cast Google+ page.
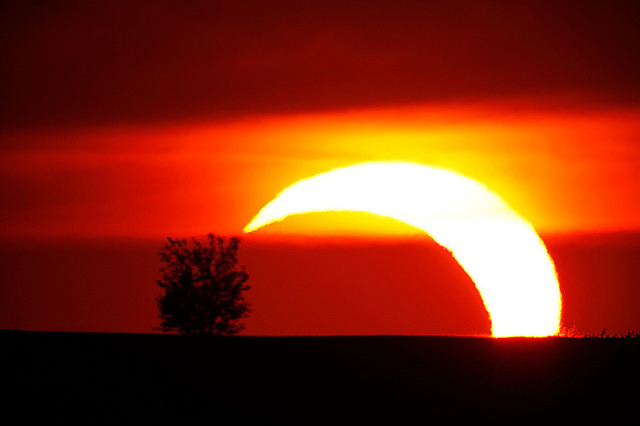
The May 2012 annular eclipse low to the horizon. Image credit and copyright: Jared Bowens.
The May 2012 annular eclipse low to the horizon. Image credit and copyright: Jared Bowens.
Astronomy turns up in fascinating junctures in history. Besides just the romantic angle, we can actually pin down contextual events in ancient history if we can tie them in with a spectacle witnessed in the heavens. A recent look at the story of ‘Joshua’s eclipse’ is one such possible tale.
Lunar and solar eclipses are especially dramatic events, something that would have really made the ancients stop and take notice. A recent study published in an edition of the Beit Mikra Journal (in Hebrew) by researchers from Ben Gurion University may have pinpointed a keypoint in biblical history: the date of the Battle of Gibeon.
This study first came to our attention via the Yahoo! SEML eclipse message board and a recent Times of Israel article. The article makes mention of NASA eclipse data, which is free for anyone to peruse looking over the five millennium canon of solar and lunar eclipses… hey, it’s what we do for fun.
We did obtain a look at a translation of the abstract from the paper, which ends with the following:
“In the period between 1500-1000 BCE which is the relevant time for the biblical story, there were only three eclipses seen from Jerusalem, one total eclipse and two annular eclipses. We show that the most appropriate one is the annular solar eclipse that occurred on October 30 in 1206 BCE at sunset, an appropriate date for the time of conquest and the early settlement period, at the time of Marneptah’ rule in Egypt.”
The path of the eclipse of October 30th, 1206 BC. Credit: NASA/GSFC/Espenak/Meeus.
Joshua 10:12 reads: “Sun, stand still upon Gibeon; and you, Moon, in the valley of Ayalon.”
According to tradition, Joshua commanded the Sun to stand still long enough to defeat the Canaanite kings. Of course, the Sun and the Moon still move during an eclipse be it lunar or solar, though its mostly our planet that’s doing the moving. Still, the actual biblical term “-dom” is open to interpretation, and the researchers chose the Hebrew “to become dark” instead of the King James translation of “to stand still,” or “stationary”.
If this Bible verse sounds familiar, that’s because it turns up in astronomical history again in medieval Europe, when Church proponents used it as supposed proof of geocentricism.
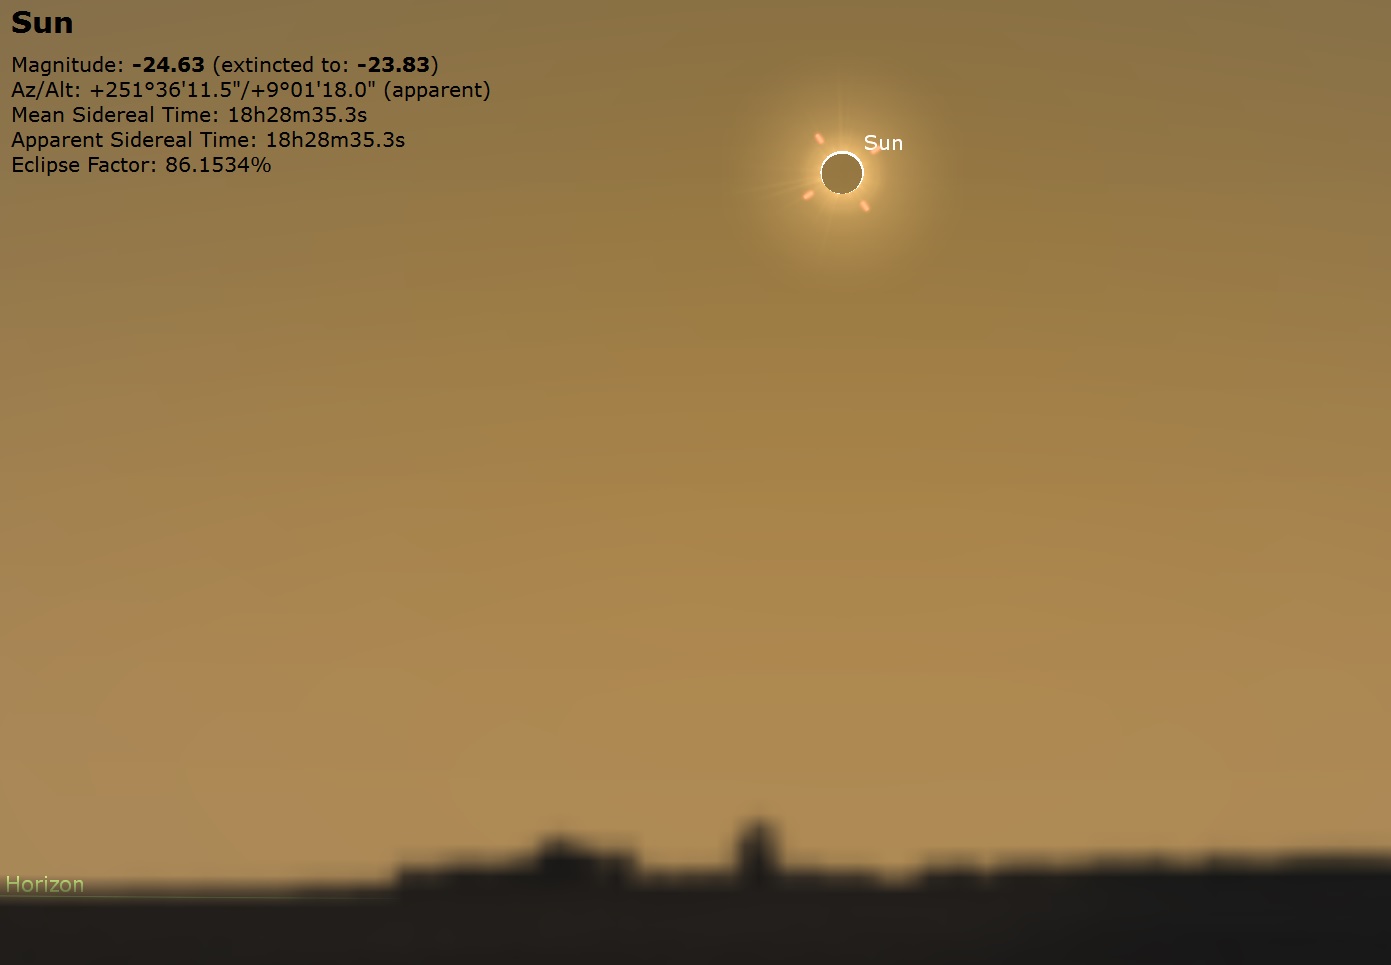
Mid-eclipse over central Israel at sunset on October 30th, 1206 BC. Credit: Stellarium.
It’s tough to predict eclipses in distant time. The rotation of the Earth is not entirely smooth, and the minute change in the length of the day (known as Delta T) accumulates to the point that a leap second must be inserted on occasion to keep observed time in sync with reckoned terrestrial time. Braking action by the Sun and Moon, tectonic activity, and even global warming all cause small changes in the Earth’s rotation that slowly build up over time. This means that it’s tough to predict eclipses more than a few thousand years out, where at best we can only judge which continent they might have or will fall on.
“Not everyone likes the idea of using physics to prove things from the Bible,” said researcher Hezi Yitzhak to the Israeli news site Haaretz. “We do not claim that everything written in the Bible is true or took place… but there is also a grain of historical truth that has archaeological evidence behind it.”
The eclipse in question occurred on October 30th, 1206 BC. This was an annular eclipse, crossing the Atlantic and the Mediterranean and ending over Israel and Jordan at sunset. Researchers pegged this suspect eclipse because of its fit for historical context and visibility. Annularity for the eclipse was 86% obscuration and started at an altitude of nine degrees above the western horizon, and would have still been in progress during its final phases at sunset.
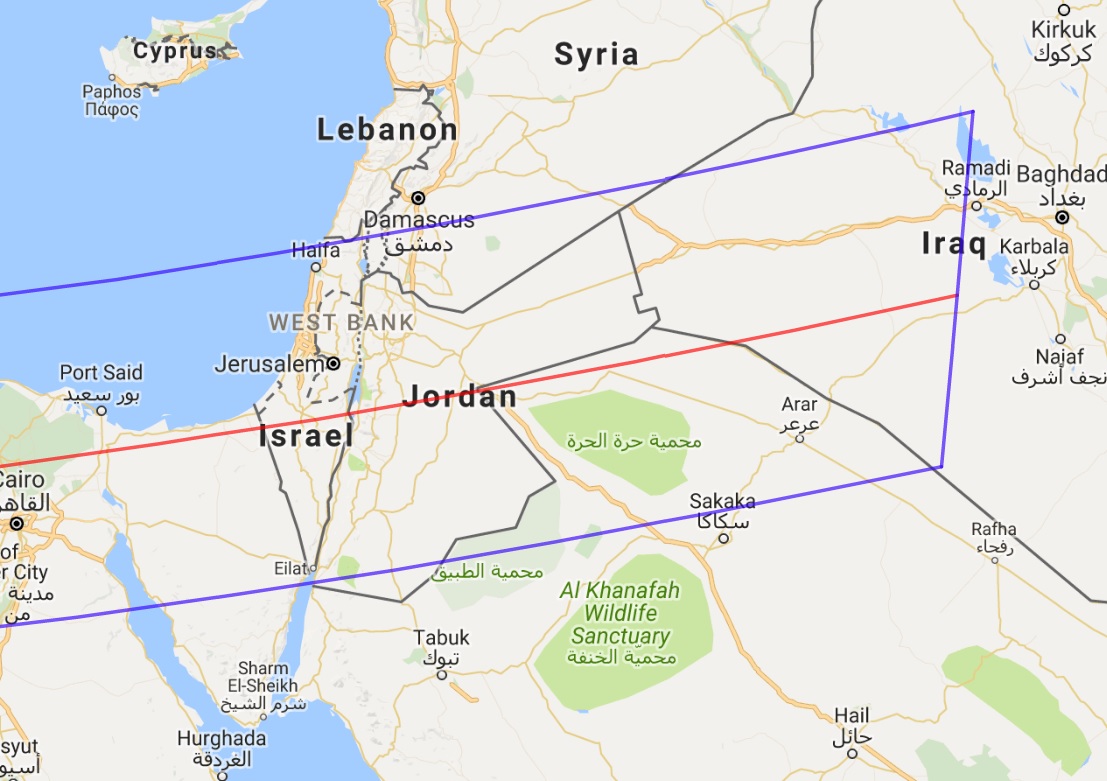
The end of the eclipse path over modern day Israel and Jordan. Credit: NASA/GSFC data.
Lots of eclipses turn up in history. A partial lunar eclipse preceded the fall of Constantinople in 1453, seeming to fulfill prophecy. Solar and lunar eclipses made a showing at lots of battles, including the Second Battle of Syracuse on August 28th, 412 BC and during the Zulu War on January 22nd, 1879. A solar eclipse on June 15th, 762 BC mentioned in Assyrian texts pinpoints a crucial time in ancient history, giving us a benchmark for later dates. It’s worth noting that prior to modern times, it seems that battles were the only thing worth writing down…
Still, it’s interesting to imagine the scene as ancient armies clash, only to stop and gaze at the wondrous sight on the horizon: a pair of glowing horns, hanging low in the pre-dusk sky. We caught the 1994 annular eclipse from the Sandusky, Ohio on the shores of Lake Erie and can attest that even a 98% eclipsed Sun is still pretty bright, giving even a clear day a deep steely blue tint. Lower to the horizon though, an annular eclipse is more readily visible to the unaided eye.
You have to be careful when attempting to read ancient texts as astronomical guide books. Great minds, including Kepler and Newton, expended lots of mental juice on attempting to link biblical accounts such as Ezekiel’s Wheel and the Star of Bethlehem with actual astronomical events. We’ll probably never know for sure if a coincidental conjunction graced the sky over the manger in Bethlehem, or if Ezekiel saw the breakup of a brilliant comet, but it’s always fun to imagine and wonder. Then, there’s the inevitable embellishment that accompanies stories that may have been first sparked by meteor showers or sundogs, centuries ago. We don’t, for example, see flaming swords or banners emblazoned with Latin inscriptions across the sky today, though if you can believe medieval accounts, they seemed common back in the day.
And don’t forget: we’ve got our very own history making eclipse (hopefully sans battlefields) this coming August 21st, 2017 crossing the United States from coast-to-coast.
Though far from conclusive, the results of the study concerning Joshua’s eclipse and the battle of Gideon are interesting to consider. Most likely we’ll never truly know what happened that ancient afternoon, unless, of course, we perfect time travel. What other events remain hidden and lost to time, ready for some historical astro-sleuth to uncover them?
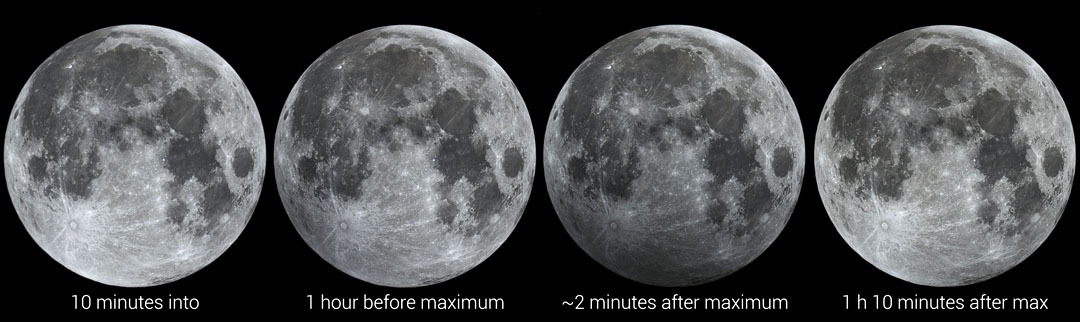
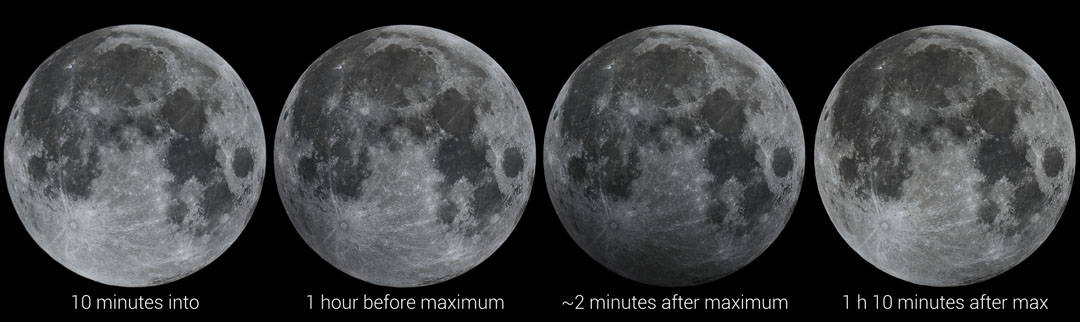
This sequence of photos taken on October 18, 2013 nicely show the different phases of a penumbral lunar eclipse. The coming penumbral eclipse will likely appear even darker because Earth’s shadow will shade to the top (northern) half of the Moon rich in dark lunar “seas” at maximum. Credit: AstroTripper 2000
Not many people get excited about a penumbral eclipse, but when it’s a deep one and the only lunar eclipse visible in North America this year, it’s worth a closer look. What’s more, this Friday’s eclipse happens during convenient, early-evening viewing hours. No getting up in the raw hours before dawn.
Lunar eclipses — penumbral, partial and total — always occur at Full Moon, when the Moon, Earth and Sun line up squarely in a row in that order. Only then does the Moon pass through the shadow cast by our planet. Credit: Starry Night with additions by the author
During a partial or total lunar eclipse, the full moon passes first through the Earth’s outer shadow, called the penumbra, before entering the dark, interior shadow or umbra. The penumbra is nowhere near as dark as the inner shadow because varying amounts of direct sunlight filter into it, diluting its duskiness.
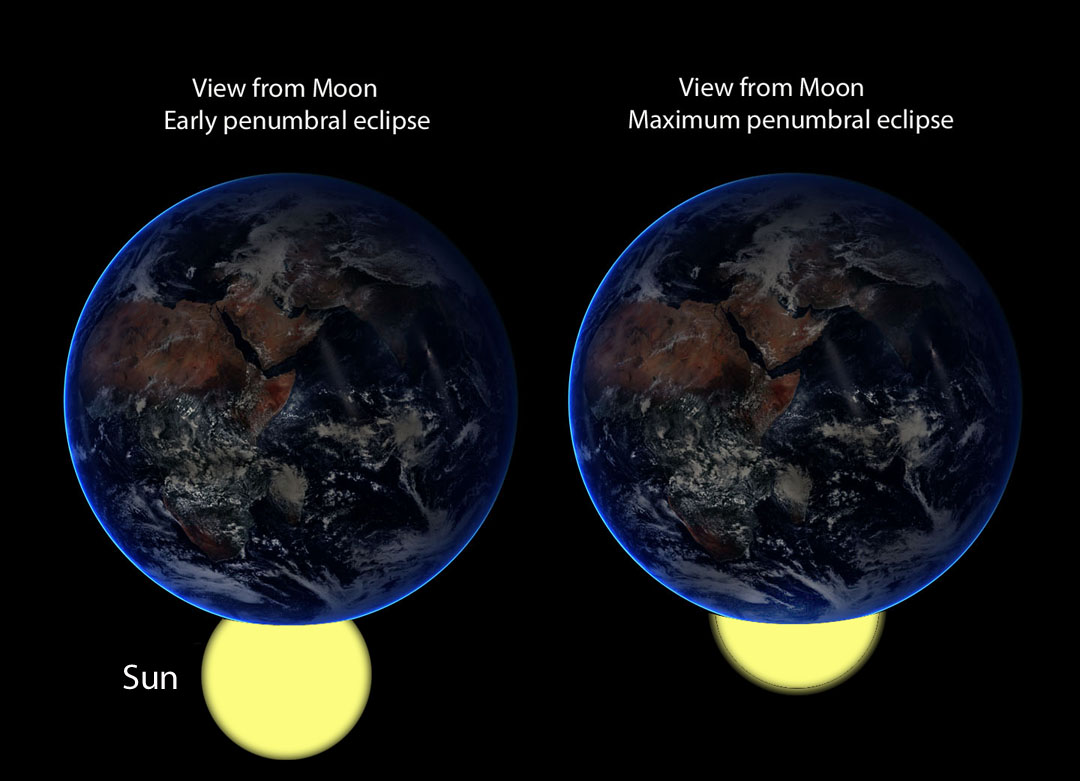
To better understand this, picture yourself watching the eclipse from the center of the Moon’s disk (latitude 0°, longitude 0°). As you look past the Earth toward the Sun, you would see the Sun gradually covered or eclipsed by the Earth. Less sunlight would be available to illuminate the Moon, so your friends back on Earth would notice a gradual dimming of the Moon, very subtle at first but becoming more noticeable as the eclipse progressed.
This diagram shows an approximation of the Sun’s position and size as viewed by an observer at the center of the lunar disk during Friday’s penumbral eclipse. More sunlight shines across the Moon early in the eclipse, making the penumbral shadow very pale, but by maximum (right), half the sun is covered and the Moon appears darker and duskier as seen from Earth. During a total lunar eclipse, the sun is hidden completely. Credit: Bob King with Earth image by NASA
As the Moon’s leading edge approached the penumbra-umbra border, the Sun would narrow to a glaring sliver along Earth’s limb for our lucky lunar observer. Back on Earth, we’d notice that the part of the Moon closest to the umbra looked strangely gray and dusky, but the entire lunar disk would still be plainly visible. That’s what we’ll see during Friday’s eclipse. The Moon will slide right up to the umbra and then roll by, never dipping its toes in its dark waters.
During a partial eclipse, the Moon keeps going into the umbra, where the Sun is completely blocked from view save for dash of red light refracted by the Earth’s atmosphere into what would otherwise be an inky black shadow. This eclipse, the Moon only flirts with the umbra.
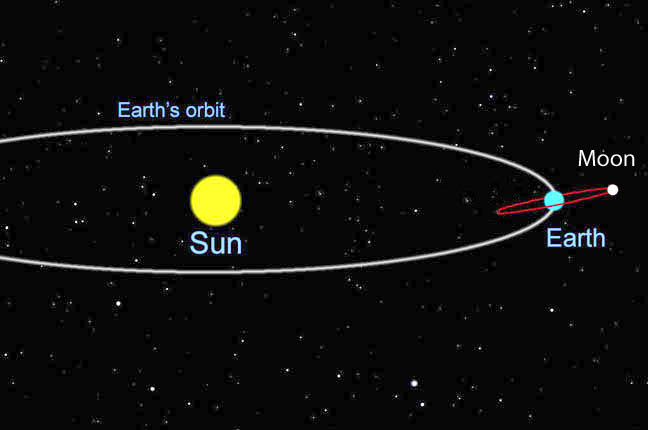
The moon’s orbit is tilted 5.1 degrees in relation to Earth’s orbit, so most Full Moons, it passes above or below the shadow and no eclipse occurs. Credit: Bob King
Because the moon’s orbit is tilted about 5° from the plane of Earth’s orbit, it rarely lines up for a perfect bullseye total eclipse: Sun – Earth – Moon in a straight line in that order. Instead, the moon typically passes a little above or below (north or south) of the small, circle-shaped shadow cast by our planet, and no eclipse occurs. Or it clips the outer edge of the shadow and we see — you guessed it — a penumbral eclipse.
Earth’s shadow varies in size depending where you are in it. Standing on the ground during twilight, it can grow to cover the entire sky, but at the moon’s distance of 239,000 miles, the combined penumbra and umbra span just 2.5° of sky or about the width of your thumb held at arm’s length.
The moon passes through Earth’s outer shadow, the penumbra, on Feb. 10-11. In the umbra, the sun is blocked from view, but the outer shadow isn’t as dark because varying amounts of sunlight filter in to dilute the darkness. Times are Central Standard. Credit: F. Espenak, NASA’s GFSC with additions by the author
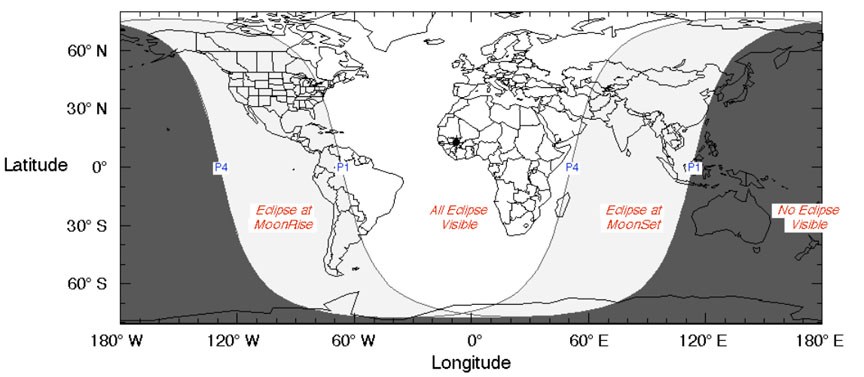
Because the Moon travels right up to the umbra during Friday’s eclipse, it will be well worth watching.The lower left or eastern half of the moon will appear obviously gray and blunted especially around maximum eclipse as it rises in the eastern sky that Friday evening over North and South America. I should mention here that the event is also visible from Europe, Africa, S. America and much of Asia.
This map shows where the eclipse will be visible. Most of the U.S. will see at least part of the event. Credit: F. Espenak, NASA’s GFSC
For the U.S., the eastern half of the country gets the best views. Here are CSTand UTtimes for the different stages. To convert from CST, add an hour for Eastern, subtract one hour for Mountain and two hours for Pacific times. UT stands for Universal Time, which is essentially the same as Greenwich or “London” Time except when Daylight Saving Time is in effect:
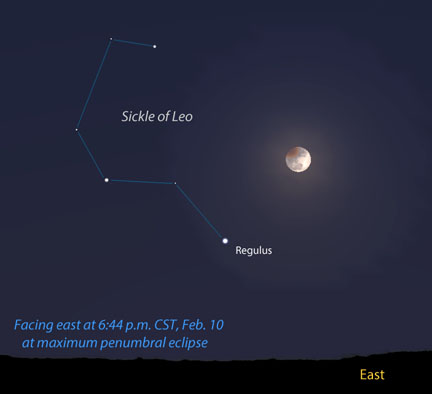
This is a simulated view of the Full Snow Moon at maximum eclipse Friday evening low in the eastern sky alongside the familiar asterism known as the Sickle of Leo. Created with Stellarium
Eclipse begins: 4:34 p.m. (22:34 p.m. UT) Maximum eclipse (moon deepest in shadow): 6:44 p.m. (00:43 UT Feb. 11) Eclipse ends: 8:53 p.m. (2:53 UT Feb. 11)
You can see that the eclipse plays out over more than 4 hours, though I don’t expect most of us will either be able or would want to devote that much time. Instead, give it an hour or so when the Moon is maximally in shadow from 6 to 7:30 p.m. CST; 7-8:30 EST; 5-6:30 p.m. MST and around moonrise Pacific time.
This should be a fine and obvious eclipse because around the time of maximum, the darkest part of the penumbra shades the dark, mare-rich northern hemisphere of the Moon. Dark plus dark equals extra dark! Good luck and clear skies!
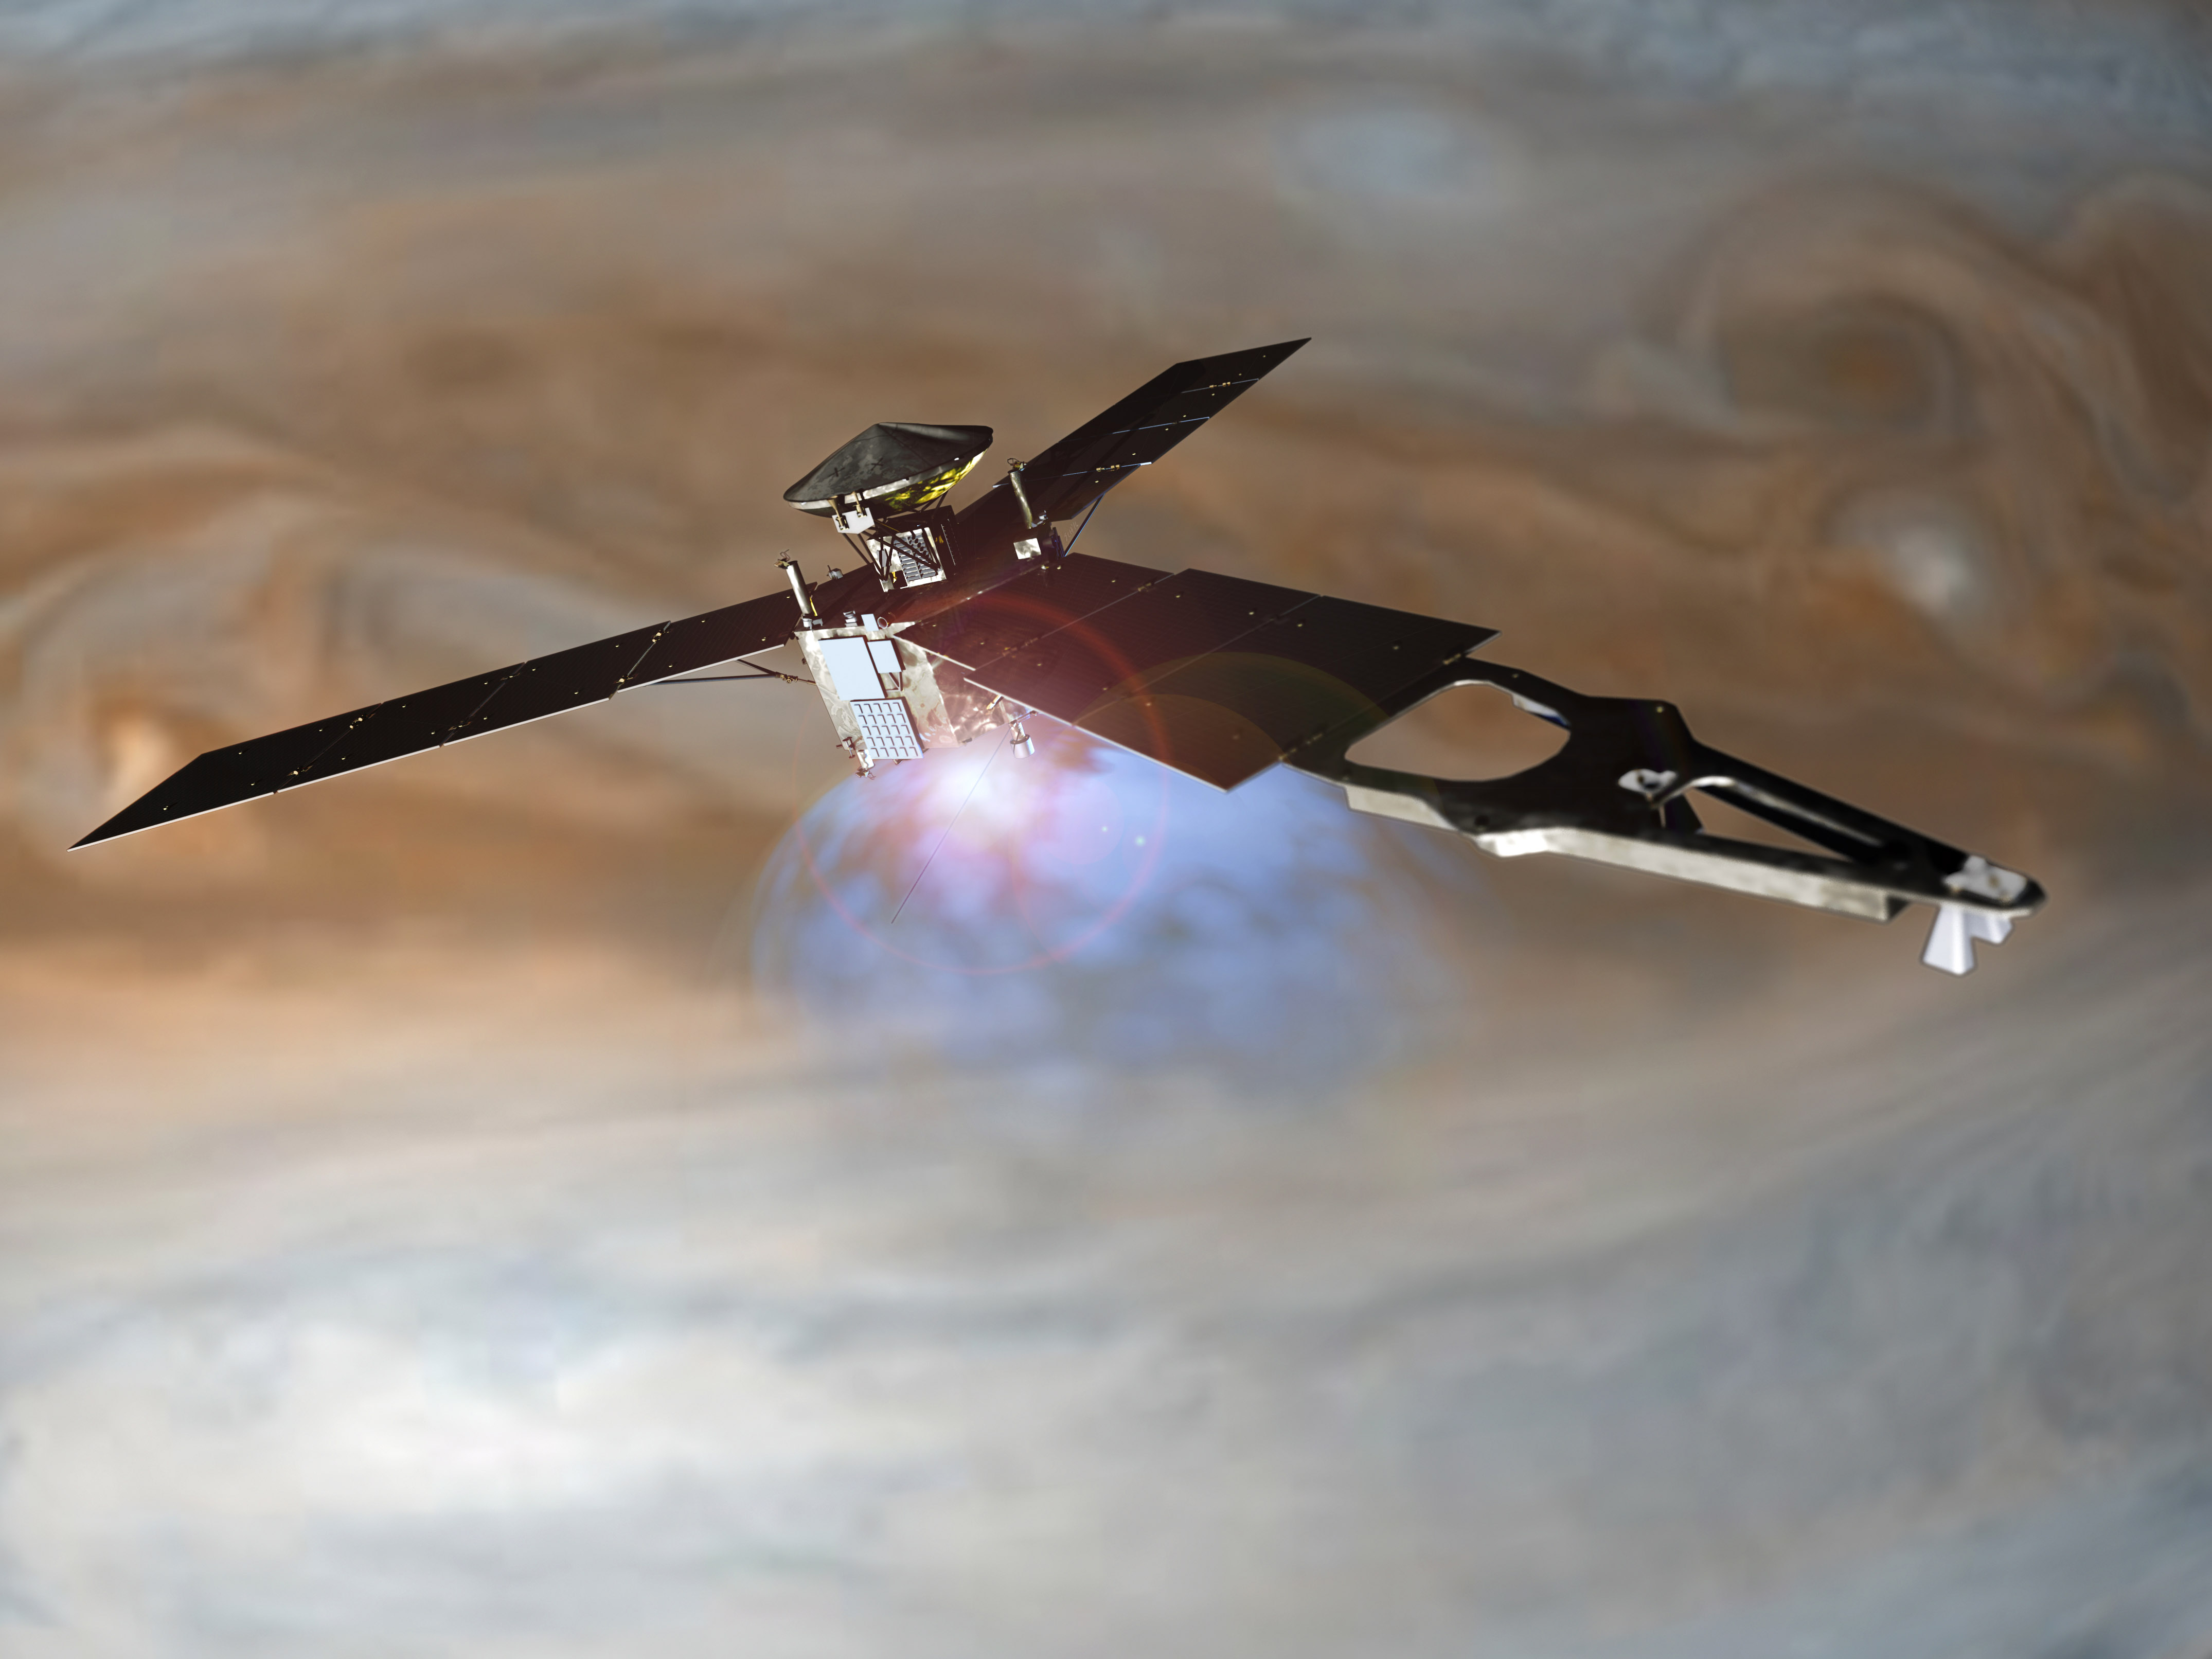
Illustration of NASA's Juno spacecraft firing its main engine to slow down and go into orbit around Jupiter. Lockheed Martin built the Juno spacecraft for NASA's Jet Propulsion Laboratory. Credit: NASA/Lockheed Martin
On July 4th, 2016, NASA’s Juno spacecraft made history when it became the second mission to establish orbit around Jupiter – the previous being the Galileo spacecraft, which orbited the planet from 1995 to 2003. Since that time, it has circled the massive gas giant three times, collecting data on the gas giant’s composition, interior and gravity field.
This past Thursday, February 1st, the mission conducted its fourth orbit of the planet. In the process, the spacecraft collected more vital data on the gas giant and snapped several dozen pictures. And in what is has been a first for a space mission, NASA will once again be asking the public what features they would like to see photographed during Juno’s next pass.
Juno made its closest pass (what is known as perijove) to Jupiter at precisely 1257 GMT (7:57 a.m. EST), passing the cloud tops at a distance of 4,300 km (2,670 mi) and traveling at a velocity of about 208,000 km/h (129,300 mph) relative to the gas giant. Using its suite of instruments, it scanned Jupiter’s atmosphere, gathered data on its radiation and plasma, and began returning this information to Earth.
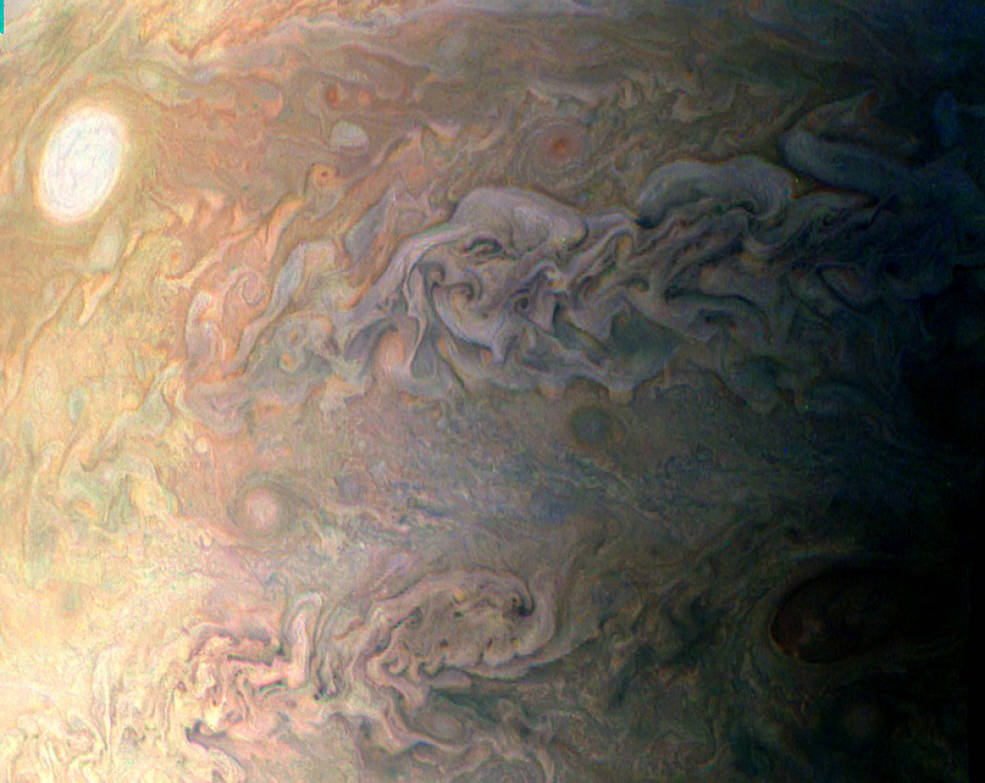
Processed image taken on Dec. 11, 2016, at 9:27 a.m. PST (12:27 p.m. EST) by the NASA Juno spacecraft, as it performed its third close flyby of Jupiter. Credits: NASA/JPL-Caltech/SwRI/MSSS/Eric Jorgensen
And during this latest pass, the JunoCam snapped several dozen more pictures. During two of its three previous perijove maneuvers, this instruments captured some of the most breathtaking photographs of Jupiter’s clouds to date (like the one seen above). Once they were transmitted back to Earth and made available to the public, “citizen scientists” were able to download and process them at their leisure.
And with this latest pass complete, the public is once again being encouraged to vote on what features they want to see photographed during the next pass. As Candy Hansen, the Juno mission’s co-investigator from the Planetary Science Institute, stated shortly before Juno made its fourth perijovian maneuver:
“The pictures JunoCam can take depict a narrow swath of territory the spacecraft flies over, so the points of interest imaged can provide a great amount of detail. They play a vital role in helping the Juno science team establish what is going on in Jupiter’s atmosphere at any moment. We are looking forward to seeing what people from outside the science team think is important.”
This has all been part of a first-ever effort on behalf of NASA to get the public involved in what kinds of images are to be taken. According to NASA, this is to become a regular feature of the Juno mission, with a new voting page being created for each upcoming flyby. The next perijovian maneuver will take place on March 27th, 2017, coinciding with the Juno spacecraft’s 53.4-day orbital period.
False color view of Jupiter’s polar haze, created by citizen scientist Gerald Eichstädt using data from the JunoCam instrument. Credit: NASA/JPL-Caltech/SwRI/MSSS/Eric Jorgensen
Originally, the mission planners had hoped to narrow Juno’s orbital period down to 14 days, which would have been accomplished by having the craft fire its main engine while at perijove. However, two weeks before the engine burn was scheduled to take place (Oct. 19th, 2016), ground controllers noticed a problem with two of the engine’s check valves – which are part of the spacecraft’s fuel pressurization system.
“Telemetry indicates that two helium check valves that play an important role in the firing of the spacecraft’s main engine did not operate as expected during a command sequence that was initiated yesterday. The valves should have opened in a few seconds, but it took several minutes. We need to better understand this issue before moving forward with a burn of the main engine.”
Because of this technical issue, the mission leaders chose to postpone the engine burn so they could check the craft’s instruments to get a better understanding of why it happened. The Juno team was hoping to use the third orbit of the spacecraft to study the problem, but this was interrupted when a software performance monitor induced a reboot of the spacecraft’s onboard computer.
To accomplish its science objectives, Juno is orbiting Jupiter’s poles and passing very close to the planet, avoiding the most powerful (and hazardous) radiation belts in the process. Credit: NASA/JPL-Caltech
Because of this, the spacecraft went into safe mode during its third flyby, which prevented them from gathering data on the engine valve problem. On Oct. 24th, the mission controllers managed to get the craft to exit safe mode and performed a trim maneuver in preparation for its next flyby. But the mystery of why the engine valves failed to open remains, and the mission team is still unable to resolve the problem.
Thus, the decision to fire the main engine (thereby shortening its orbital period) has been postponed until they get it back online. But as Scott Bolton – the Associate Director of R&D at the Southwest Research Institute (SwRI) and Juno’s Principal Investigator – has emphasized in the past:
“It is important to note that the orbital period does not affect the quality of the science that takes place during one of Juno’s close flybys of Jupiter. The mission is very flexible that way. The data we collected during our first flyby on August 27th was a revelation, and I fully anticipate a similar result from Juno’s October 19th flyby.”
In the meantime, the Juno science team is still analyzing data from all previous Jupiter flybys. During each pass, the spacecraft and its instruments peer beneath Jupiter’s dense cloud cover to study its auroras, its magnetic field, and to learn more about the planet’s structure, composition, and formation. And with the public’s help, it is also providing some of the clearest and most detailed imagery of the gas giant to date.
SpaceX Falcon 9 first stage previously flown to space is test fired at the firms McGregor, TX rocket development facility in late January 2017 to prepare for relaunch. Credit: SpaceX
SpaceX Falcon 9 first stage previously flown to space is test fired at the firms McGregor, TX rocket development facility in late January 2017 to prepare for relaunch. Credit: SpaceX
The once fanciful dream of rocket recycling is now closer than ever to becoming reality, after successful completion of the static fire test on a test stand in McGregor, Texas, paved the path to relaunch, SpaceX announced via twitter.
The history making first ever reuse mission of a previously flown liquid fueled Falcon 9 first stage booster equipped with 9 Merlin 1D engines could blastoff as soon as March 2017 from the Florida Space Coast with the SES-10 telecommunications satellite, if all goes well.
The booster to be recycled was initially launched in April 2016 for NASA on the CRS-8 resupply mission under contract for the space agency.
“Prepping to fly again — recovered CRS-8 first stage completed a static fire test at our McGregor, TX rocket development facility last week,” SpaceX reported.
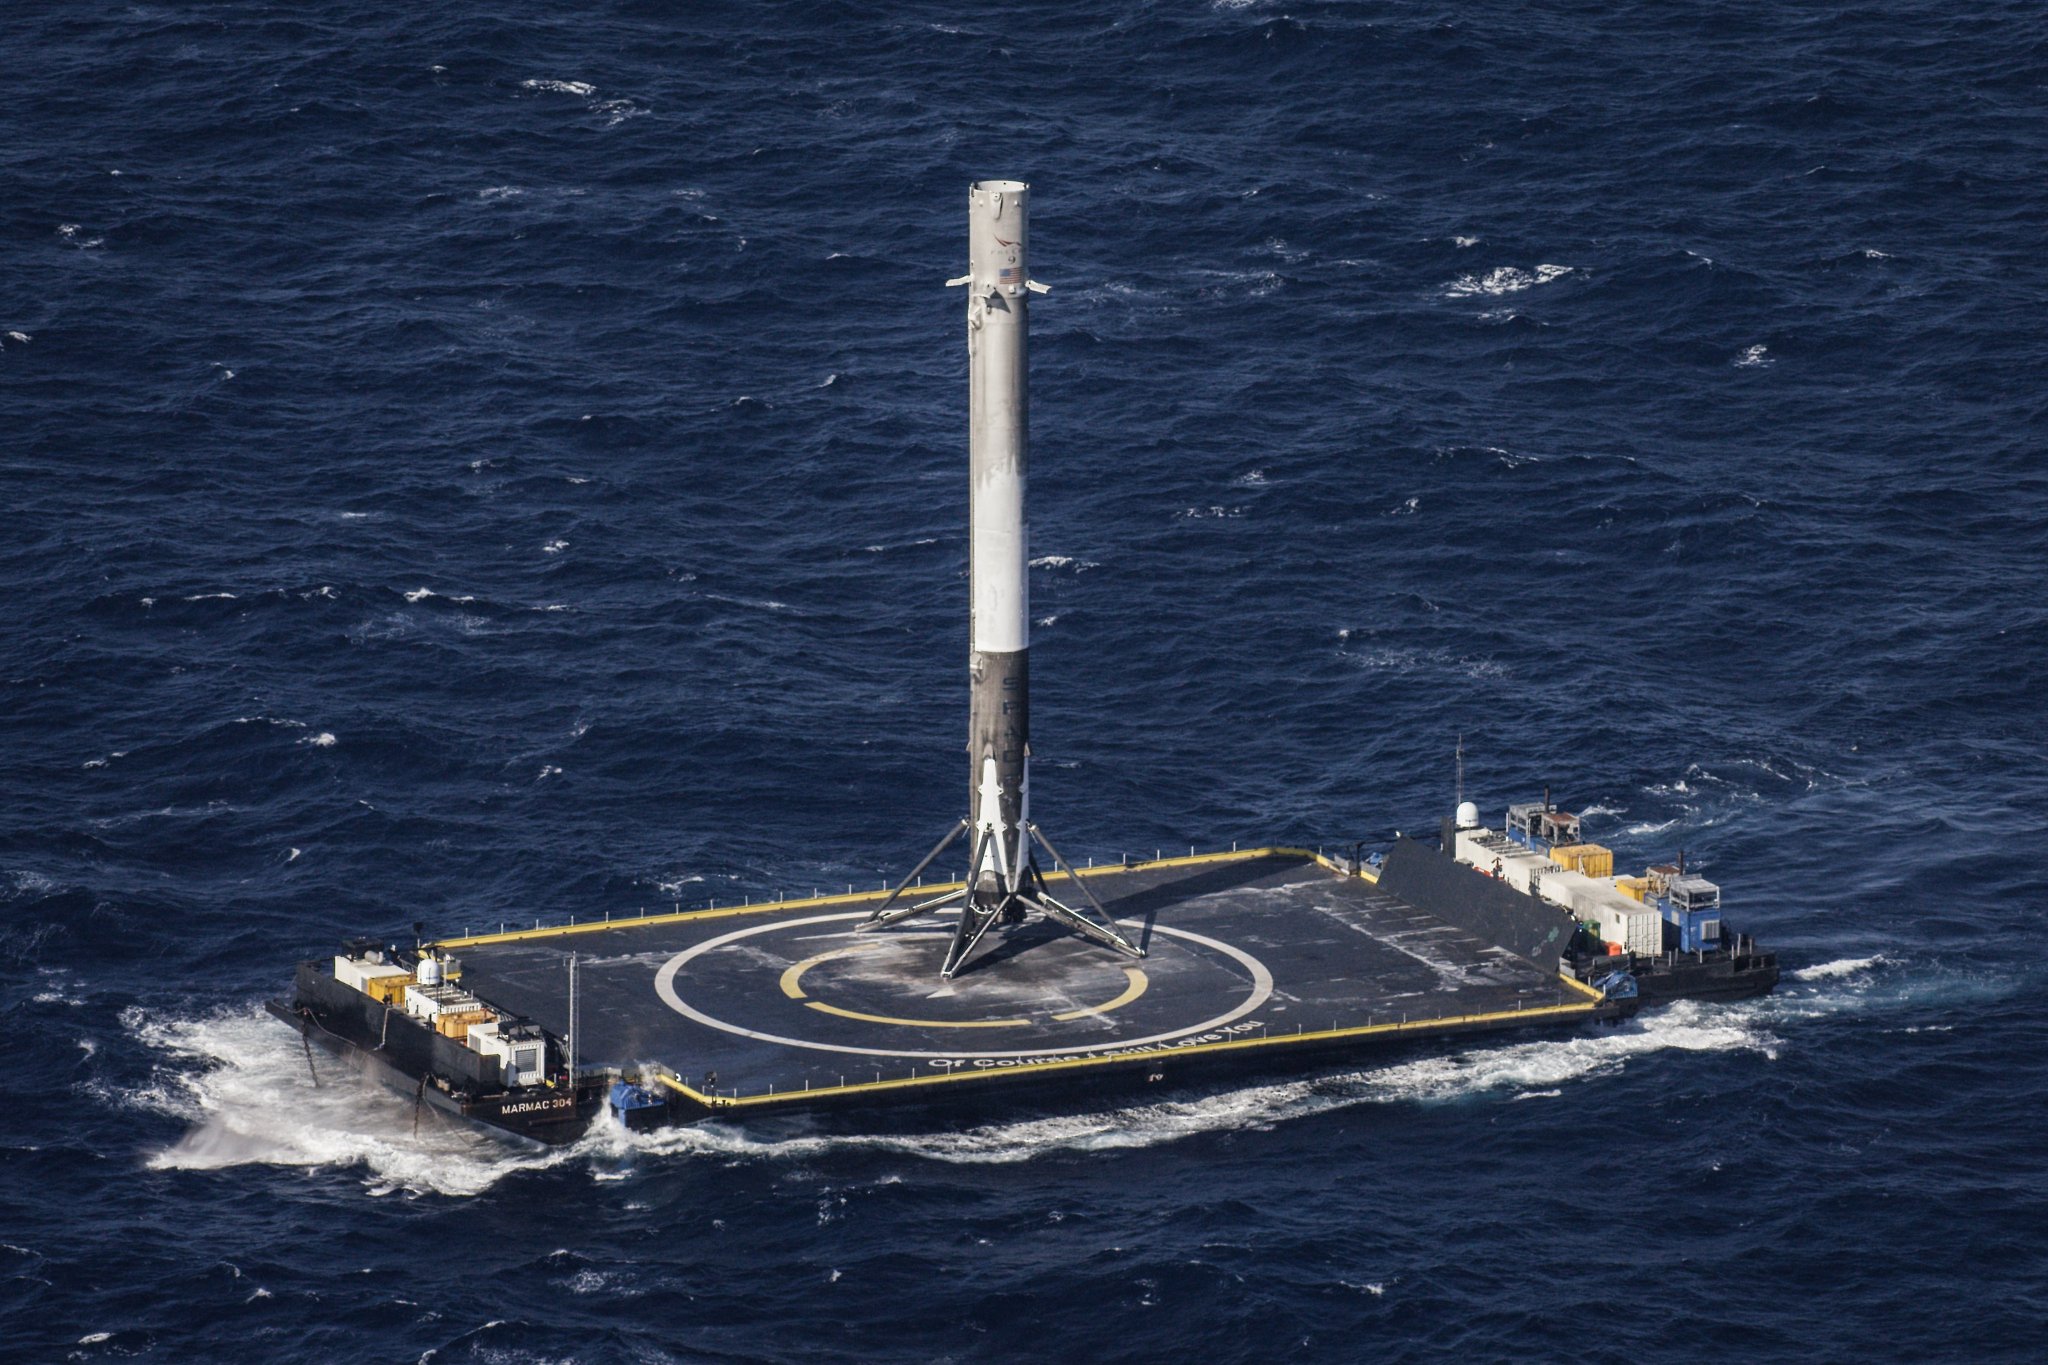
The CRS-8 Falcon 9 first stage booster successfully delivered a SpaceX cargo Dragon to the International Space Station (ISS) in April 2016.
The Falcon 9 first stage was recovered about 8 minutes after liftoff via a propulsive soft landing on an ocean going droneship in the Atlantic Ocean some 400 miles (600 km) off the US East coast.
First launch of flight-proven Falcon 9 first stage will use CRS-8 booster that delivered Dragon to the International Space Station in April 2016. Credit: SpaceX
SpaceX, founded by billionaire and CEO Elon Musk, inked a deal in August 2016 with telecommunications giant SES, to refly a ‘Flight-Proven’ Falcon 9 booster.
Luxembourg-based SES and Hawthrone, CA-based SpaceX jointly announced the agreement to “launch SES-10 on a flight-proven Falcon 9 orbital rocket booster.”
Exactly how much money SES will save by utilizing a recycled rocket is not known. But SpaceX officials have been quoted as saying the savings could be between 10 to 30 percent.
The SES-10 launch on a recycled Falcon 9 booster was originally targeted to take place before the end of 2016.
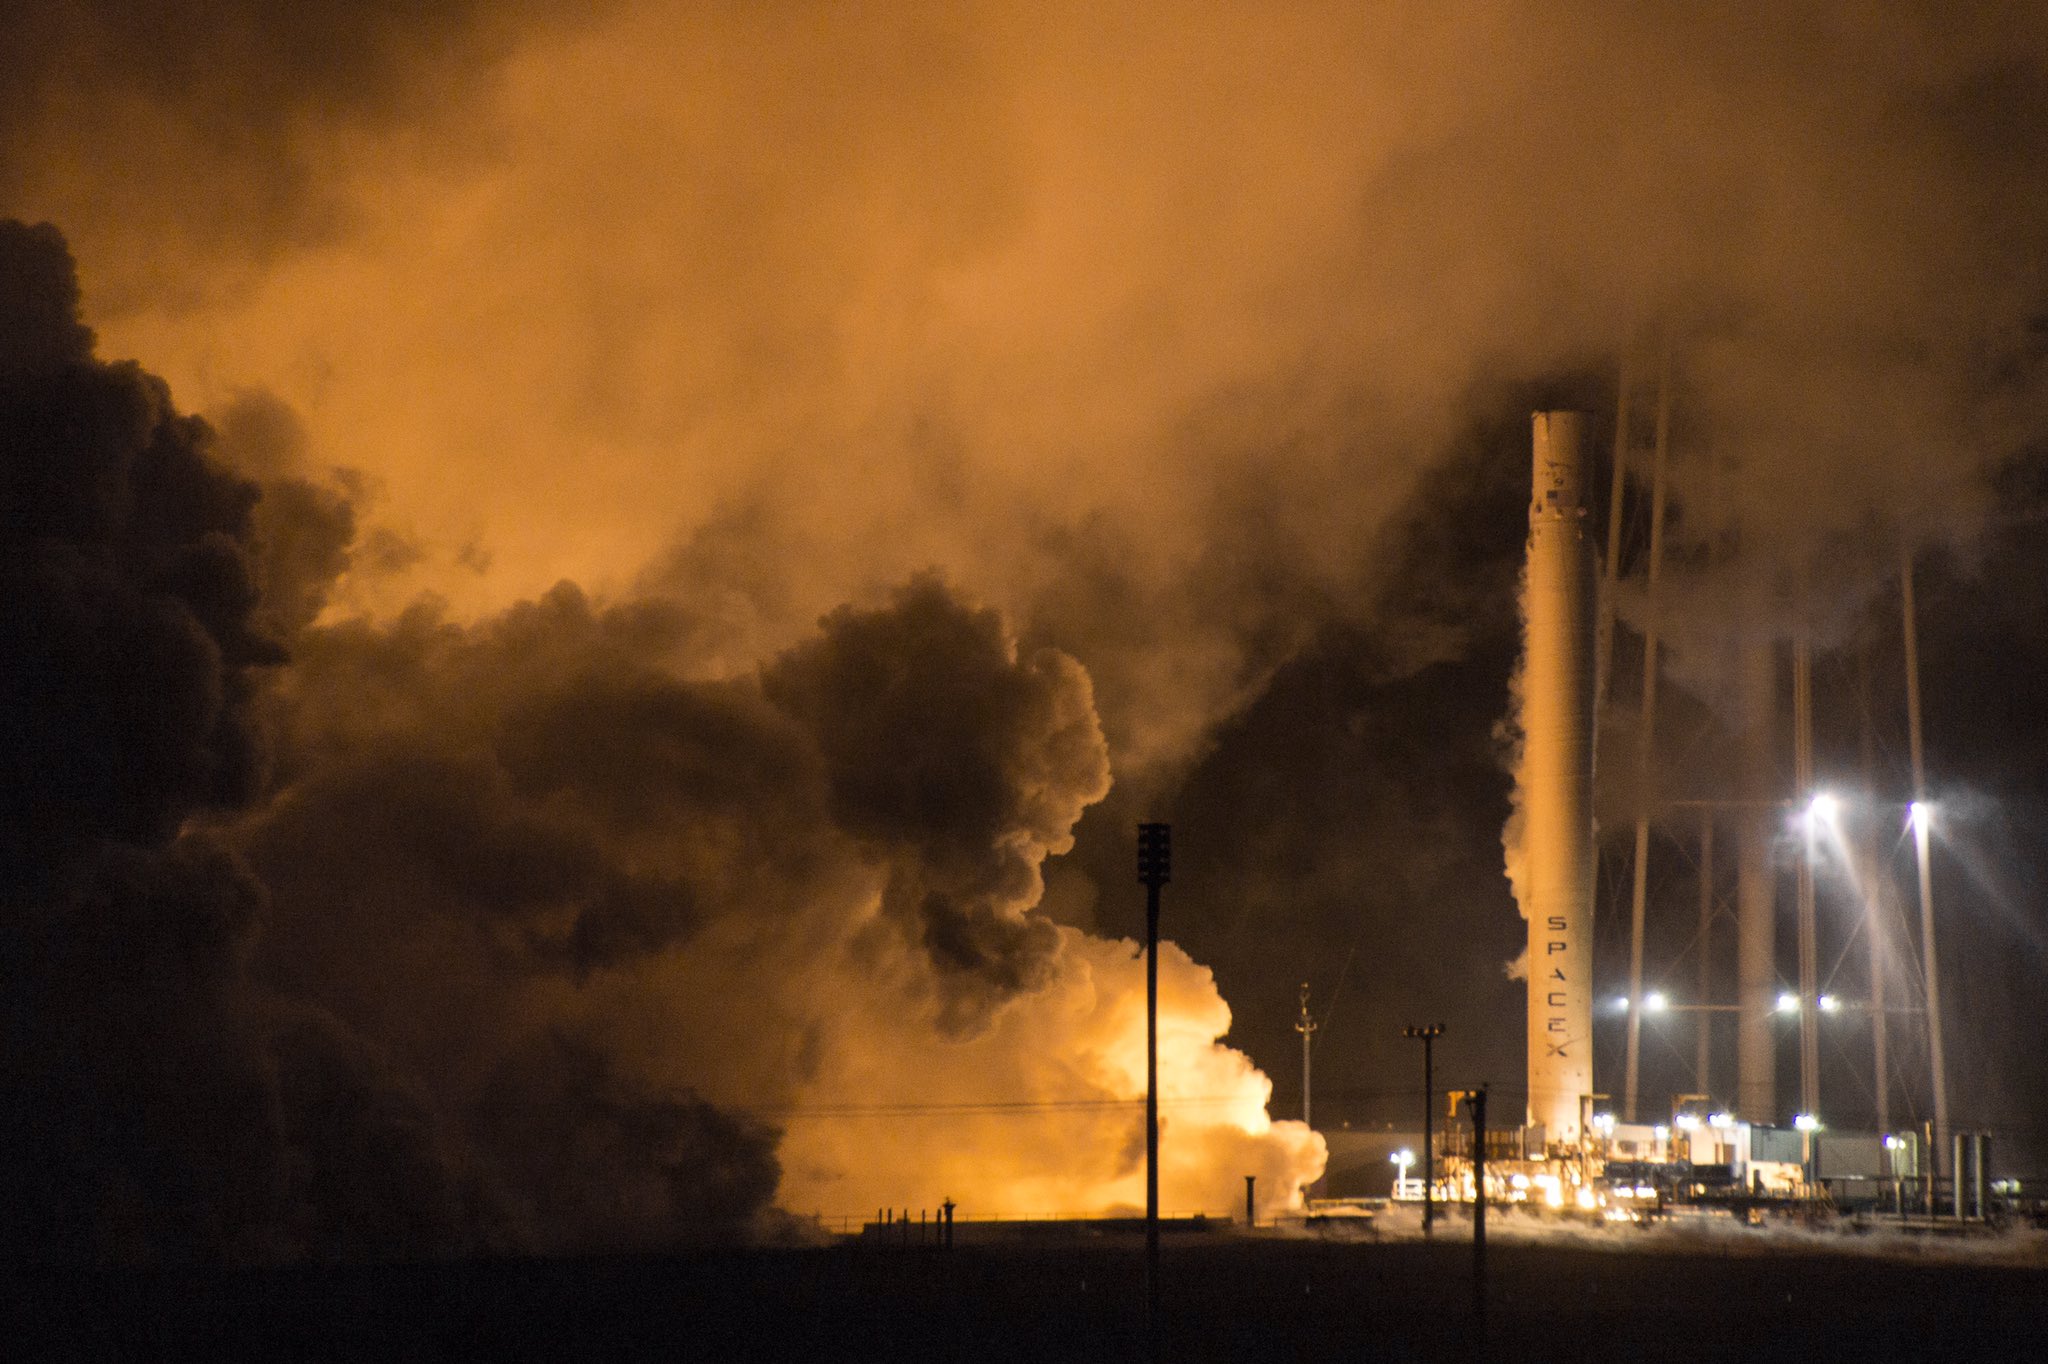
That was the plan until another Falcon 9 exploded unexpectedly on the ground at SpaceX’s Florida launch pad 40 during a routine prelaunch static fire test on Sept. 1 that completed destroyed the rocket and its $200 million Amos-6 commercial payload on Cape Canaveral Air Force Station.
The Sept. 1 launch pad disaster heavily damaged the SpaceX pad and launch infrastructure facilities at Space Launch Complex-40 on Cape Canaveral Air Force Station in Florida.
Aerial view of pad and strongback damage at SpaceX Launch Complex-40 as seen from the VAB roof on Sept. 8, 2016 after fueling test explosion destroyed the Falcon 9 rocket and AMOS-6 payload at Cape Canaveral Air Force Station, FL on Sept. 1, 2016. Credit: Ken Kremer/kenkremer.com
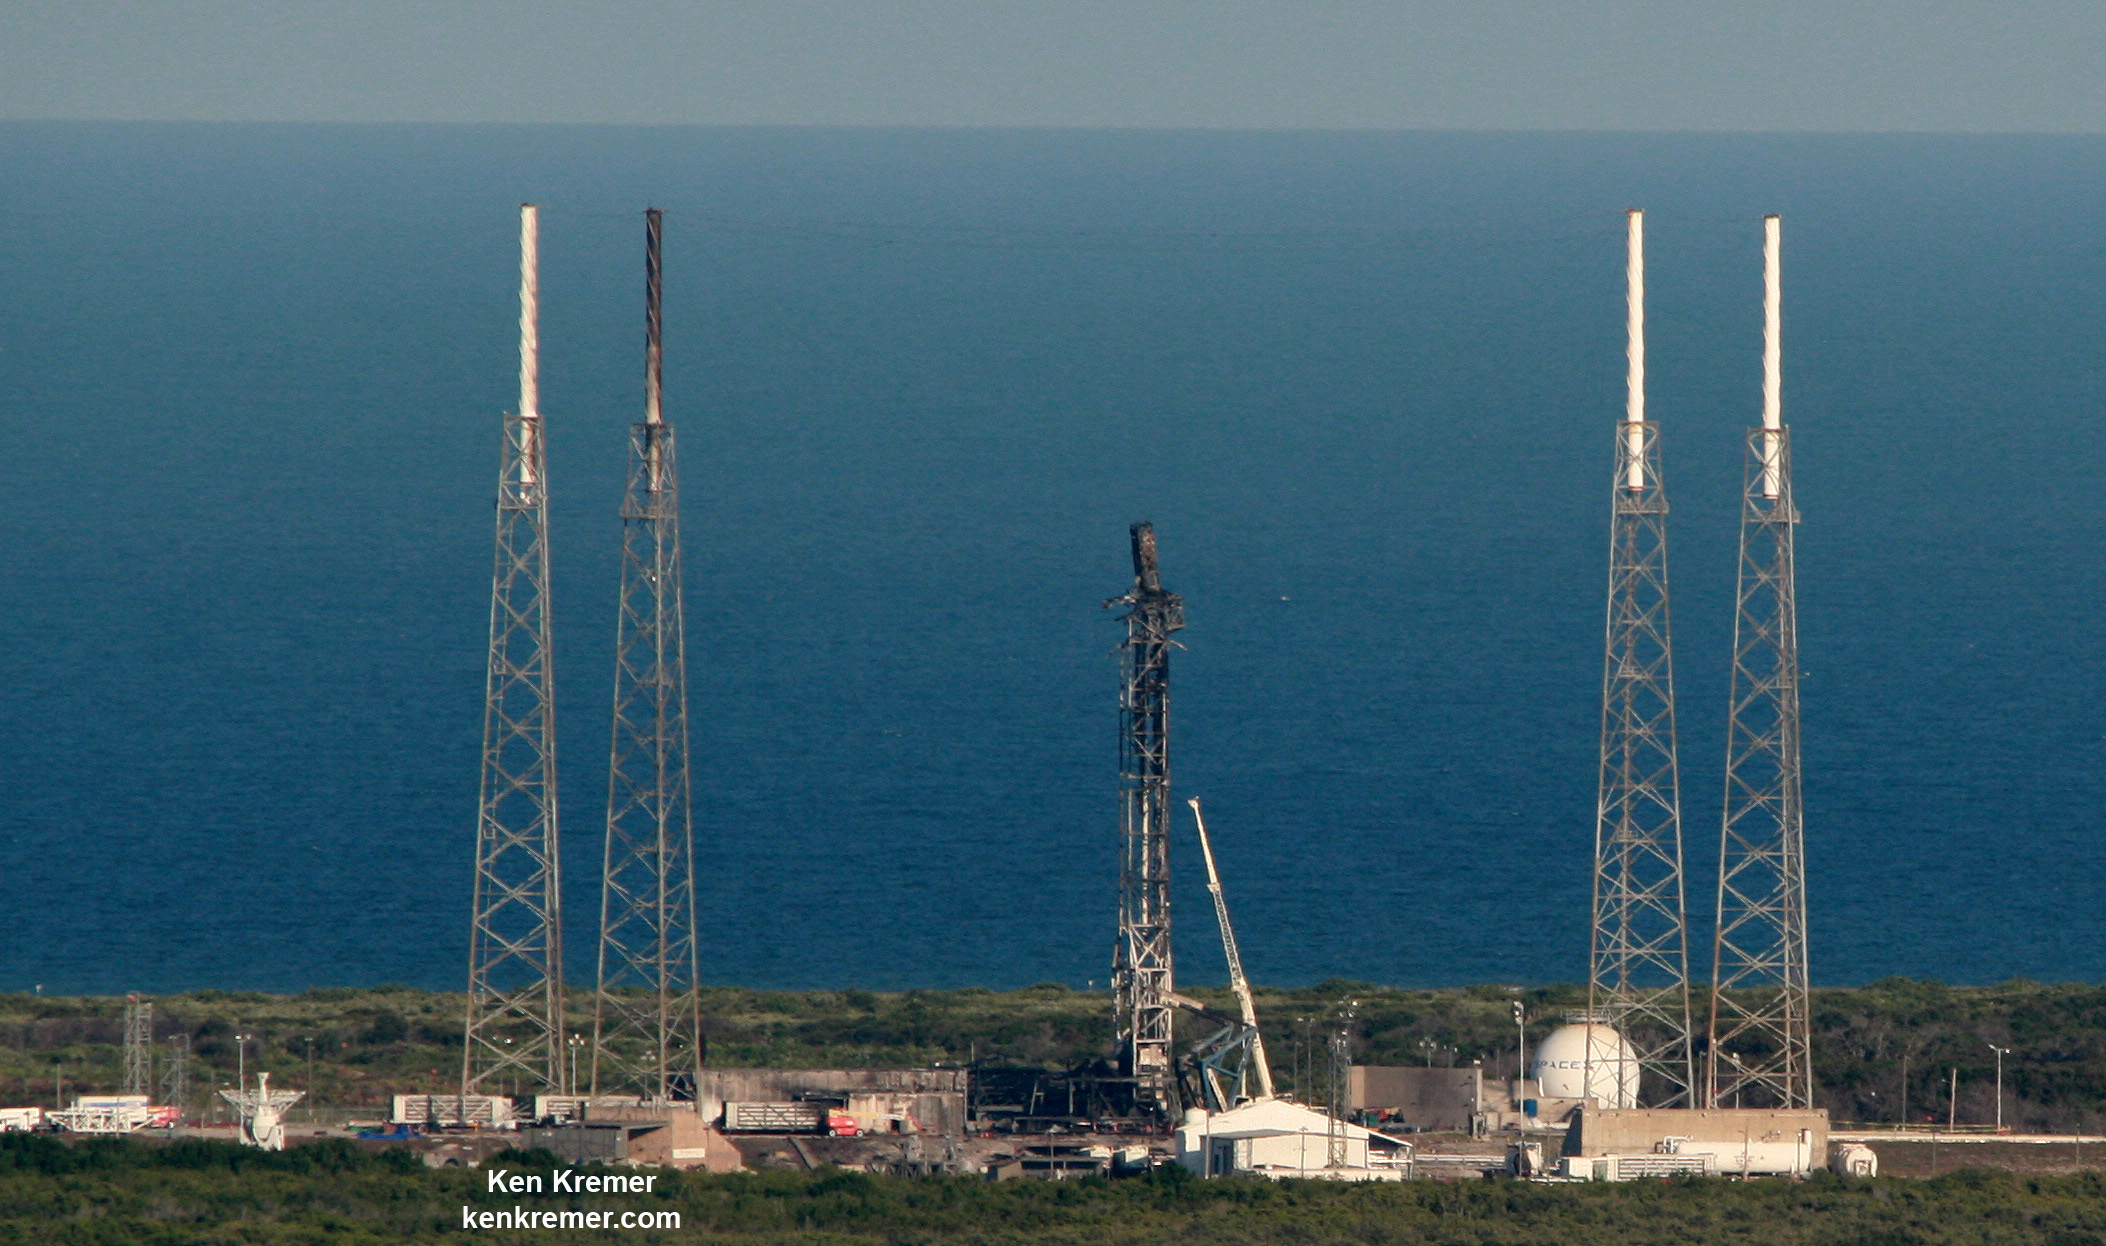
Pad 40 is still out of commission as a result of the catastrophe. Few details about the pad damage and repair work have been released by SpaceX and it is not known when pad 40 will again be certified to resume launch operations.
Therefore SpaceX ramped up preparations to launch Falcon 9’s from the firms other pad on the Florida Space Coast – namely historic Launch Complex 39A which the company leased from NASA in 2014.
SpaceX is repurposing historic pad 39A at the Kennedy Space Center, Florida for launches of the Falcon 9 rocket. Ongoing pad preparation by work crews is seen in this current view taken on Jan. 27, 2017. Credit: Ken Kremer/kenkremer.com
Pad 39A is being repurposed by SpaceX to launch the Falcon 9 and Falcon Heavy rockets. It was previously used by NASA for more than four decades to launch Space Shuttles and Apollo moon rockets.
But SES-10 is currently third in line to launch atop a Falcon 9 from pad 39A.
The historic first launch of a Falcon 9 from pad 39A is currently slated for no earlier than Feb. 14 on the CRS-10 resupply mission for NASA to the ISS – as reported here.
The EchoStar 23 comsat is slated to launch next, currently no earlier than Feb 28.
SES-10 will follow – if both flights go well.
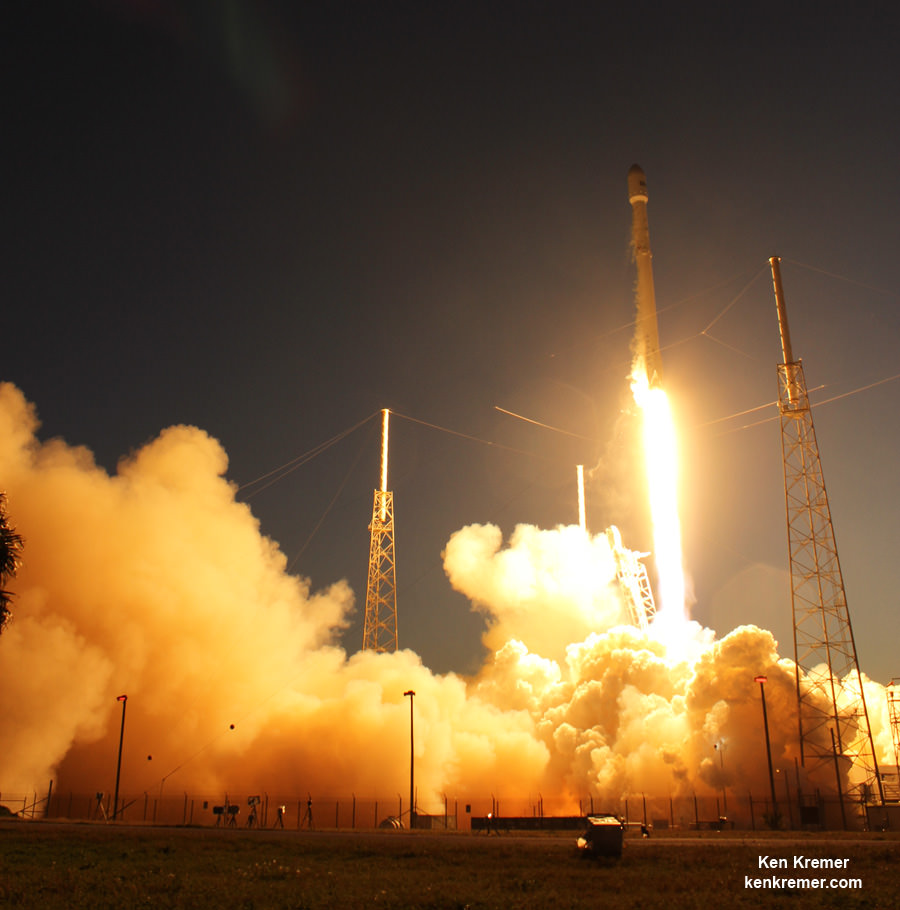
SpaceX successfully launched SES-9 for SES in March 2016.
Sunset blastoff of SpaceX Falcon 9 carrying SES-9 communications satellite from Space Launch Complex 40 on Cape Canaveral Air Force Station, FL. Credit: Ken Kremer/kenkremer.com
Last July, SpaceX engineers conducted a test firing of another recovered booster as part of series of test examining long life endurance testing. It involved igniting all nine used first stage Merlin 1D engines housed at the base of a used landed rocket.
The Falcon 9 first stage generates over 1.71 million pounds of thrust when all nine Merlin engines fire up on the test stand for a duration of up to three minutes – the same as for an actual launch.
Watch the engine test in this SpaceX video:
Video Caption: Falcon 9 first stage from May 2016 JCSAT mission was test fired, full duration, at SpaceX’s McGregor, Texas rocket development facility on July 28, 2016. Credit: SpaceX
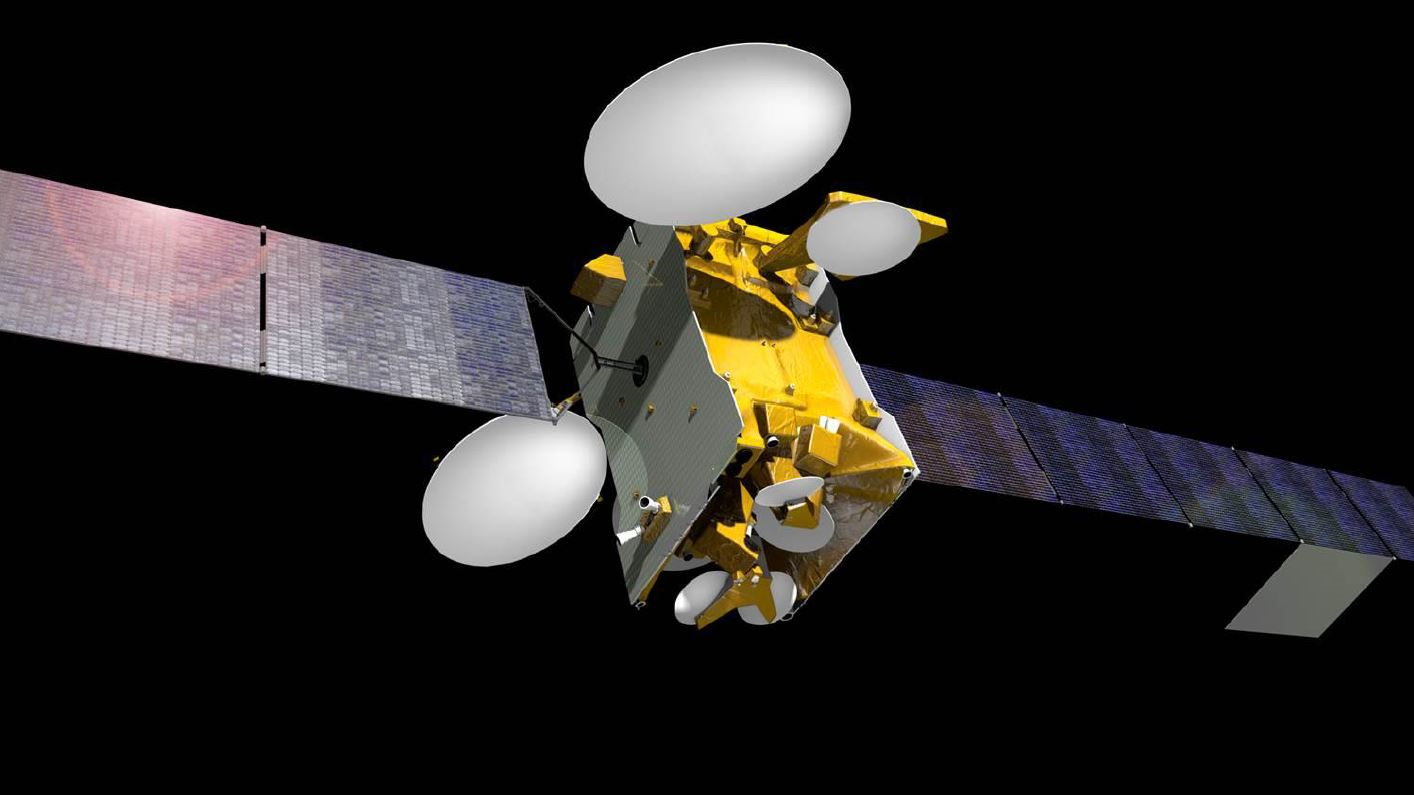
SES-10 satellite mission artwork. Credit: SES
Stay tuned here for Ken’s continuing Earth and Planetary science and human spaceflight news.
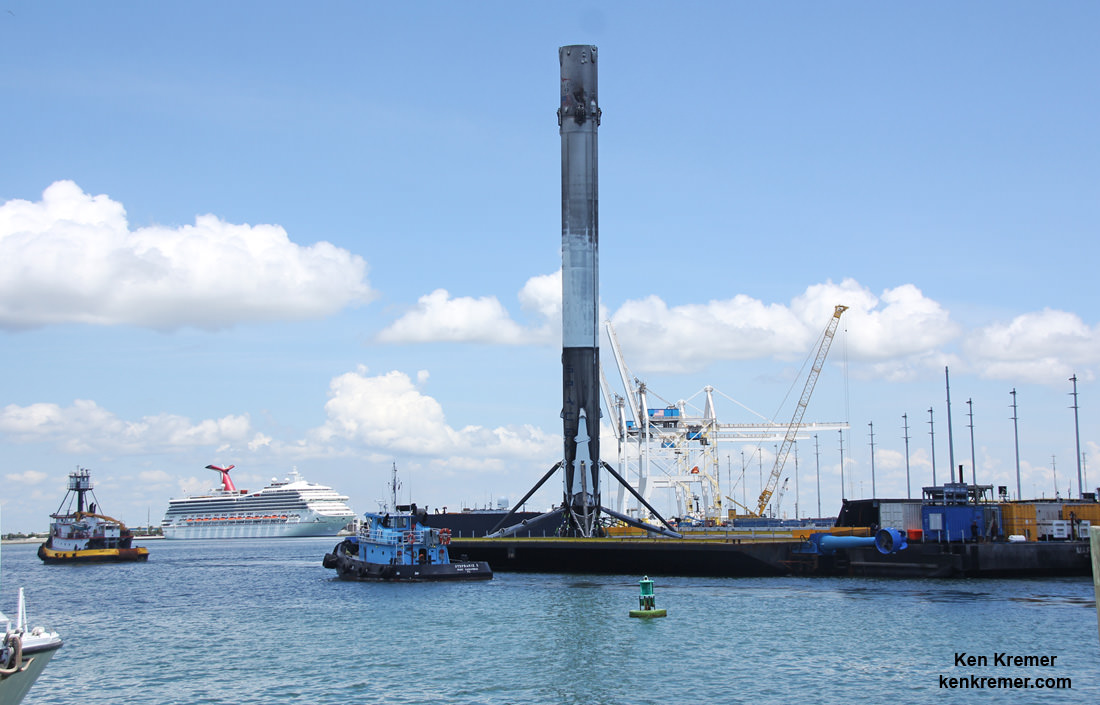
SpaceX Falcon 9 booster moving along the Port Canaveral channel atop droneship platform with cruise ship in background nears ground docking facility on June 2, 2016 following Thaicom-8 launch on May 27, 2016. Credit: Ken Kremer/kenkremer.com
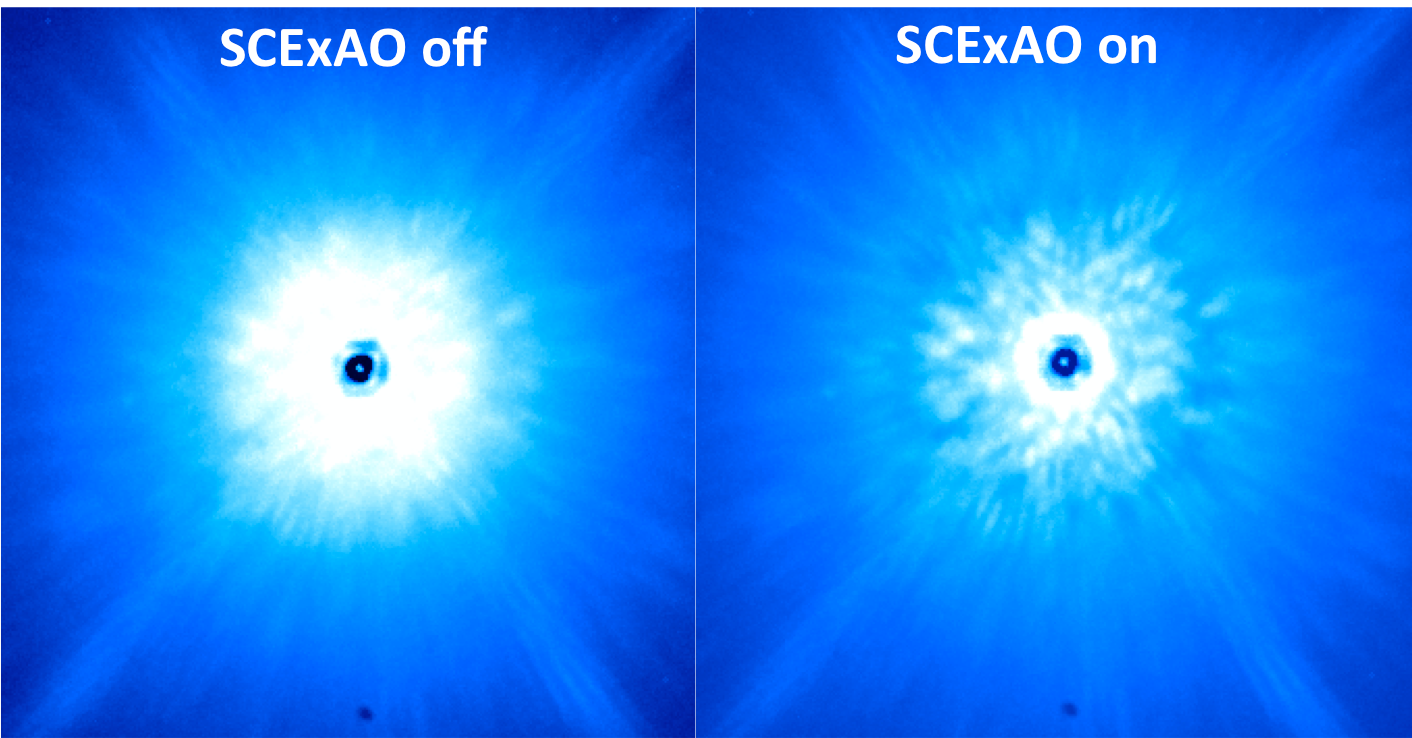
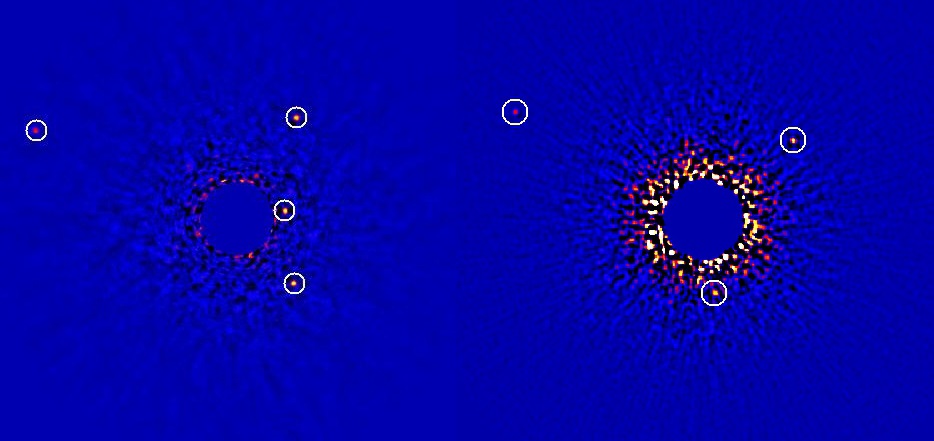
Comparison of images taken from existing, facility instrument (AO 188 + HiCIAO, left) and the newly commissioned instrument (AO 188 + SCExAO, right). Credit: NAOJ
Thanks to the deployment of the Kepler mission, thousands of extrasolar planet candidates have been discovered. Using a variety of indirect detection methods, astronomers have detected countless gas giants, super Earths, and other assorted bodies orbiting distant stars. And one terrestrial planet (Proxima b) has even been found lurking in the closest star system to Earth – Proxima Centauri.
The next step, quite logically, is to observe these planets directly. Hence why the Subaru Coronagraphic Extreme Adaptive Optics (SCExAO) instrument was commissioned at the National Astronomical Observatory of Japan (NAOJ) in Mauna Kea, Hawaii. Designed to allow for the direct detection of planets around other stars, this instrument will help ensure that the Subaru Telescope remains on the cutting-edge of exoplanet hunting.
As of January 22nd, 2017, some 3,565 exoplanet candidates have been detected in 2,675 planetary systems, and over 2000 of these have been confirmed. However, as already noted, the vast majority of these have been detected by indirect means – generally through the measurement of a star’s radial velocity, or by measuring dips in a star’s luminosity as an exoplanet passes in front of it (i.e. the transit method).
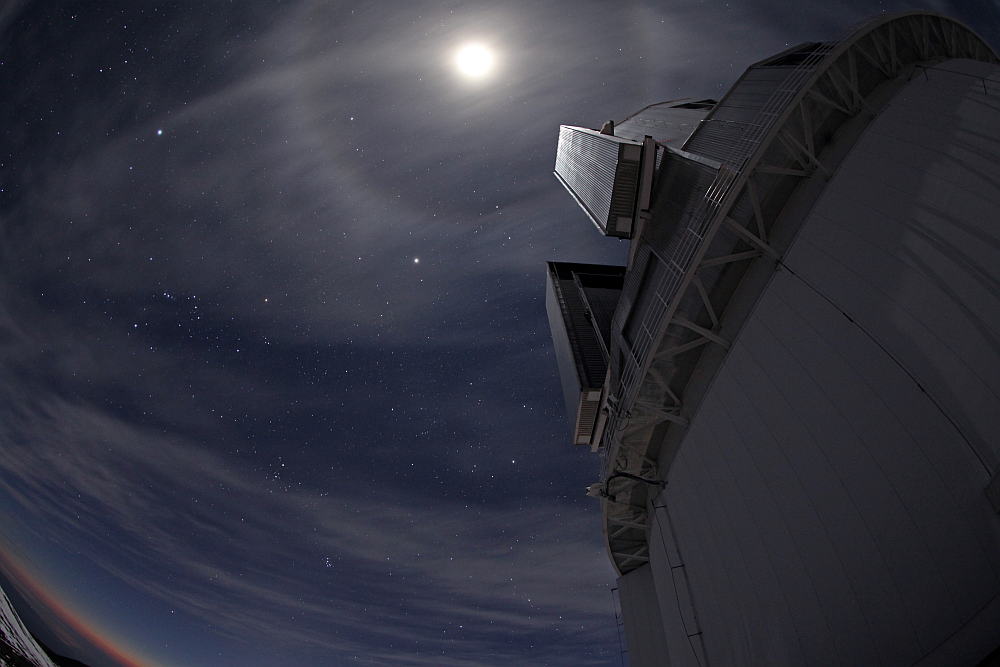
The Subaru Telescope atop Mauna Kea. CHARIS works in conjunction with Subaru. Credit: Dr. Hideaki Fujiwara/NAOJ
Adaptive Optics, meanwhile, have allowed for the detection of exoplanets directly. When used in astronomy, this technology removes the the effects of atmospheric interference so that light from distant stars or planets can be seen clearly. Relying on experimental technology, the SCExAO was specifically designed and optimized for imaging planets, and is one of several newly-commissioned extreme AO instruments.
However, as Dr. Thayne Currie – a research associate at the NOAJ – indicated, the Observatories on Mauna Kea are particularly well suited to the technology. “Mauna Kea is the best place on this planet to see planets in other stellar systems,” he said. “Now, we finally have an instrument designed to utilize this mountain’s special gifts and the results are breathtaking.”
What makes the SCExAO special is that it allows astronomers the ability to image planets with masses and orbital separations that are similar to those in our own Solar System. So far, about a dozen planets have been detected directly using AO instruments, but these planets have all been gas giants with 4 to 13 times the mass of Jupiter, and which orbit their stars at distances beyond that of Neptune from our Sun.
This improved imaging capacity is made possible by the SCExAO’s ability to compensate for atmospheric interference at a faster rate. This will enable the Subaru Telescope to be able to capture far images of distant stars that are sharper and subject to less glare. And astronomers will be able to discern the presence of fainter objects that are circling these stars – i.e. exoplanets – with greater ease.
The debris disk detected around a young star HD 36546 using SCExAO/HiCIAO (left, seen nearly edge-on) and its model (right, viewed face-on). Credit: NAOJ
The first discovery made with the SCExAO, took place back in October of 2016. At the time, the Subaru telescope had detected a debris disk around HD 36546 – a 2 solar-mass star in the direction of the Taurus constellation – which appeared almost edge on. Located about twice as far from HD 36546 as the Kuiper Belt is from our Sun, this disk is believed to be the youngest debris disk ever observed (3 to 10 million years old).
This test of the SCExAO not only revealed a disk that could be critical to studying the earliest stages of icy planet formation, but demonstrated the extreme sensitivity of the technology. Basically, it allowed the astronomers conducting the study to rule out the existence of any planets in the system, thus concluding that planetary dynamics played no role in sculpting the disk.
More recently, the SCExAO instrument managed to directly detect multiple planets in the system known as HR 8799, which it observed in July of 2016. Prior to this, some of the systems four planets were spotted by surveys conducted using the Keck and the Subaru telescope (before the SCExAO was incorporated). However, these surveys could not correct for all the glare coming from HR 8799, and could only image two of three of the planets as a result.
A follow-up was conducted in the Fall of 2016, combining data from the SCExAO with that obtained by the Coronagraphic High Angular Resolution Imaging Spectrograph (CHARIS). This resulted in even clearer detection of the system’s inner three planets, not to mention high-quality spectrographic data that could allow researchers to determine the chemical compositions of their atmospheres.
The star and multiple planet system HR 8799 imaged using the SCEAO and the HiCIAO camera (left) and the Keck facility AO system coupled with the NIRC2 camera (right). Credit: NAOJ
As Dr. Olivier Guyon, the head of the SCExAO project, explained, this is a major improvement over other AO surveys. It also presents some major advantages when it comes to exoplanet hunting. “With SCExAO, we know not only the presence of a planet but also its character such as whether it is cloudy and what molecules it has, even if that planet is tens of trillions of miles away.”
Looking at the year ahead, the SCExAO is scheduled to undergo improvements that will allow it to detect planets that are 10 to 10o times fainter than what it can right now. The CHARIS instrument is also scheduled for additional engineering tests to improve its capabilities. These improvements are also expected to be incorporated into next-generation telescopes like the Thirty Meter Telescope – which is currently under construction at Mauna Kea.
Other recently-commissioned extreme AO instruments include the Gemini Planet Imager (GPI) at Gemini Observatory on its telescope in Chile, the Spectro-Polarimetric High-contrast Exoplanet Research (SPHERE) on Very Large Telescope (VLT) in Chile, and the AO system on the Large Binocular Telescope (LBT) in Arizona. And these are only some of the current attempts to reduce interference and make exoplanets easier to detect.
For instance, coronagraph are another way astronomers are attempting to refine their search efforts. Consisting of tiny instruments that are fitted inside telescopes, coronagraphs block the incoming light of a star, thus enabling telescopes to spot the faint light being reflected from orbiting planets. When paired with spectrometers, scientists are able to conduct studies of these planet’s atmospheres.
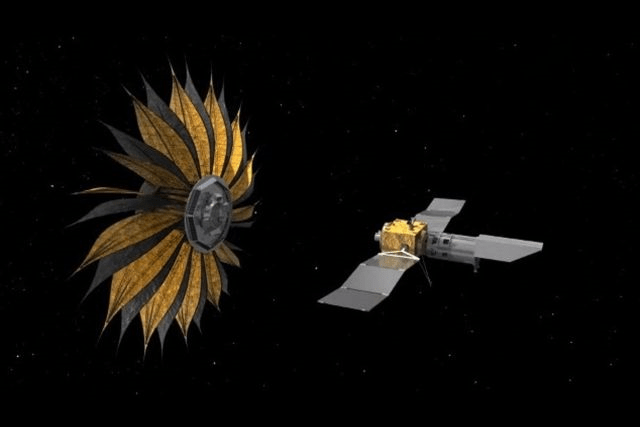
An artist’s illustration of the Starshade deployed near its companion space telescope. Credit: NASA
And then you have more ambitious projects like Starshade, a concept currently being developed by Northrop Grumman with the support of NASA’s Jet Propulsion Laboratory. This concept calls for a giant, flower-shaped screen that would be launched with one of NASA’s next-generation space telescopes. Once deployed, it would fly around in front of the telescope in order to obscure the light coming from distant stars.
The era of exoplanet discovery loometh! In the coming decades, we are likely to see an explosion in the number of planets were are able to observe directly. And in so doing, we can expect the number of potentially habitable exoplanets to grow accordingly.
The familiar W patterns of the Cassiopeia constellation. Credit & Copyright: Rogelio Bernal Andreo (Deep Sky Colors)
Welcome back to Constellation Friday! Today, in honor of the late and great Tammy Plotner, we will be dealing with the “keel of the ship”, the Carina constellation!
In the 2nd century CE, Greek-Egyptian astronomer Claudius Ptolemaeus (aka. Ptolemy) compiled a list of all the then-known 48 constellations. This treatise, known as the Almagest, would be used by medieval European and Islamic scholars for over a thousand years to come, effectively becoming astrological and astronomical canon until the early Modern Age.
One of the most famous of these constellations is Cassiopeia, which is easily recognized by its W-shape in the sky. As one of the 48 constellation included in the Almagest, it is now one of the 88 modern constellations recognized by the IAU. Located in the norther sky opposite of the Big Dipper (Ursa Major), it is bordered by Camelopardalis, Cepheus, Lacerta, Andromeda and Perseus.
Name and Meaning:
In mythology, Cassiopeia the wife of King Cepheus and the queen of the mythological Phoenician realm of Ethiopia. Her name in Greek means “she whose words excel”, and she was renowned for her beauty but also her arrogance. This led to her downfall, as she boasted that both she and her daughter Andromeda were more beautiful than all the Nereids – the nymph-daughters of the sea god Nereus.
Cassiopeia in her chair, as depicted in Urania’s Mirror. Credit: Sidney Hall/United States Library of Congress
This led the Nerieds to unleash the wrath of Poseidon upon the kingdom of Ethiopia.Accounts differ as to whether Poseidon decided to flood the whole country or direct the sea monster Cetus to destroy it. In either case, trying to save their kingdom, Cepheus and Cassiopeia consulted a wise oracle, who told them that the only way to appease the sea gods was to sacrifice their daughter.
Accordingly, Andromeda was chained to a rock at the sea’s edge and left there to helplessly await her fate at the hands of Cetus. But the hero Perseus arrived in time, saved Andromeda, and ultimately became her husband. Since Poseidon thought that Cassiopeia should not escape punishment, he placed her in the heavens in such a position that, as she circles the celestial pole, she is upside-down for half the time.
History of Observation:
Cassiopeia was one of the traditional constellations included by Ptolemy in his 2nd century CE tract, the Almagest. It also figures prominently in the astronomical and astrological traditions of the Polynesian, Indian, Chinese and Arab cultures. In Chinese astronomy, the stars forming the constellation Cassiopeia are found among the areas of the Purple Forbidden enclosure, the Black Tortoise of the North, and the White Tiger of the West.
Chinese astronomers also identified various figures in its major stars. While Kappa, Eta, and Mu Cassopeiae formed a constellation called the Bridge of the Kings, when combined with Alpha and Beta Cassiopeiae – they formed the great chariot Wang-Liang. In Indian astronomy, Cassiopeia was associated with the mythological figure Sharmishtha – the daughter of the great Devil (Daitya) King Vrishparva and a friend to Devavani (Andromeda).
Kappa Cassiopeiae and its bow shock. Spitzer infrared image (NASA/JPL-Caltech)
Arab astronomers also associated Cassiopeia’s stars with various figures from their mythology. For instance, the stars of Alpha, Beta, Gamma, Delta, Epsilon and Eta Cassiopeiae were often depicted as the “Tinted Hand” in Arab atlases – a woman’s hand dyed red with henna, or the bloodied hand of Muhammad’s daughter Fatima. The arm was made up of stars from the neighboring Perseus constellation.
Another Arab constellation that incorporated the stars of Cassiopeia was the Camel. Its head was composed of Lambda, Kappa, Iota, and Phi Andromedae; its hump was Beta Cassiopeiae; its body was the rest of Cassiopeia, and the legs were composed of stars in Perseus and Andromeda.
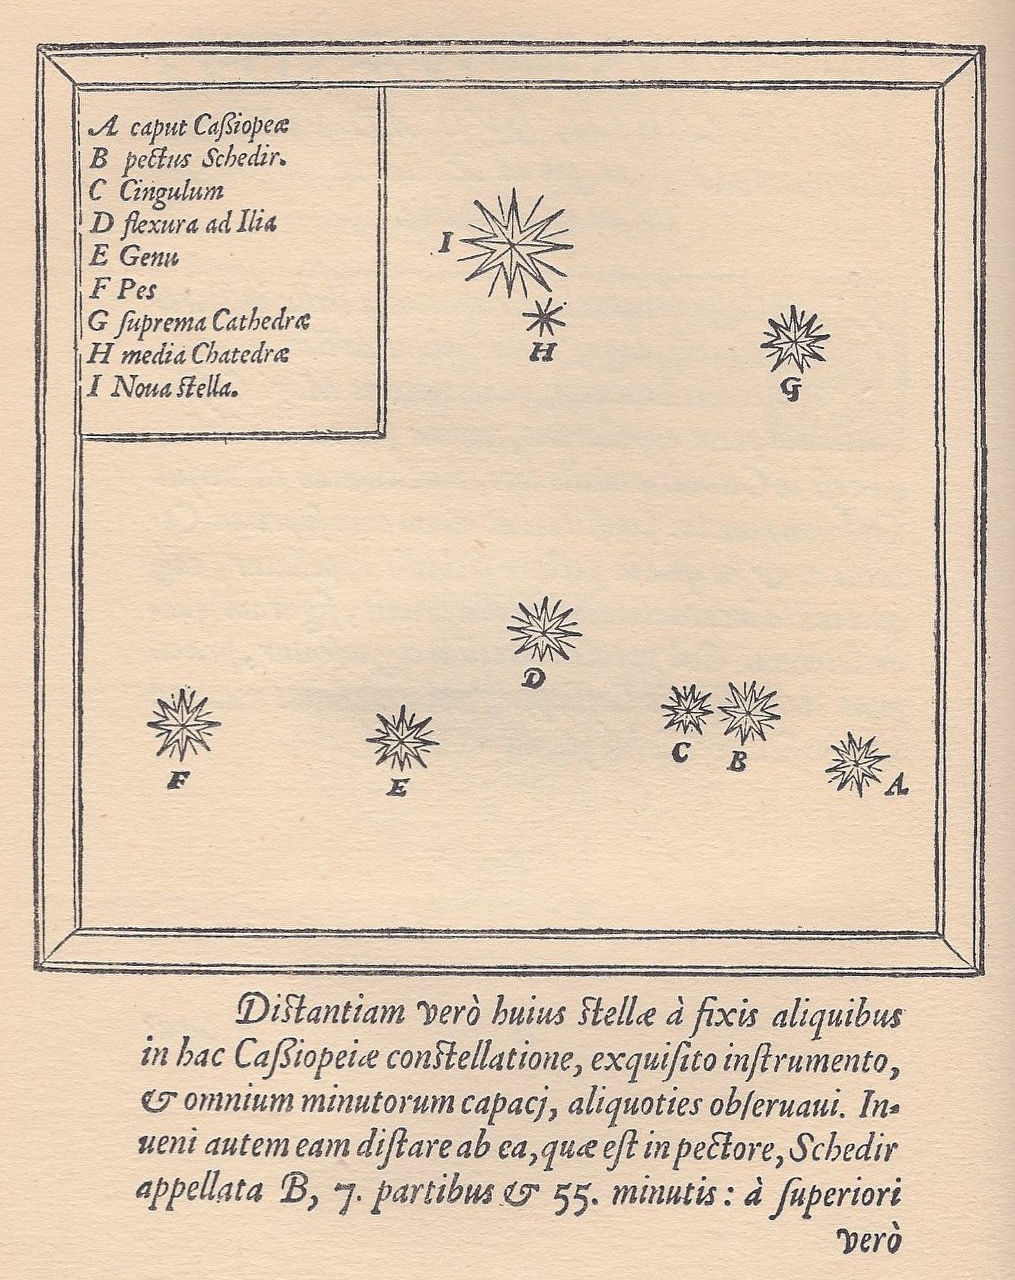
In November of 1572, astronomers were stunned by the appearance of a new star in the constellation – which was later named Tycho’s Supernova (SN 1572), after astronomer Tycho Brahe who recorded its discovery. At the time of its discovery, SN1572 was a Type Ia supernova that actually rivaled Venus in brightness. The supernova remained visible to the naked eye into 1574, gradually fading until it disappeared from view.
The “new star” helped to shatter stale, ancient models of the heavens by demonstrating that the heavens were not “unchanging”. It helped speed the the revolution that was already underway in astronomy and also led to the production of better astrometric star catalogues (and thus the need for more precise astronomical observing instruments).
Star map of the constellation Cassiopeia showing the position (labelled I) of the supernova of 1572. Credit: Wikipedia Commons
To be fair, Tycho was not even close to being the first to observe the 1572 supernova, as his contemporaries Wolfgang Schuler, Thomas Digges, John Dee and Francesco Maurolico produced their own accounts of its appearance. But he was apparently the most accurate observer of the object and did extensive work in both observing the new star and in analyzing the observations of many other astronomers.
Notable Features:
This zig-zag shaped circumpolar asterism consists of 5 primary stars (2 of which are the most luminous in the Milky Way Galaxy) and 53 Bayer/Flamsteed designated stars. It’s brightest star – Beta Cassiopeiae, otherwise known by its traditional name Caph – is a yellow-white F-type giant with a mean apparent magnitude of +2.28. It is classified as a Delta Scuti type variable star and its brightness varies from magnitude +2.25 to +2.31 with a period of 2.5 hours.
Now move along the line to the next bright star – Alpha. Its name is Schedar and its an orange giant (spectral type K0 IIIa), a type of star cooler but much brighter than our Sun. In visible light only, it is well over 500 times brighter than the Sun. According to the Hipparcos astrometrical satellite, distance to the star is about 230 light years (or 70 parsecs).
Continue up the line for Eta, marked by the N shape and take a look in a telescope. Eta Cassiopeiae’s name is Achird and its a multiple is a star system 19.4 light years away from Earth. The primary star in the Eta Cassiopeiae system is a yellow dwarf (main sequence star) of spectral type G0V, putting it in the same spectral class as our Sun, which is of spectral type G2V. It therefore resembles what our Sun might look like if we were to observe it from Eta Cassiopeiae.
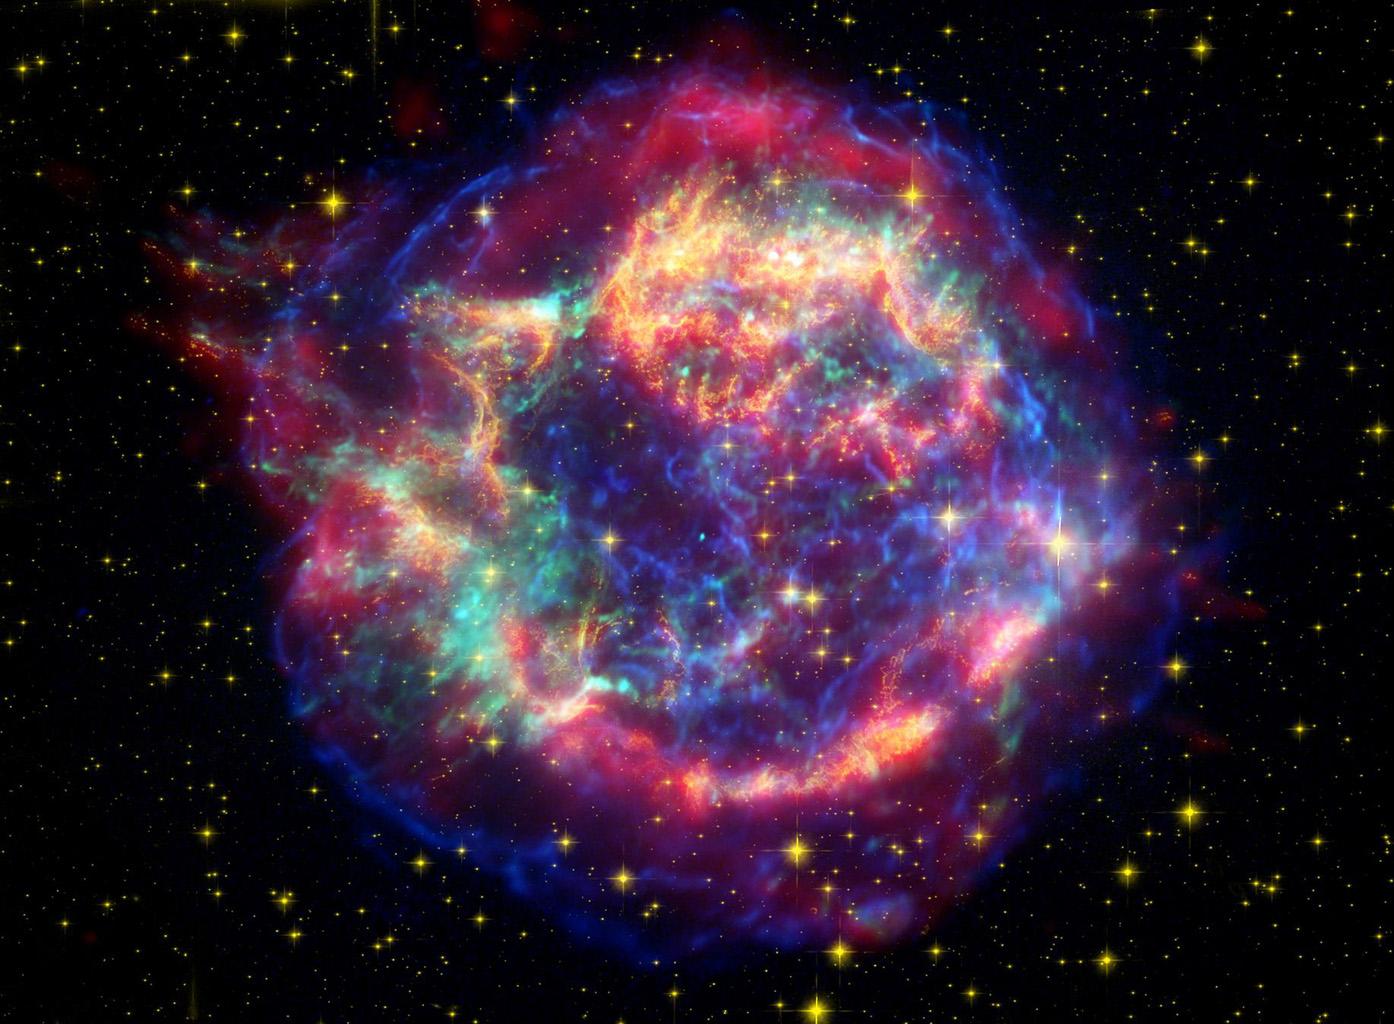
Mosaic image of Cassiopeia A, a supernova remnant, taken by the Hubble and Spitzer Space Telescopes. Credit: NASA/JPL-Caltech/STScI/CXC/SAO
The star is of apparent magnitude 3.45. The star has a cooler and dimmer (magnitude 7.51) orange dwarf companion of spectral type K7V. Based on an estimated semi major axis of 12″ and a parallax of 0.168 mas, the two stars are separated by an average distance of 71 AU. However, the large orbital eccentricity of 0.497 means that their periapsis, or closest approach, is as small as 36 AU.
The next star in line towards the pole is Gamma, marked by the Y shape. Gamma Cassiopeiae doesn’t have a proper name, but American astronaut Gus Grissom nicknamed it “Navi” since it was an easily identifiable navigational reference point during space missions. The apparent magnitude of this star was +2.2 in 1937, +3.4 in 1940, +2.9 in 1949, +2.7 in 1965 and now it is +2.15. This is a rapidly spinning star that bulges outward along the equator. When combined with the high luminosity, the result is mass loss that forms a disk around the star.
Gamma Cassiopeiae is a spectroscopic binary with an orbital period of about 204 days and an eccentricity alternately reported as 0.26 and “near zero.” The mass of the companion is believed to be comparable to our Sun (Harmanec et al. 2000, Miroschnichenko et al. 2002). Gamma Cas is also the prototype of a small group of stellar sources of X-ray radiation that is about 10 times higher that emitted from other B or Be stars, which shows very short term and long-term cycles.
Now move over to Delta Cassiopeiae, the figure 8. It’s traditional name is Ruchbah, the “knee”. Delta Cassiopeiae is an eclipsing binary with a period of 759 days. Its apparent magnitude varies between +2.68 mag and +2.74 with a period of 759 days. It is of spectral class A3, and is approximately 99 light years from Earth.
Last in line on the end is Epsilon, marked with the backward 3. Epsilon Cassiopeiae’s tradition name is Segin. It is approximately 441 light years from Earth. It has an apparent magnitude of +3.38 and is a single, blue-white B-type giant with a luminosity 720 times that of the Sun.
Finding Cassiopeia:
Cassiopeia constellation is located in the first quadrant of the northern hemisphere (NQ1) and is visible at latitudes between +90° and -20°. It is the 25th largest constellation in the night sky and is best seen during the month of November. Due to its distinctive shape and proximity to the Big Dipper, it is very easy to find. And the constellation has plenty of stars and Deep Sky Objects that can be spotted using a telescope or binoculars.
First, let’s begin by observing Messier 52. This one’s easiest found first in binoculars by starting at Beta, hopping to Alpha as one step and continuing the same distance and trajectory as the next step. M52 (NGC 7654) is a fine open cluster located in a rich Milky Way field. The brightest main sequence star of this cluster is of mag 11.0 and spectral type B7.
Two yellow giants are brighter: The brightest is of spectral type F9 and mag 7.77, the other of type G8 and mag 8.22. Amateurs can see M52 as a nebulous patch in good binoculars or finder scopes. In 4-inch telescopes, it appears as a fine, rich compressed cluster of faint stars, often described as of fan or “V” shape; the bright yellow star is to the SW edge. John Mallas noted “a needle-shaped inner region inside a half-circle.” M52 is one of the original discoveries of Charles Messier, who cataloged it on September 7, 1774 when the comet of that year came close to it.
The location of the Cassiopeia constellation in the northern sky. Credit: IAU/Sky&Telescope magazine
For larger telescopes, situated about 35′ southwest of M52 is the Bubble Nebula NGC 7635, a diffuse nebula which appears as a large, faint and diffuse oval, about 3.5×3′ around the 7th-mag star HD 220057 of spectral type B2 IV. It is difficult to see because of its low surface brightness. Just immediately south of M52 is the little conspicuous open cluster Czernik 43 (Cz 43).
Now let’s find Messier 103 by returning to Delta Cassiopeiae. In binoculars, M103 is easy to find and identify, and well visible as a nebulous fan-shaped patch. Mallas states that a 10×40 finder resolves the cluster into stars; however, this is so only under very good viewing conditions. The object is not so easy to identify in telescopes because it is quite loose and poor, and may be confused with star groups or clusters in the vicinity.
But telescopes show many fainter member stars. M103 is one of the more remote open clusters in Messier’s catalog, at about 8,000 light years. While you are there, enjoy the other small open clusters that are equally outstanding in a telescope, such as NGC 659, NGC 663 and NGC 654. But, for a real star party treat, take the time to go back south and look up galactic star cluster NGC 457.
It contains nearly one hundred stars and lies over 9,000 light years away from the Sun. The cluster is sometimes referred by amateur astronomers as the Owl Cluster, or the ET Cluster, due to its resemblance to the movie character. Those looking for a more spectacular treat should check out NGC 7789 – a rich galactic star cluster that was discovered by Caroline Herschel in 1783. Her brother William Herschel included it in his catalog as H VI.30.
Chandra image of the Supernova remnant of Tycho’s Nova. Credit: NASA/CXC/Rutgers/J.Warren & J.Hughes et al.
This cluster is also known as “The White Rose” Cluster or “Caroline’s Rose” Cluster because when seen visually, the loops of stars and dark lanes look like the swirling pattern of rose petals as seen from above. At 1.6 billion years old, this cluster of stars is beginning to show its age. All the stars in the cluster were likely born at the same time but the brighter and more massive ones have more rapidly exhausted the hydrogen fuel in their cores.
Are you interested in faint nebulae? Then try your luck with IC 59. One of two arc-shaped nebulae (the other is IC 63) that are associated with the extremely luminous star Gamma Cassiopeiae. IC 59 lies about 20′ to the north of Gamma Cas and is primarily a reflection nebula. Other faint emission nebulae include the “Heart and Soul” (LBN 667 and IC 1805) which includes wide open star clusters Collider 34 and IC 1848.
Of course, no trip through Cassiopeia would be complete without mentioning Tycho’s Star! Given the role this “new star” played in the history of astronomy (and as one of only 8 recorded supernovas that was visible with the naked eye), it is something no amateur astronomer or stargazer should pass up!
While there is no actual meteoroid stream associated with the constellation of Cassiopeia, there is a meteor shower which seems to emanate near it. On August 31st the Andromedid meteor shower peaks and its radiant is nearest to Cassiopeia. Occasionally this meteor shower will produce some spectacular activity but usually the fall rate only averages about 20 per hour. There can be some red fireballs with trails. Biela’s Comet is the associated parent with the meteor stream.
Meredith is a Postdoctoral Researcher in the Department of Astronomy at the University of Washington. She writes software to prepare for the coming onslaught of data from the Large Synoptic Survey Telescope and studies weird binary stars. She is also the lead organizer of the ComSciCon-Pacific Northwest workshop for STEM graduate students in Seattle this March. Meredith holds degrees in physics and astronomy from Harvey Mudd College, San Diego State University, and New Mexico State University. When she’s not science-ing or telling people all about it, she plays viola, volunteers at summer camp, and advocates for more equity and less light pollution.
We use a tool called Trello to submit and vote on stories we would like to see covered each week, and then Fraser will be selecting the stories from there. Here is the link to the Trello WSH page (http://bit.ly/WSHVote), which you can see without logging in. If you’d like to vote, just create a login and help us decide what to cover!
If you would like to join the Weekly Space Hangout Crew, visit their site here and sign up. They’re a great team who can help you join our online discussions!
If you would like to sign up for the AstronomyCast Solar Eclipse Escape, where you can meet Fraser and Pamela, plus WSH Crew and other fans, visit our site linked above and sign up!
We record the Weekly Space Hangout every Friday at 12:00 pm Pacific / 3:00 pm Eastern. You can watch us live on Universe Today, or the Universe Today YouTube page
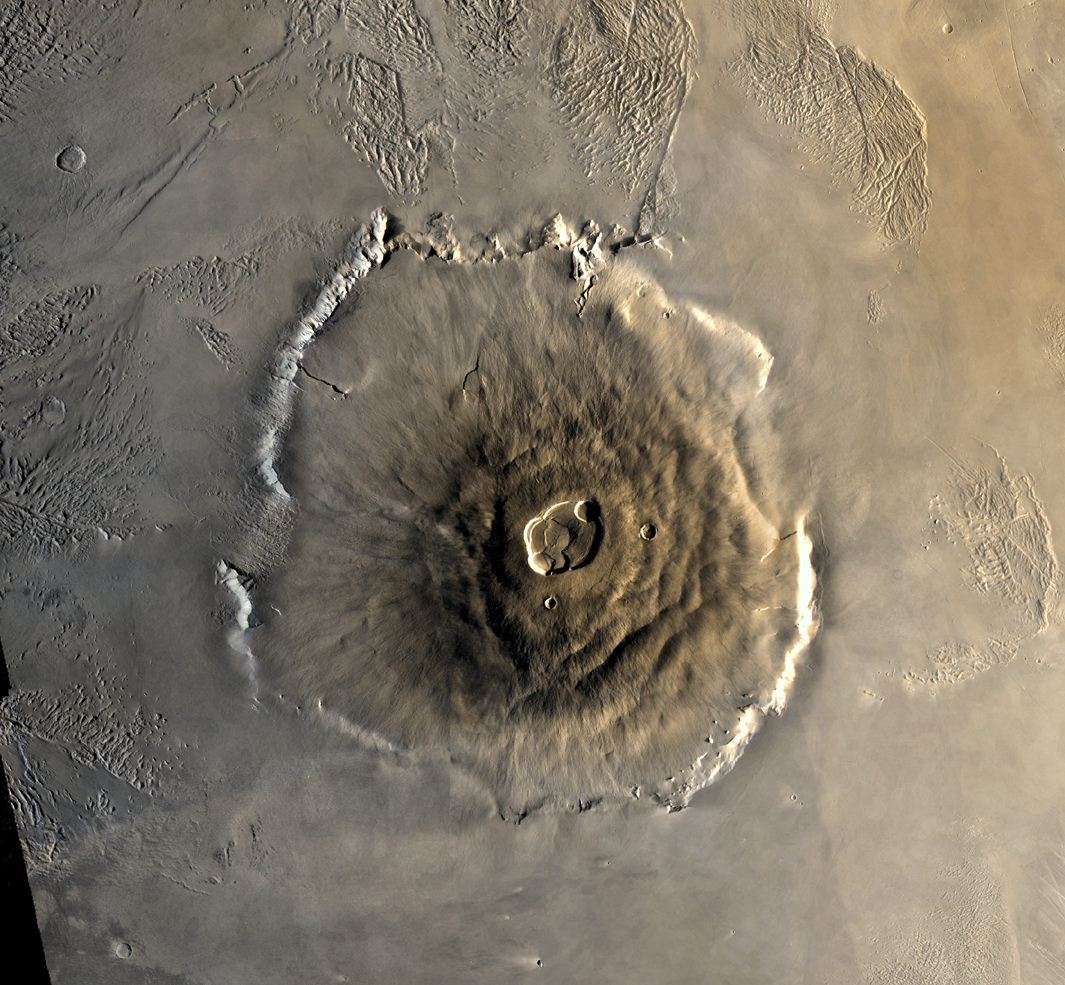
Olympus Mons on Mars is the largest volano in our Solar System. Analysis of a Martian meteorite that fell to Earth in 2012 confirms that Mars also has the longest-lived volcanoes in our Solar System. Image: NASA/JPL
Mars is renowned for having the largest volcano in our Solar System, Olympus Mons. New research shows that Mars also has the most long-lived volcanoes. The study of a Martian meteorite confirms that volcanoes on Mars were active for 2 billion years or longer.
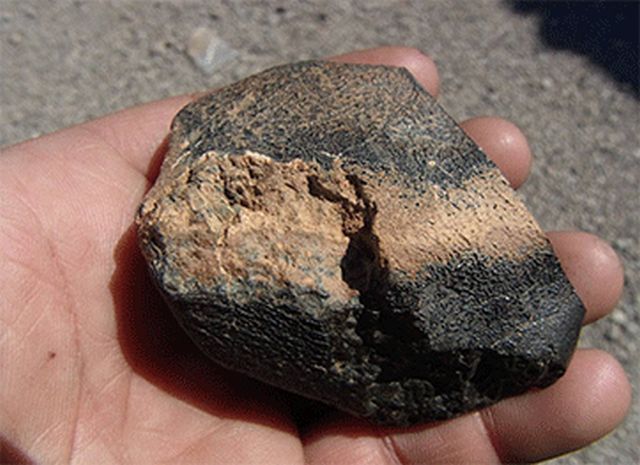
A lot of what we know about the volcanoes on Mars we’ve learned from Martian meteorites that have made it to Earth. The meteorite in this study was found in Algeria in 2012. Dubbed Northwest Africa 7635 (NWA 7635), this meteorite was actually seen travelling through Earth’s atmosphere in July 2011.
A sample from the meteorite Northwest Africa 7635. Image: Mohammed Hmani
The lead author of this study is Tom Lapen, a Geology Professor at the University of Houston. He says that his findings provide new insights into the evolution of the Red Planet and the history of volcanic activity there. NWA 7635 was compared with 11 other Martian meteorites, of a type called shergottites. Analysis of their chemical composition reveals the length of time they spent in space, how long they’ve been on Earth, their age, and their volcanic source. All 12 of them are from the same volcanic source.
Mars has much weaker gravity than Earth, so when something large enough slams into the Martian surface, pieces of rock are ejected into space. Some of these rocks eventually cross Earth’s path and are captured by gravity. Most burn up, but some make it to the surface of our planet. In the case of NWA 7635 and the other meteorites, they were ejected from Mars about 1 million years ago.
“We see that they came from a similar volcanic source,” Lapen said. “Given that they also have the same ejection time, we can conclude that these come from the same location on Mars.”
Taken together, the meteorites give us a snapshot of one location of the Martian surface. The other meteorites range from 327 million to 600 million years old. But NWA 7635 was formed 2.4 billion years ago. This means that its source was one of the longest lived volcanoes in our entire Solar System.
This false color X-ray of NWA 7635 shows the meteorite’s mineralogy mineral textures. O, olivine; P, plagioclase (maskelynite); C, clinopyroxene (augite). Chemical compositions: Fe (purple), Mg (green), Ca (blue), Ti (magenta), and S (yellow). Purple colors in the mesostasis represent Fe-rich augite. You’re welcome, mineral nerds. Image: Lapen et. al.
Volcanic activity on Mars is an important part of understanding the planet, and whether it ever harbored life. It’s possible that so-called super-volcanoes contributed to extinctions here on Earth. The same thing may have happened on Mars. Given the massive size of Olympus Mons, it could very well have been the Martian equivalent of a super-volcano.
The ESA’s Mars Express Orbiter sent back images of Olympus Mons that showed possible lava flows as recently as 2 million years ago. There are also lava flows on Mars that have a very small number of impact craters on them, indicating that they were formed recently. If that is the case, then it’s possible that Martian volcanoes will be visibly active again.
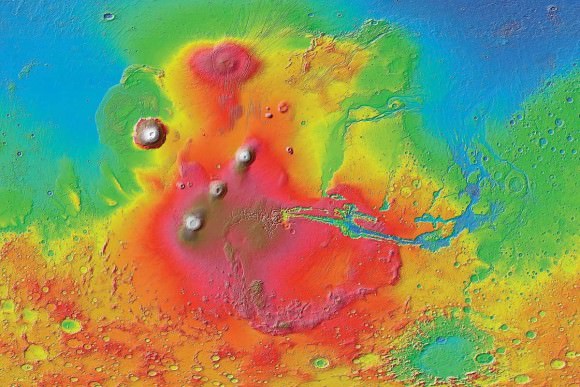
A colorized image of the surface of Mars taken by the Mars Reconnaissance Orbiter. The line of three volcanoes is the Tharsis Montes, with Olympus Mons to the northwest. Valles Marineris is to the east. Image: NASA/JPL-Caltech/ Arizona State University
Continuing volcanic activity on Mars is highly speculative, with different researchers arguing for and against it. The relatively crater-free, smooth surfaces of some lava features on Mars could be explained by erosion, or even glaciation. In any case, if there is another eruption on Mars, we would have to be extremely lucky for one of our orbiters to see it.