Small changes can have a big impact. But can a butterfly’s wingbeat in the Amazon really impact the weather halfway across the world? And where do small changes have no impact?
Visit the Astronomy Cast Page to subscribe to the audio podcast!
We usually record Astronomy Cast as a live Google+ Hangout on Air every Friday at 1:30 pm Pacific / 4:30 pm Eastern. You can watch here on Universe Today or from the Astronomy Cast Google+ page.
And if you’re interested in looking back, here’s an archive to all the past Carnivals of Space. If you’ve got a space-related blog, you should really join the carnival. Just email an entry to [email protected], and the next host will link to it. It will help get awareness out there about your writing, help you meet others in the space community – and community is what blogging is all about. And if you really want to help out, sign up to be a host. Send an email to the above address.
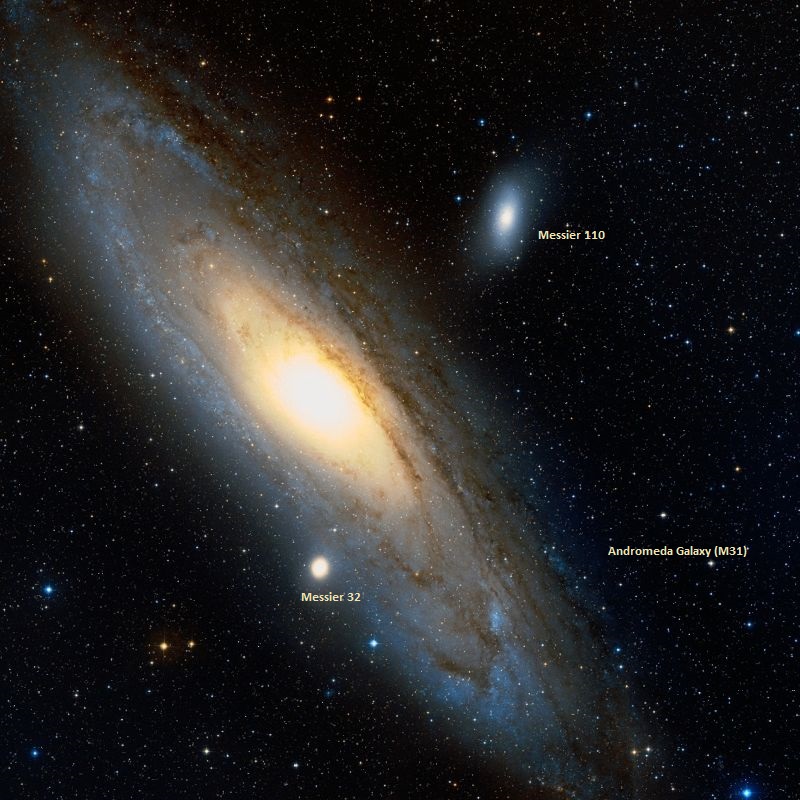
Messier 31 (the Andromeda Galaxy), along with Messier 32 and Messier 110. Credit: Wikisky
Welcome back to Messier Monday! In our ongoing tribute to the great Tammy Plotner, we take a look at the Andromeda Galaxy, also known as Messier 31. Enjoy!
During the 18th century, famed French astronomer Charles Messier noted the presence of several “nebulous objects” in the night sky. Having originally mistaken them for comets, he began compiling a list of them so that others would not make the same mistake he did. In time, this list (known as the Messier Catalog) would come to include 100 of the most fabulous objects in the night sky.
One of these objects is the famed Andromeda Galaxy, the closest spiral galaxy to the Milky Way which is named for the area of the sky it appears in (in the vicinity of the Andromeda constellation). It is the largest galaxy in the Local Group, and has the distinction of being one of the few objects that is actually getting closer to the Milky Way (and is expected to merge with us in a few billion years!).
Description:
Approaching us at roughly 300 kilometers per second, our massive galactic neighbor has been the object of studies of spiral structure, globular and open clusters, interstellar matter, planetary nebulae, supernova remnants, galactic nucleus, companion galaxies, and more for as long as we’ve been peering its way with a telescope. It’s part of our Local Group of galaxies and its two easily visible companions are only part of the eleven others that swarm around it.
One day, this galaxy will collide with our own, much as it is now consuming its neighbor – M32. However, this won’t come to pass for several billions years, so don’t go worrying about the immense gravitational disturbances just yet! And not surprisingly, a giant galaxy like Andromeda doesn’t get to be so big by keeping to itself. How many times now has the Great Andromeda Galaxy consumed another? More than once!
In 1993, the Hubble Space Telescope revealed that M31 has a double nucleus – a ‘leftover’ from another meal! As NASA and the ESA stated about the discovery at the time:
“Each of the two light-peaks contains a few million densely packed stars. The brighter object is the “classic” nucleus as studied from the ground. However, HST reveals that the true center of the galaxy is really the dimmer component. One possible explanation is that the brighter cluster is the leftover remnant of a galaxy cannibalized by M31. Another idea is that the true center of the galaxy has been divided in two by deep dust absorption across the middle, creating the illusion of two peaks. This green-light image was taken with HST’s Wide Field and Planetary Camera (WF/PC), in high resolution mode, on July 6, 1991. The two peaks are separated by 5 light-years. The Hubble image is 40 light-years across.”
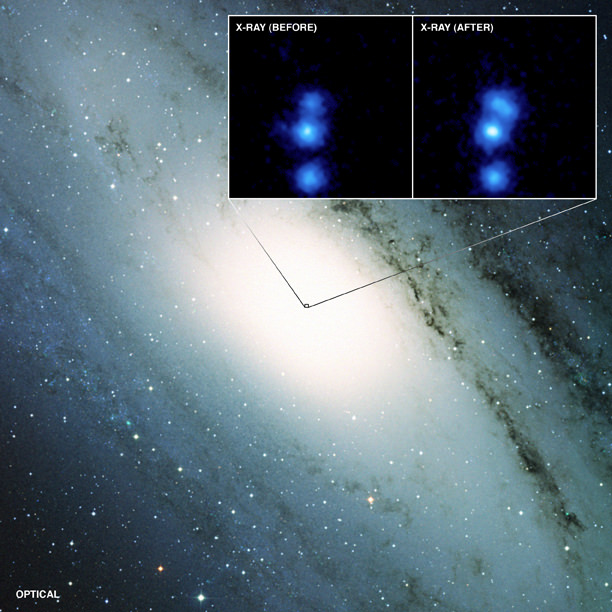
Perhaps one of the most fascinating discovery recent years in Messier 31 was made by the orbiting Chandra X-Ray Observatory. The X-ray image below, made with the Chandra X-Ray Astronomy Center’s Advanced CCD Imaging Spectrometer (ACIS), shows the central portion of the Andromeda Galaxy. The Chandra X-ray Observatory is part of NASA’s fleet of “Great Observatories” along with the Hubble Space Telescope.
The Andromeda galaxy as seen in optical light, and Chandra’s X-ray vision of the changing supermassive black hole in Andromeda’s heart. Credit: X-Ray NASA/CXC/SAO/Li et al.), Optical (DSS)
The blue dot in the center of the image is a “cool” million degree X-ray source where Andromeda’s massive central object, with the mass of 30 million suns, is located, which many astronomers consider to be a supermassive black hole. Most of these are probably due to X-ray binary systems, in which a neutron star (or perhaps a stellar black hole) is in a close orbit around a normal star.”
Over the years our studies have advanced even more with the discovery of an eclipsing binary star in Messier 31. As Ignasi Ribas (et al) put it in a 2005:
“We present the first detailed spectroscopic and photometric analysis of an eclipsing binary in the Andromeda Galaxy (M31). This is a 19.3 mag semidetached system with late O and early B spectral type components. From the light and radial velocity curves we have carried out an accurate determination of the masses and radii of the components. Their effective temperatures have been estimated by modeling the absorption-line spectra. The analysis yields an essentially complete picture of the properties of the system, and hence an accurate distance determination to M31.”
In 2005, we discovered more. At that time, Scott Chapman of Caltech, Rodrigo Ibata of the Observatoire de Strasbourg, and their colleagues conducted detailed studies on the motions and metals of nearly 10,000 stars in Andromeda, which that the galaxy’s stellar halo is “metal-poor.” Essentially, this indicated that the stars lying in the outer bounds of the galaxy are lacking in elements heavier than hydrogen.
Image of the Andromeda Galaxy, showing Messier 32 to the lower left, which is currently merging with Andromeda. Credit: Wikipedia Commons/Torben Hansen
According to Chapman, this was surprising since one of the key differences thought to exist between Andromeda and the Milky Way was that the former’s stellar halo was metal-rich and the latter’s was metal-poor. If both galaxies are metal-poor, then they must have had very similar evolutions. As Chapman explained:
“Probably, both galaxies got started within a half billion years of the Big Bang, and over the next three to four billion years, both were building up in the same way by protogalactic fragments containing smaller groups of stars falling into the two dark-matter haloes.”
While no one yet knows what dark matter is made of, its existence is well established because of the mass that must exist in galaxies for their stars to orbit the galactic centers. In fact, current theories of galactic evolution assume that dark-matter wells acted as a sort of “seed” for today’s galaxies, with the dark matter pulling in smaller groups of stars as they passed nearby.
What’s more, galaxies like Andromeda and the Milky Way have each probably gobbled up about 200 smaller galaxies and protogalactic fragments over the last 12 billion years. Chapman and his colleagues arrived at the conclusion about the metal-poor Andromeda halo by obtaining careful measurements of the speed at which individual stars are coming directly toward or moving directly away from Earth.
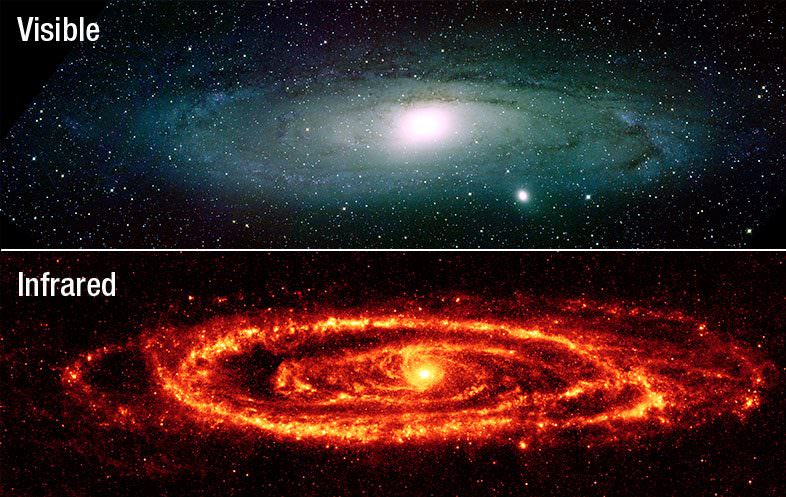
The Andromeda Galaxy, viewed using conventional optics and IR. Credit: Kitt Peak National Observatory
This measure is called the radial velocity, and can be determined very accurately with the spectrographs of major instruments such as the 10-meter Keck-II telescope, which was used in the study. Of the approximately 10,000 Andromeda stars for which the researchers have obtained radial velocities, about 1,000 turned out to be stars in the giant stellar halo that extends outward by more than 500,000 light-years.
These stars, because of their lack of metals, are thought to have formed quite early, at a time when the massive dark-matter halo had captured its first protogalactic fragments. The stars that dominate closer to the center of the galaxy, by contrast, are those that formed and merged later, and contain heavier elements due to stellar evolution processes.In addition to being metal-poor, the stars of the halo follow random orbits and are not in rotation.
By contrast, the stars of Andromeda’s visible disk are rotating at speeds upwards of 200 kilometers per second.According to Ibata, the study could lead to new insights on the nature of dark matter. “This is the first time we’ve been able to obtain a panoramic view of the motions of stars in the halo of a galaxy,” says Ibata. “These stars allow us to weigh the dark matter, and determine how it decreases with distance.”
History of Observation:
Andromeda was known as the “Little Cloud” to Persian astronomer Abd-al-Rahman Al-Sufi, who described and depicted it in 964 AD in his Book of Fixed Stars. This wonderful galaxy was also cataloged by Giovanni Batista Hodierna in 1654, Edmund Halley in 1716, by Bullialdus 1664, and again by Charles Messier in 1764.
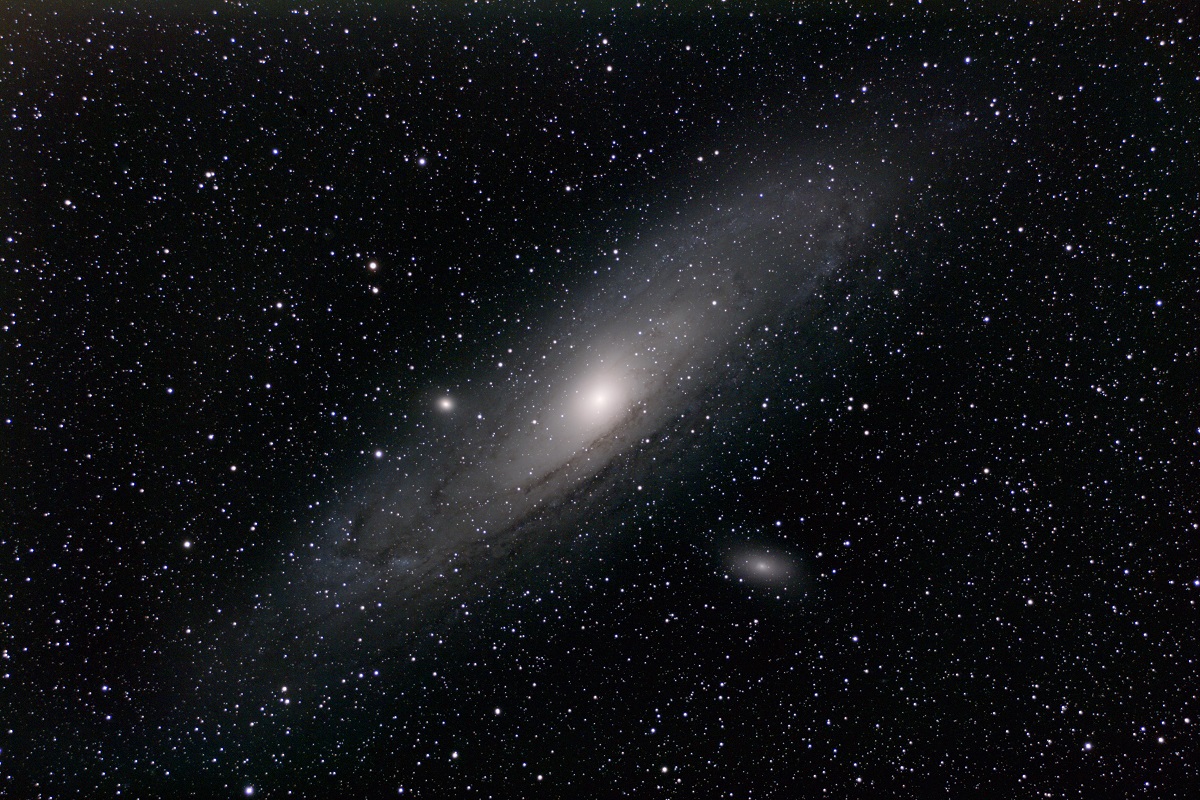
The Andromeda Galaxy is a spiral galaxy approximately 2.5 million light-years away in the constellation Andromeda. Credit: Wikipedia Commons/Adam Evans
Like most of the objects he added to the Messier Catalog, he mistook the galaxy initially for a nebulous object. As he wrote of the object in his notes:
“The sky has been very good in the night of August 3 to 4, 1764; and the constellation Andromeda was near the Meridian, I have examined with attention the beautiful nebula in the girdle of Andromeda, which was discovered in 1612 by Simon Marius, and which has been observed since with great care by different astronomers, and at last by M. le Gentil who has given a very ample and detailed description in the volume of the Memoirs of the Academy for 1759, page 453, with a drawing of its appearance. I will not report here what I have written in my Journal: I have employed different instruments for examining that nebula, and above all an excellent Gregorian telescope of 30 pouces focal length, the large mirror having 6 pouces in diameter, and magnifying 104 times these objects: the middle of that nebula appeared rather bright with this instrument, without any appearance of stars; the light went diminishing up to extinguishing; it resembles two cones or pyramids of light, opposed at their bases, of which the axis was in the direction form North-West to South-East; the two points of light or the two summits are about 40 minutes of arc apart; I say about, because of the difficulty to recognize these two extremities. The common base of the two pyramids is 15 minutes: these measures have been made with a Newtonian telescope of 4 feet and a half focal length, equipped with a micrometer of silk wires. With the same instrument I have compared the middle of the summits of the two cones of light with the star Gamma Andromedae of fourth magnitude which is very near to it, and little distant from its parallel. From these observations, I have concluded the right ascension of the middle of this nebula as 7d 26′ 32″, and its declination as 39d 9′ 32″ north. Since fifteen years during which I viewed and observed this nebula, I have not noticed any change in its appearances; having always perceived it in the same shape.”
A great many astronomers would observe the Andromeda Galaxy over the years, each colorfully describing it. However, as we know from history, it would be quite some time before its true nature as an external galaxy would be discovered. Here is where we must give the utmost respect to Sir William Herschel, who knew way ahead of everyone else, that there was something very, very different about Messier’s Object 31!
Composite Infrared/visble light image of the Andromeda Galaxy, taken by NASA’s Wide-field Infrared Survey Explorer (WISE). Credit: NASA/JPL-Caltech/WISE Team
Although he never publicly published his observing notes on another astronomer’s discoveries, it’s a shame he did not for this is what he had to say:
“.. But when an object is of such a construction, or at such a distance from us, that the highest power of penetration, which hitherto has been applied to it, leaves it undetermined whether it belongs to the class of nebulae or of stars, it may be called ambiguous. As there is, however, a considerable difference in the ambiguity of such objects, I have arranged 71 of them into the following four collections. The first contains seven objects that may be supposed to consist of stars, but where the observations hitherto made, of either their appearance or form, leave it undecided into which class they should be placed. Connoiss. 31 [M31] is: A large nucleus with very extensive nebulous branches, but the nucleus is very gradually joined to them. The stars which are scattered over it appear to be behind it, and seem to lose part of their lustre in the passage of their light through the nebulosity; there are not more of them scattered over the immediate neighborhood. I examined it in the meridian with a mirror of 24 inches in diameter, and saw it in high perfection; but its nature remains mysterious. Its light, instead of appearing resolvable with this aperture, seemed to be more milky. The objects in this collection must at present remain ambiguous.”
Locating Messier 31:
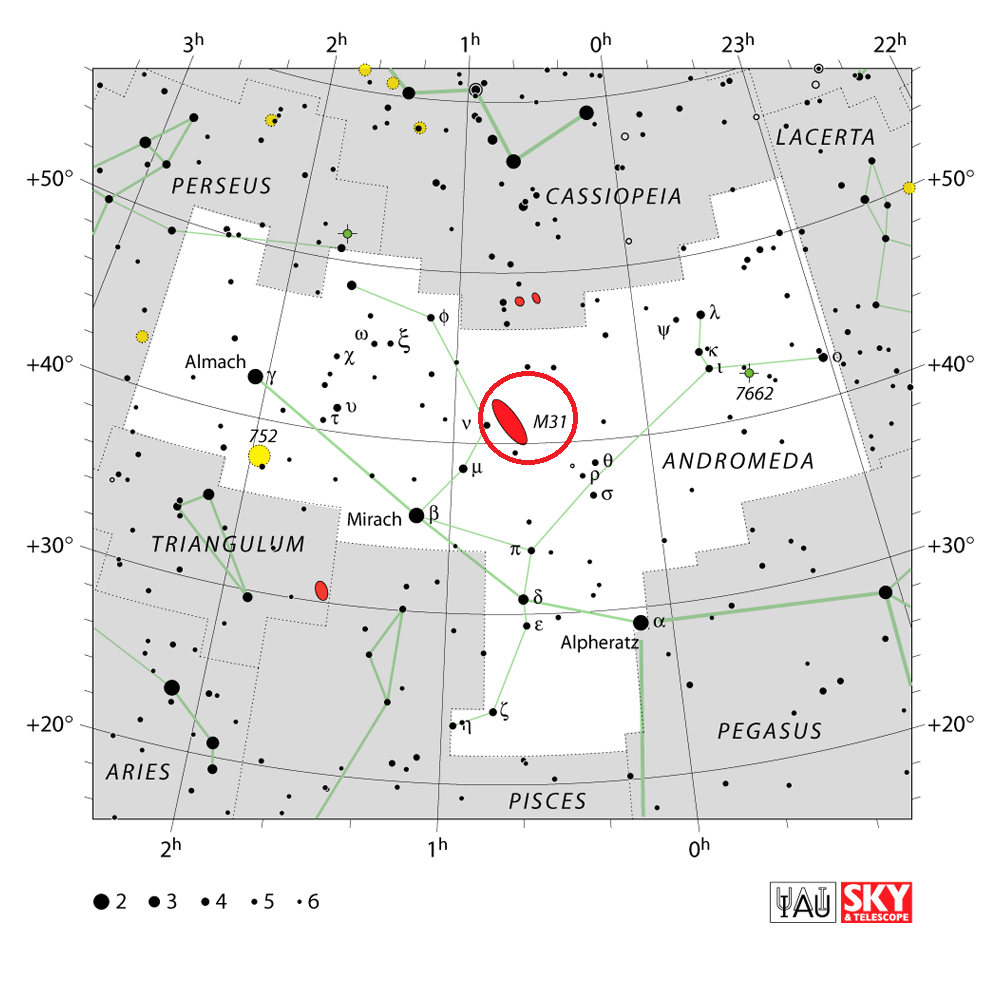
Even under moderately light polluted skies the Great Andromeda Galaxy, located in the Andromeda constellation, can be easily be found with the unaided eye – if you know where to look. Seasoned amateur astronomers can literally point to the sky and show you the location of M31, but perhaps you have never tried to find it. Believe it or not, this is an easy galaxy to spot even under the moonlight.
Simply identify the large diamond-shaped pattern of stars that is the Great Square of Pegasus. The northernmost star is Alpha, and it is here we will begin our hop. Stay with the northern chain of stars and look four finger widths away from Alpha for an easily seen star. The next along the chain is about three more finger widths away. Two more finger widths to the north and you will see a dimmer star that looks like it has something smudgy nearby.
The location of Messier 31, in the Andromeda constellation (from which it takes its name). Credit: IAU/Sky & Telescope magazine (Roger Sinnott & Rick Fienberg)
Point your binoculars there, because that’s no cloud – it’s the Andromeda Galaxy! Now aim your binoculars or small telescope its way… Perhaps one of the most outstanding of all galaxies to the novice observer, M31 spans so much sky that it takes up several fields of view in a larger telescope, and even contains its own clusters and nebulae with New General Catalog designations.
If you have a slightly larger telescope, you may also be able to pick up M31’s two companions – M32 and M110. Even with no scope or binoculars, it’s pretty amazing that we can see something – anything! – that is over two million light-years away!
Enjoy this wonderful and mysterious galaxy at any and every opportunity! Even the most modest of optical aids will reveal it for what it is… Another island universe!
And here are ye’ ole’ quick facts. Enjoy!
Object Name: Messier 31 Alternative Designations: M31, NGC 224, Andromeda Galaxy Object Type: Type Sb Galaxy Constellation: Andromeda Right Ascension: 00 : 42.7 (h:m) Declination: +41 : 16 (deg:m) Distance: 2900 (kly) Visual Brightness: 3.4 (mag) Apparent Dimension: 178×63 (arc min)
Artist’s impression of the VFTS 352 star system, the hottest and most massive double star system to date where the two components are in contact and sharing material. Credit: ESO/L. Calçada
Stellar collisions are an amazingly rare thing. According to our best estimates, such events only occur in our galaxy (within globular clusters) once every 10,000 years. It’s only been recently, thanks to ongoing improvements in instrumentation and technology, that astronomers have been able to observe such mergers taking place. As of yet, no one has ever witnessed this phenomena in action – but that may be about to change!
According to study from a team of researchers from Calvin College in Grand Rapids, Michigan, a binary star system that will likely merge and explode in 2022. This is an historic find, since it will allow astronomers to witness a stellar merger and explosion for the first time in history. What’s more, they claim, this explosion will be visible with the naked-eye to observers here on Earth.
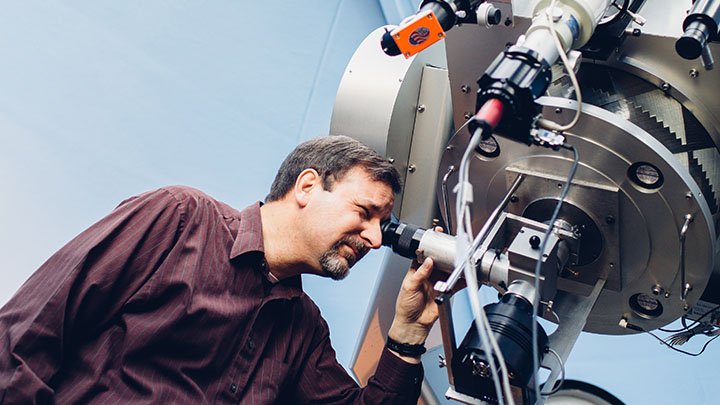
Professor Lawrence Molnar of the Calvin College’s Dept. of Physics and Astronomy. He predicts KIC 9832227 will collide and explode in 2022. Credit: calvin.edu
This binary star system, which is known as KIC 9832227, is one that Prof. Molnar and his colleagues – which includes students from the Apache Point Observatory and the University of Wyoming – have been monitoring since 2013. His interest in the star was piqued during a conference in 2013 when Karen Kinemuchi (an astronomers with the Apache Point Observatory) presented findings about brightness changes in the star.
This led to questions about the nature of this star system – specifically, whether it was a pulsar or a binary pair. After conducting their own observations using the Calvin observatory, Prof. Molnar and his colleagues concluded that the star was a contact binary – a class of binary star where the two stars are close enough to share an atmosphere. This brought to mind similar research in the past about another binary star system known as V1309 Scorpii.
This binary pair also had a shared atmosphere; and over time, their orbital period kept decreasing until (in 2008) they unexpectedly collided and exploded. Believing that KIC 9832227 would undergo a similar fate, they began conducting tests to see if the star system was exhibiting the same behavior. The first step was to make spectroscopic observations to see if their observations could be explained by the presence of a companion star.
As Cara Alexander, a Calvin College student and one of the co-authors on the team’s research paper, explained in a college press release:
“We had to rule out the possibility of a third star. That would have been a pedestrian, boring explanation. I was processing data from two telescopes and obtained images that showed a signature of our star and no sign of a third star. Then we knew we were looking at the right thing. It took most of the summer to analyze the data, but it was so exciting. To be a part of this research, I don’t know any other place where I would get an opportunity like that; Calvin is an amazing place.”
Diagram showing the summer constellations of Cygnus and Lyra and the position of KIC 9832227 (shown with a red circle). Credit: calvin.edu
The next step was to measure the pair’s orbital period, to see it was in fact getting shorter over time – which would indicate that the stars were moving closer to each other. By 2015, Prof. Molnar and his team determined that the stars would eventually collide, resulting in a kind of stellar explosion known as a “Red Nova”. Initially, they estimated this would take place between 2018 and 2020, but have since placed the date at 2022.
In addition, they predict that the burst of light it will cause will be bright enough to be seen from Earth. The star will be visible as part of the constellation Cygnus, and it appear as an addition star in the familiar Northern Cross star pattern (see above). This is an historic case, since no astronomer has ever been able to accurately predict when and where a stellar collision would take place in the past.
What’s more, this discovery is immensely significant because it represents a break with the traditional discovery process. Not only have small research institutions and universities not been the ones to take the lead on these sorts of discoveries in the past, but student-and-teacher teams have also not been the ones who got to make them. As Molnar explained it:
“Most big scientific projects are done in enormous groups with thousands of people and billions of dollars. This project is just the opposite. It’s been done using a small telescope, with one professor and a few students looking for something that is not likely. Nobody has ever predicted a nova explosion before. Why pay someone to do something that almost certainly won’t succeed? It’s a high-risk proposal. But at Calvin it’s only my risk, and I can use my work on interesting, open-ended questions to bring extra excitement into my classroom. Some projects still have an advantage when you don’t have as much time or money.”
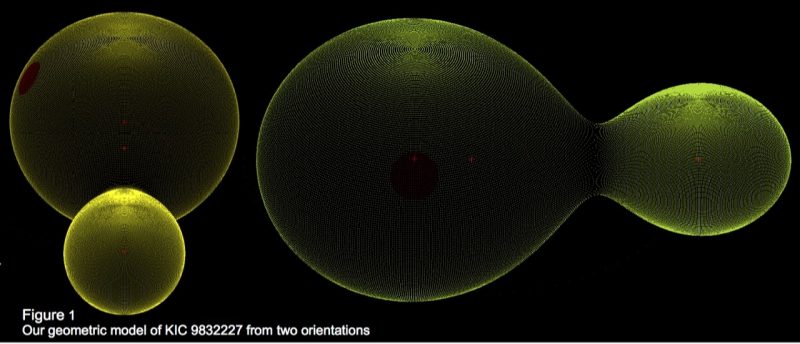
The model Prof. Molnar and his team constructed of the double star system KIC 9832227, which is a contact binary (i.e. two stars that are touching). Credit: calvin.edu.
Over the course of the next year, Molnar and his colleagues will be monitoring KIC 9832227 carefully, and in multiple wavelengths. This will be done with the help of the NROA’s Very Large Array (VLA), NASA’s Infrared Telescope Facility at Mauna Kea, and the ESA’s XMM-Newton spacecraft. These observatories will study the star’s radio, infrared and X-ray emissions, respectively.
Molnar also expects that amateur astronomers will be able to monitor the pair’s orbital timing and variations in brightness. And if he and his team’s predictions are correct, every student and stargazer in the northern hemisphere – not to mention people who just happen to be out for a walk – will be privy to the amazing light show. This is sure to be a once-in-a-lifetime event, so stay tuned for more information!
Interestingly enough, this historic discovery is also the subject of a documentary film. Titled “Luminous“, the documentary – which is directed by Sam Smartt, a Calvin professor of communication arts and sciences – chronicles the process that led Prof. Molnar and his team to make this unprecedented discovery. The documentary will also include footage of the Red Nova as it happens in 2022, and is expected to be released sometime in 2023.
Mission patch for Iridium-1 mission showing launch of the first 10 Iridium NEXT voice and data relay satellites on SpaceX Falcon 9 from Vandenberg Air Force Base, California, for Iridium Communications, and planned landing of the first stage on a droneship in the Pacific Ocean. Credit: SpaceX/Iridium
Mission patch for Iridium-1 mission showing launch of the first 10 Iridium NEXT voice and data relay satellites on SpaceX Falcon 9 from Vandenberg Air Force Base, California, for Iridium Communications, and planned landing of the first stage on a droneship in the Pacific Ocean. Credit: SpaceX/Iridium
Earlier indications of a nearly weeks long launch delay from Monday, Jan. 9 to next Saturday morning, Jan. 14, were officially confirmed today, Jan. 8, by SpaceX and their Iridium Communications customer.
“Launch moving due to high winds and rains at Vandenberg,” SpaceX announced today, Jan. 8.
Liftoff of the SpaceX Falcon 9 with the payload of 10 identical next generation Iridium NEXT communications satellites had been slated for 10:22 am PST (1:22 pm EST), Jan. 9, 2017 from Space Launch Complex 4E on Vandenberg Air Force Base in California.
The advanced next satellites will start the process of replacing an aging Iridium fleet in orbit for nearly two decades.
And it was less than 48 hours ago on Friday, Jan. 6, that the FAA finally granted SpaceX a license to launch the ‘Return to Flight’ Falcon 9 mission – as I confirmed with the FAA here.
“The FAA accepted the investigation report on the AMOS-6 mishap and has closed the investigation,” FAA spokesman Hank Price confirmed to Universe Today.
“SpaceX applied for a license to launch the Iridium NEXT satellites from Vandenberg Air Force Base. The FAA has granted a license for that purpose.”
The SpaceX investigation report into the total loss of the Falcon 9 rocket and AMOS-6 payload has not been released at this time. The FAA has oversight responsibility to encourage, facilitate, and promote U.S. commercial space transportation and ensure the protection of public safety.
The private rocket – developed by CEO Elon Musk and his company – has been grounded for four months since a catastrophic launch pad explosion last September suddenly destroyed another Falcon 9 and its $200 million Israeli owned satellite during a prelaunch fueling test on the Florida Space Coast.
The Sept. 1, 2016 calamity was the second Falcon 9 failure within 15 months time. Both occurred inside the second stage and called into question the rockets reliability.
The prognosis of a week of bad California weather had been known for some time and finally prompted an official announcement just 24 hours before the hoped for launch.
“With high winds and rain in the forecast at Vandenberg Air Force Base, the first launch of 10 Iridium NEXT satellites is now planned for January 14th at 9:54:34 am PST with a back-up date of January 15th,” Iridium officials elaborated in a statement.
The mission, known as Iridium 1, has an instantaneous launch opportunity at 9:54:34 a.m. PST (12:54:34 p.m. EST).
Next Sunday, Jan. 15 is available as a back-up launch opportunity in case of a delay for any reason including technical and weather related issues.
Furthermore, humorous pleas by Iridium CEO Matt Desch for divine intervention went unheeded !
“Can now confirm: new launch date Jan 14 at 9:54am pst. Bad weather the cause. Anti-rain dances didn’t work – oh well. Cal needs rain?” said Iridium CEO Matt Desch when he threw in the towel this morning by tweet.
Things change fast and furious in the rocket business, and flexibility is the name of the game if you want to survive the frequently changing landscape.
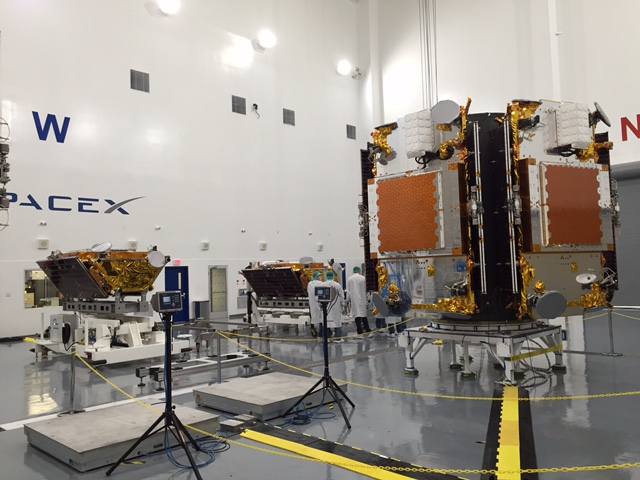
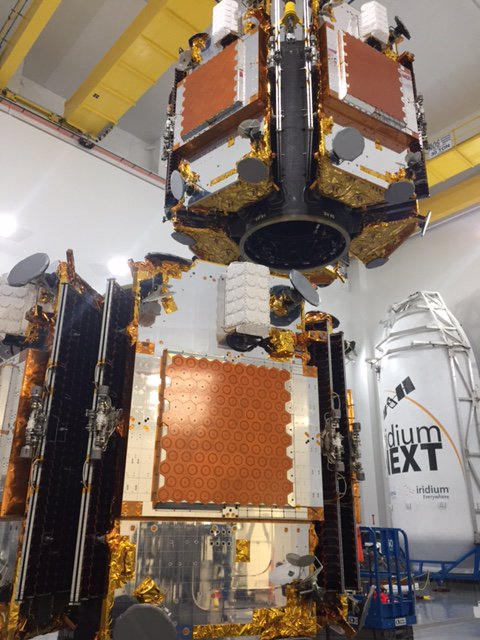
IridiumNEXT satellites being fueled, pressurized & stacked on dispenser tiers at Vandenberg AFB for Falcon 9 launch. Credit: Iridium
A contributing factor to the delay is a range conflict with an upcoming Atlas rocket launch for the U.S National Reconnaissance Organization (NRO) at Vandenberg AFB.
“Other range conflicts this week results in next available launch date being Jan 14,” SpaceX confirmed.
The United Launch Alliance Atlas V is scheduled to launch the super secret NROL-79 spy satellite for the NRO on Jan. 26.
Prior to the launch, ULA must conduct a wet dress rehearsal (WDR) of the Atlas V by fueling it with propellants to confirm its readiness to launch.
The clandestine NROL-79 intelligence-gathering payload is critical to US national defense. Surly it was manufactured over a time span of several years at an unknown classified cost probably amounting to billions of dollars.
For the Iridium – 1 mission the 229-foot (70-meter) Falcon 9 will carry a fleet of ten Iridium NEXT mobile voice and data relay satellites to orbit from Vandenberg Air Force Base, Ca, for Iridium Communications.
Video Caption: Iridium NEXT: Changing the Paradigm In Space Communications. Credit: Iridium/SpaceX
Iridium 1 is the first of seven planned Falcon 9 launches to establish the Iridium NEXT constellation which will eventually consist of 81 advanced satellites.
The FAA license approved on Jan. 6 covers all seven launches.
“Space Explorations Technologies is authorized to conduct seven launches of Falcon 9 version 1.2 vehicles from Space Launch Complex 4E at Vandenberg Air Force Base with each flight transporting ten Iridium NEXT payloads to low Earth orbit.
The license also allows SpaceX to land the first stage on a droneship at sea in the Pacific Ocean.
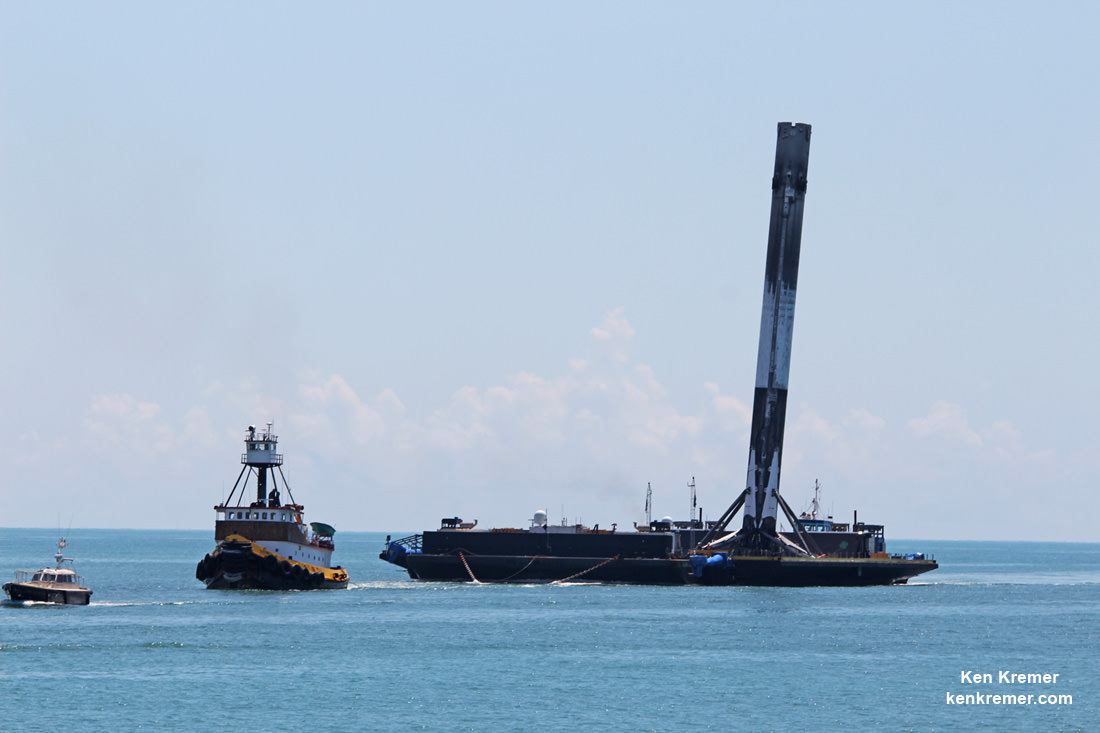
SpaceX Falcon 9 booster from Thaicom-8 launch on May 27, 2016 arrives at mouth of Port Canaveral, FL on June 2, 2016. Credit: Ken Kremer/kenkremer.com
So besides the launch, SpaceX plans to continue its secondary objective of recovering the Falcon 9 first stage via a propulsive soft landing – as done several times previously and witnessed by this author.
The Iridium-1 mission patch featured herein highlights both the launch and landing objectives.
The goal is to eventually recycle and reuse the first stage – and thereby dramatically slash launch costs per Musk’s vision.
This Falcon 9 has been outfitted with four landing lags and grid fins for a controlled landing on a tiny barge prepositioned in the Pacific Ocean several hundred miles off the west coast of California.
Desch says that all seven of his Falcon’s will be new – not reused.
“All our seven F9s are new,” Desch tweeted.
On Jan. 2, SpaceX issued a statement ascribing the Sept. 1, 2016 AMOS-6 launch pad anomaly as being traced to a failure wherein one of three high pressure helium storage tanks located inside the second stage liquid oxygen (LOX) tank of the Falcon 9 rocket suddenly burst. Cold helium is used to pressurize the propellant tanks. They provided some but not many technical details.
The failure apparently originated at a point where the helium tank “buckles” and accumulates oxygen – “leading to ignition” of the highly flammable superchilled oxygen propellant in the second stage when it came into contact with carbon fibers covering the helium tanks – also known as composite overwrapped pressure vessels (COPVs).
“Friction ignition” between the carbon fibers acting as a friction source and super chilled oxygen led to the calamitous explosion, SpaceX concluded was the most likely cause of the disaster.
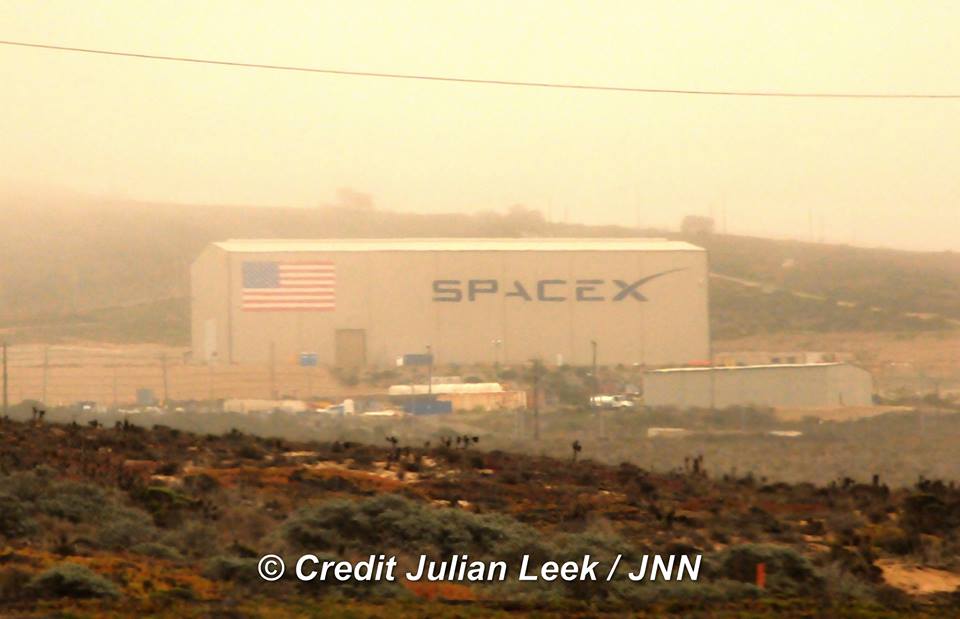
Watch this space for continuing updates as SpaceX rolls the rocket out from the processing hangar and we watch the saga of the foggy weather forecast with great anticipation !
SpaceX rocket processing hangar at Vandenberg Air Force Base in California, fogged by common fog. Credit Julian Leek
Stay tuned here for Ken’s continuing Earth and Planetary science and human spaceflight news.
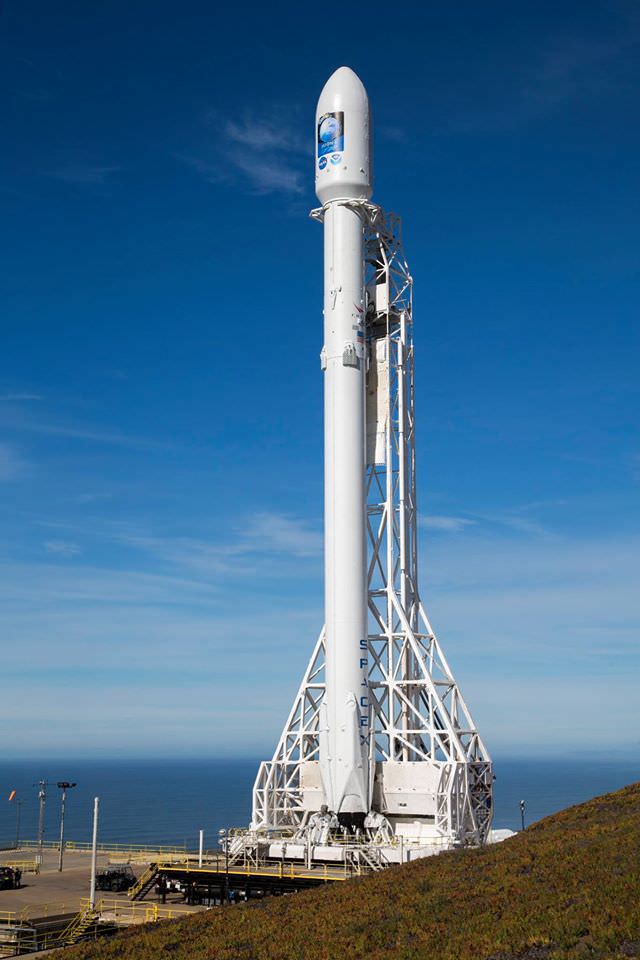
SpaceX Falcon 9 poised for launch from Vandenberg Air Force Base in California, in this file photo ahead of Jason-3 launch for NASA on Jan. 17, 2016. Credit: SpaceX
SpaceX Falcon 9 poised for launch from Vandenberg Air Force Base in California, in this file photo ahead of Jason-3 launch for NASA on Jan. 17, 2016. Credit: SpaceX
“The FAA accepted the investigation report on the AMOS-6 mishap and has closed the investigation,” FAA spokesman Hank Price confirmed to Universe Today.
All SpaceX launches were immediately grounded when their Falcon 9 booster and its $200 million AMOS-6 Israeli communications satellite payload were suddenly destroyed without warning during a routine preflight fueling test on Sept. 1, 2016, at pad 40 on Cape Canaveral Air Force Station in Florida.
SpaceX Falcon 9 rocket moments after catastrophic explosion destroys the rocket and Amos-6 Israeli satellite payload at launch pad 40 at Cape Canaveral Air Force Station, FL, on Sept. 1, 2016. A static hot fire test was planned ahead of scheduled launch on Sept. 3, 2016. Credit: USLaunchReport
With today’s definitive action from the FAA the path is now clear for Hawthorne, Ca based SpaceX to resume launches of the Falcon 9 rocket as soon as Monday, Jan. 9. It will carry a fleet of ten Iridium NEXT mobile voice and data relay satellites to orbit from Vandenberg Air Force Base, Ca, for Iridium Communications.
“SpaceX applied for a license to launch the Iridium NEXT satellites from Vandenberg Air Force Base. The FAA has granted a license for that purpose,” Price added.
The SpaceX investigation report has not been released at this time.
Liftoff of the SpaceX Falcon 9 with the payload of 10 identical next generation IridiumNEXT communications satellites is slated for 10:22 am PST (1:22 pm EST), Jan. 9, 2017 from Space Launch Complex 4E on Vandenberg Air Force Base in California.
Furthermore all technical systems would appear to be ‘GO’ for the commercial rocket and commercial payload, following the official announcement by SpaceX CEO Elon Musk that the Falcon 9 rocket successfully passed its normally routine prelaunch static fire test of the first stage engines, on Thursday, Jan. 5.
“Hold-down firing of @SpaceX Falcon 9 at Vandenberg Air Force completed,” SpaceX CEO Elon Musk tweeted Jan. 5.
“All systems are go for launch next week.”
“Payload/rocket mating underway,” Iridium CEO Matt Desch elaborated and confirmed via twitter today.
The static fire test involves briefly firing the first stage Merlin 1D engines for several seconds while the rocket remains anchored to the launch pad. The test is run to confirm that all the engines and rocket systems are technically ready for launch.
In contrast to AMOS-6, the Iridium NEXT payload was not installed atop the rocket this time during Thursday’s test to keep them safely and prudently stored out of harms way – just in case another unexpected mishap were to occur.
Members of the Iridium Communications team were on hand to observe Thursday’s static fire test first hand.
“With great anticipation, team members observed the static fire test of the Falcon 9 rocket that will deliver the first ten Iridium NEXT satellites to orbit. Iridium is excited to share that the test is complete, and that SpaceX is reporting that the rocket should be ready for the first launch of the Iridium NEXT satellite constellation next week,” said Iridium officials.
“The target launch date is now Monday, January 9th at 10:22 am PST, weather permitting.”
And since the launch window is instantaneous, there is no margin for error or delay from either a technical or weather standpoint.
Currently, next weeks weather outlook is not promising with a forecast of rain and clouds on Monday morning and beyond. But only time will tell.
“With completion of the static fire test, our first launch has just gotten that much closer,” said Matt Desch, chief executive officer at Iridium, in a statement.
“The Iridium team has been anxiously awaiting launch day, and we’re now all the more excited to send those first ten Iridium NEXT satellites into orbit.”
“Looks like we’re good to go for Monday!” Desch tweeted today.
“Payload/rocket mating underway; we’ll just have to see about the weather. Anti-rain dances, anyone?”
IridiumNEXT satellites being fueled, pressurized & stacked on dispenser tiers at Vandenberg AFB for Falcon 9 launch. Credit: Iridium
Also known as Iridium 1, this is the first of seven planned Falcon 9 launches to establish the Iridium NEXT constellation – eventually consisting of 81 advanced satellites.
IridiumNEXT satellites being fueled, pressurized & stacked on dispenser tiers at Vandenberg AFB for Falcon 9 launch. Credit: Iridium
Indeed the FAA license approved today covers all seven launches.
“Space Explorations Technologies is authorized to conduct seven launches of Falcon 9 version 1.2 vehicles from Space Launch Complex 4E at Vandenberg Air Force Base with each flight transporting ten Iridium NEXT payloads to low Earth orbit.
The license also allows SpaceX to land the first stage on a droneship at sea in the Pacific Ocean.
After the Sept. 1 accident at pad 40, SpaceX initiated a joint investigation to determine the root cause with the FAA, NASA, the US Air Force and industry experts who have been “working methodically through an extensive fault tree to investigate all plausible causes.”
On Jan. 2, SpaceX issued a statement ascribing the Sept. 1 anomaly as being traced to a failure wherein one of three high pressure gaseous helium storage tanks located inside the second stage liquid oxygen (LOX) tank of the Falcon 9 rocket suddenly burst. Helium is used to pressurize the propellant tanks. They provided some but not many technical details.
The failure apparently originated at a point where the helium tank “buckles” and accumulates oxygen – “leading to ignition” of the highly flammable liquid oxygen propellant in the second stage when it came into contact with carbon fibers covering the helium tank.
The helium tanks – also known as composite overwrapped pressure vessels (COPVs) – are used in both stages of the Falcon 9 to store cold helium which is used to maintain tank pressure.
SpaceX says investigators identified “an accumulation of super chilled liquid oxygen LOX or SOX in buckles under the overwrap” as “credible causes for the COPV failure.”
Apparently the super chilled LOX or SOX can pool in the buckles and react with carbon fibers in the overwrap – which act as an ignition source. “Friction ignition” between the carbon fibers and super chilled oxygen led to the calamitous explosion.
The Sept. 1 calamity was the second Falcon 9 failure within 15 months time and both occurred inside the second stage.
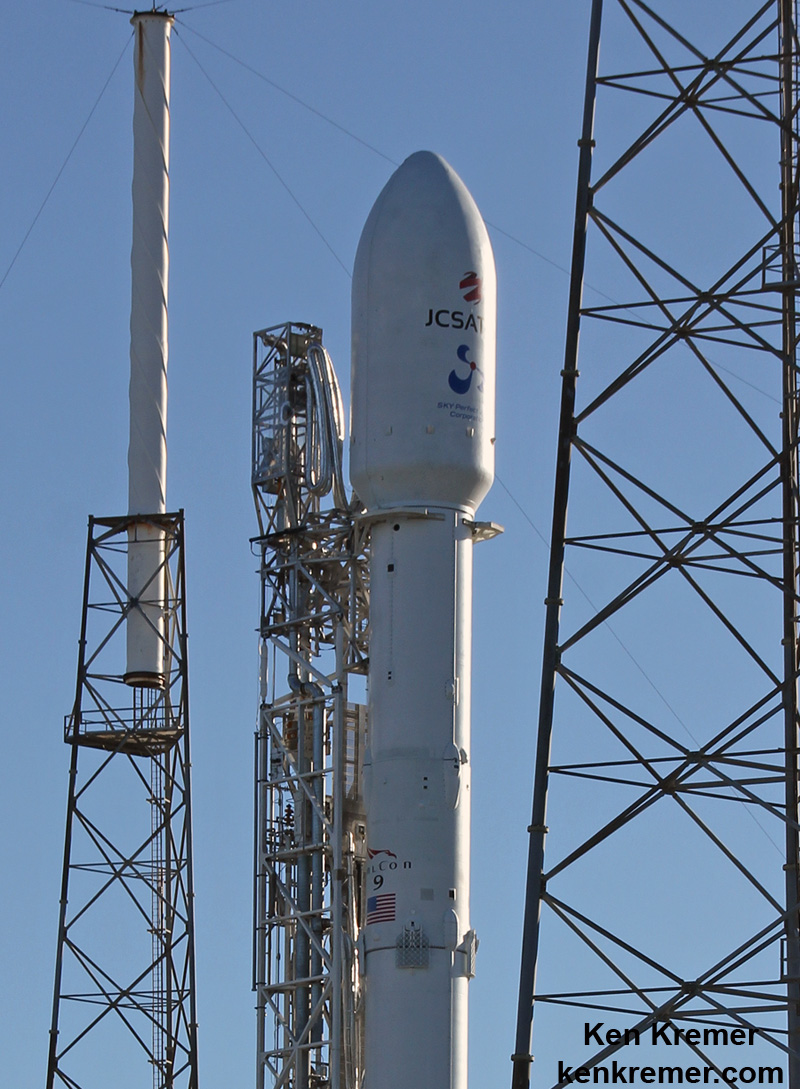
Up close look at a SpaceX Falcon 9 second stage and payload fairing from the JCSAT-16 launch from pad 40 at Cape Canaveral Air Force Station, FL. Both Falcon 9 rocket failures took place inside the second stage. Credit: Ken Kremer/kenkremer.com
If the Iridium liftoff is successful, SpaceX hopes to resume launches on the Florida Space Coast soon thereafter involving both commercial and NASA payloads using pad 39A at the Kennedy Space Center.
SpaceX could launch an EchoStar communications satellite later in January and a cargo resupply mission for NASA to the ISS in February from KSC.
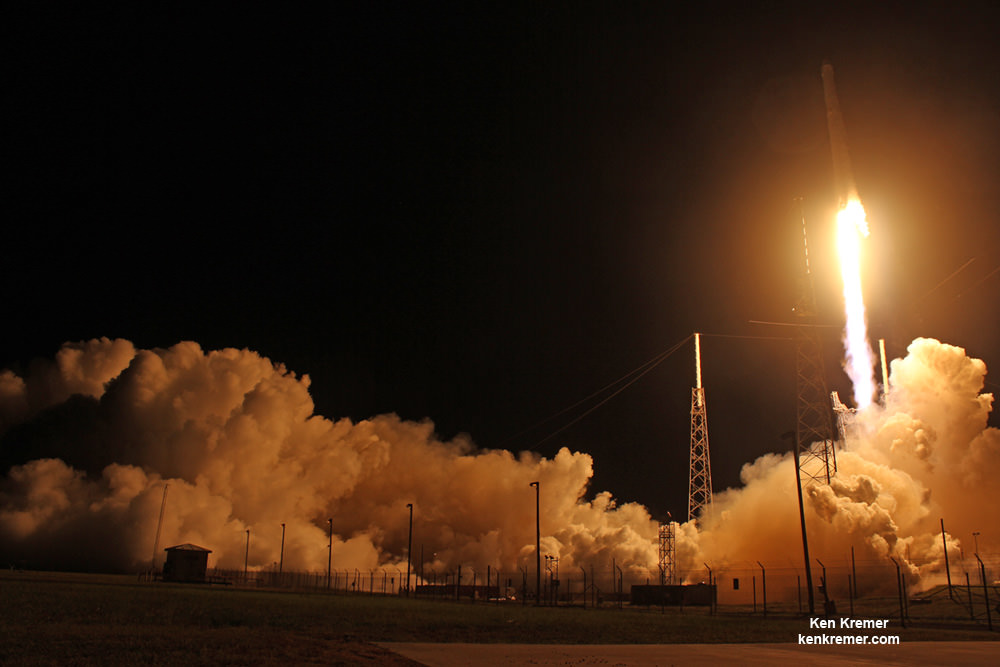
Blastoff of SpaceX Falcon 9 on Dragon CRS-9 resupply mission to the International Space Station (ISS) at 12:45 a.m. EDT on July 18, 2016. Credit: Ken Kremer/kenkremer.com
Watch this space for continuing updates as SpaceX rolls the rocket out from the processing hangar and we watch the foggy weather forecast with great anticipation !
SpaceX rocket processing hangar at Vandenberg Air Force Base in California, fogged by common fog. Credit Julian Leek
Stay tuned here for Ken’s continuing Earth and Planetary science and human spaceflight news.
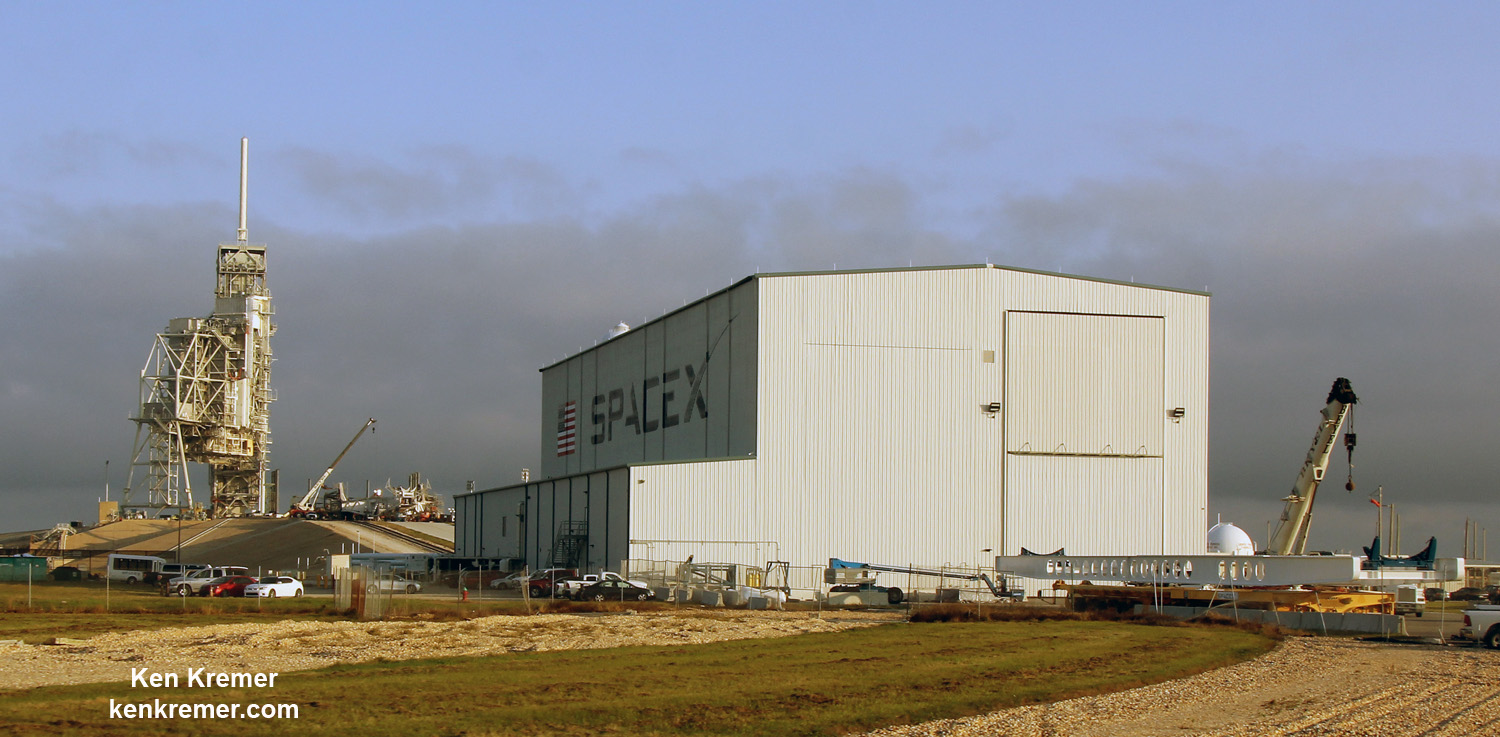
SpaceX is renovating Launch Complex 39A at the Kennedy Space Center for launches of commercial and human rated Falcon 9 rockets as well as the Falcon Heavy, as seen here during Dec 2016 with construction of a dedicated new transporter/erector. Credit: Ken Kremer/kenkremer.com SpaceX Falcon 9 erected at Vandenberg AFB launch pad in California in advance of Jason-3 launch for NASA on Jan. 17, 2016. Credit: SpaceX
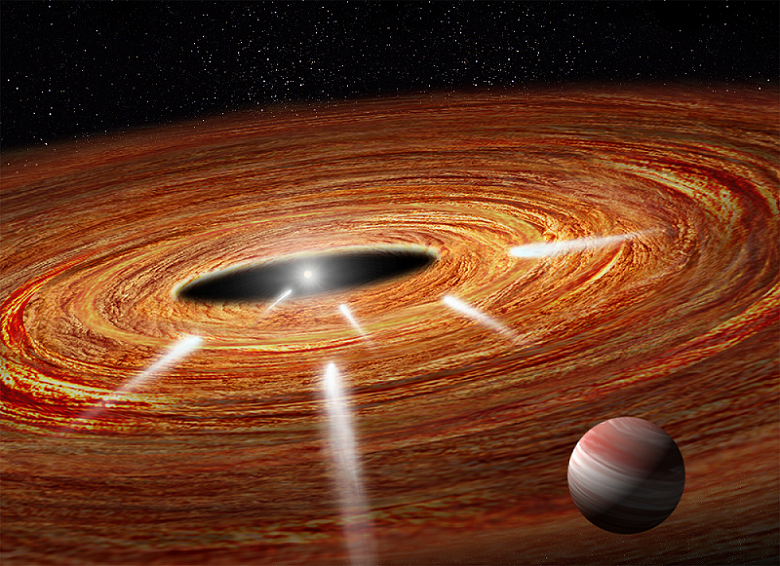
Artist's impression of comets plunging into the star HD 172555, which was observed using the Hubble Space Telescope. Credit: hubblesite.org
The Hubble Space Telescope is a workhorse which, despite its advanced years, keeps on producing valuable scientific data. In addition to determining the rate at which the Universe is expanding, spotting very distant galaxies, and probing the early history of the Universe, it has also observed some truly interesting things happening in nearby star systems.
For example, Hubble recently spotted some unusual activity in HD 172555, a star system located about 95 light-years from Earth. Here, Hubble obtained spectral information that indicated the presence of comets that appeared to be falling into the star. This could prove useful to scientists who are looking to understand how comets behaved during the early history of the Solar System.
These findings were presented at the 229th Meeting of the American Astronomical Society (AAS), which has been taking place this past week in Grapevine, Texas. During the course of the presentation, Dr. Carol Grady of Eureka Scientific Inc. and NASA’s Goddard Space Flight Center, shared Hubble data that hinted at the presence of infalling comets, a finding which could bolster theories about what is known as “gravitational stirring”.
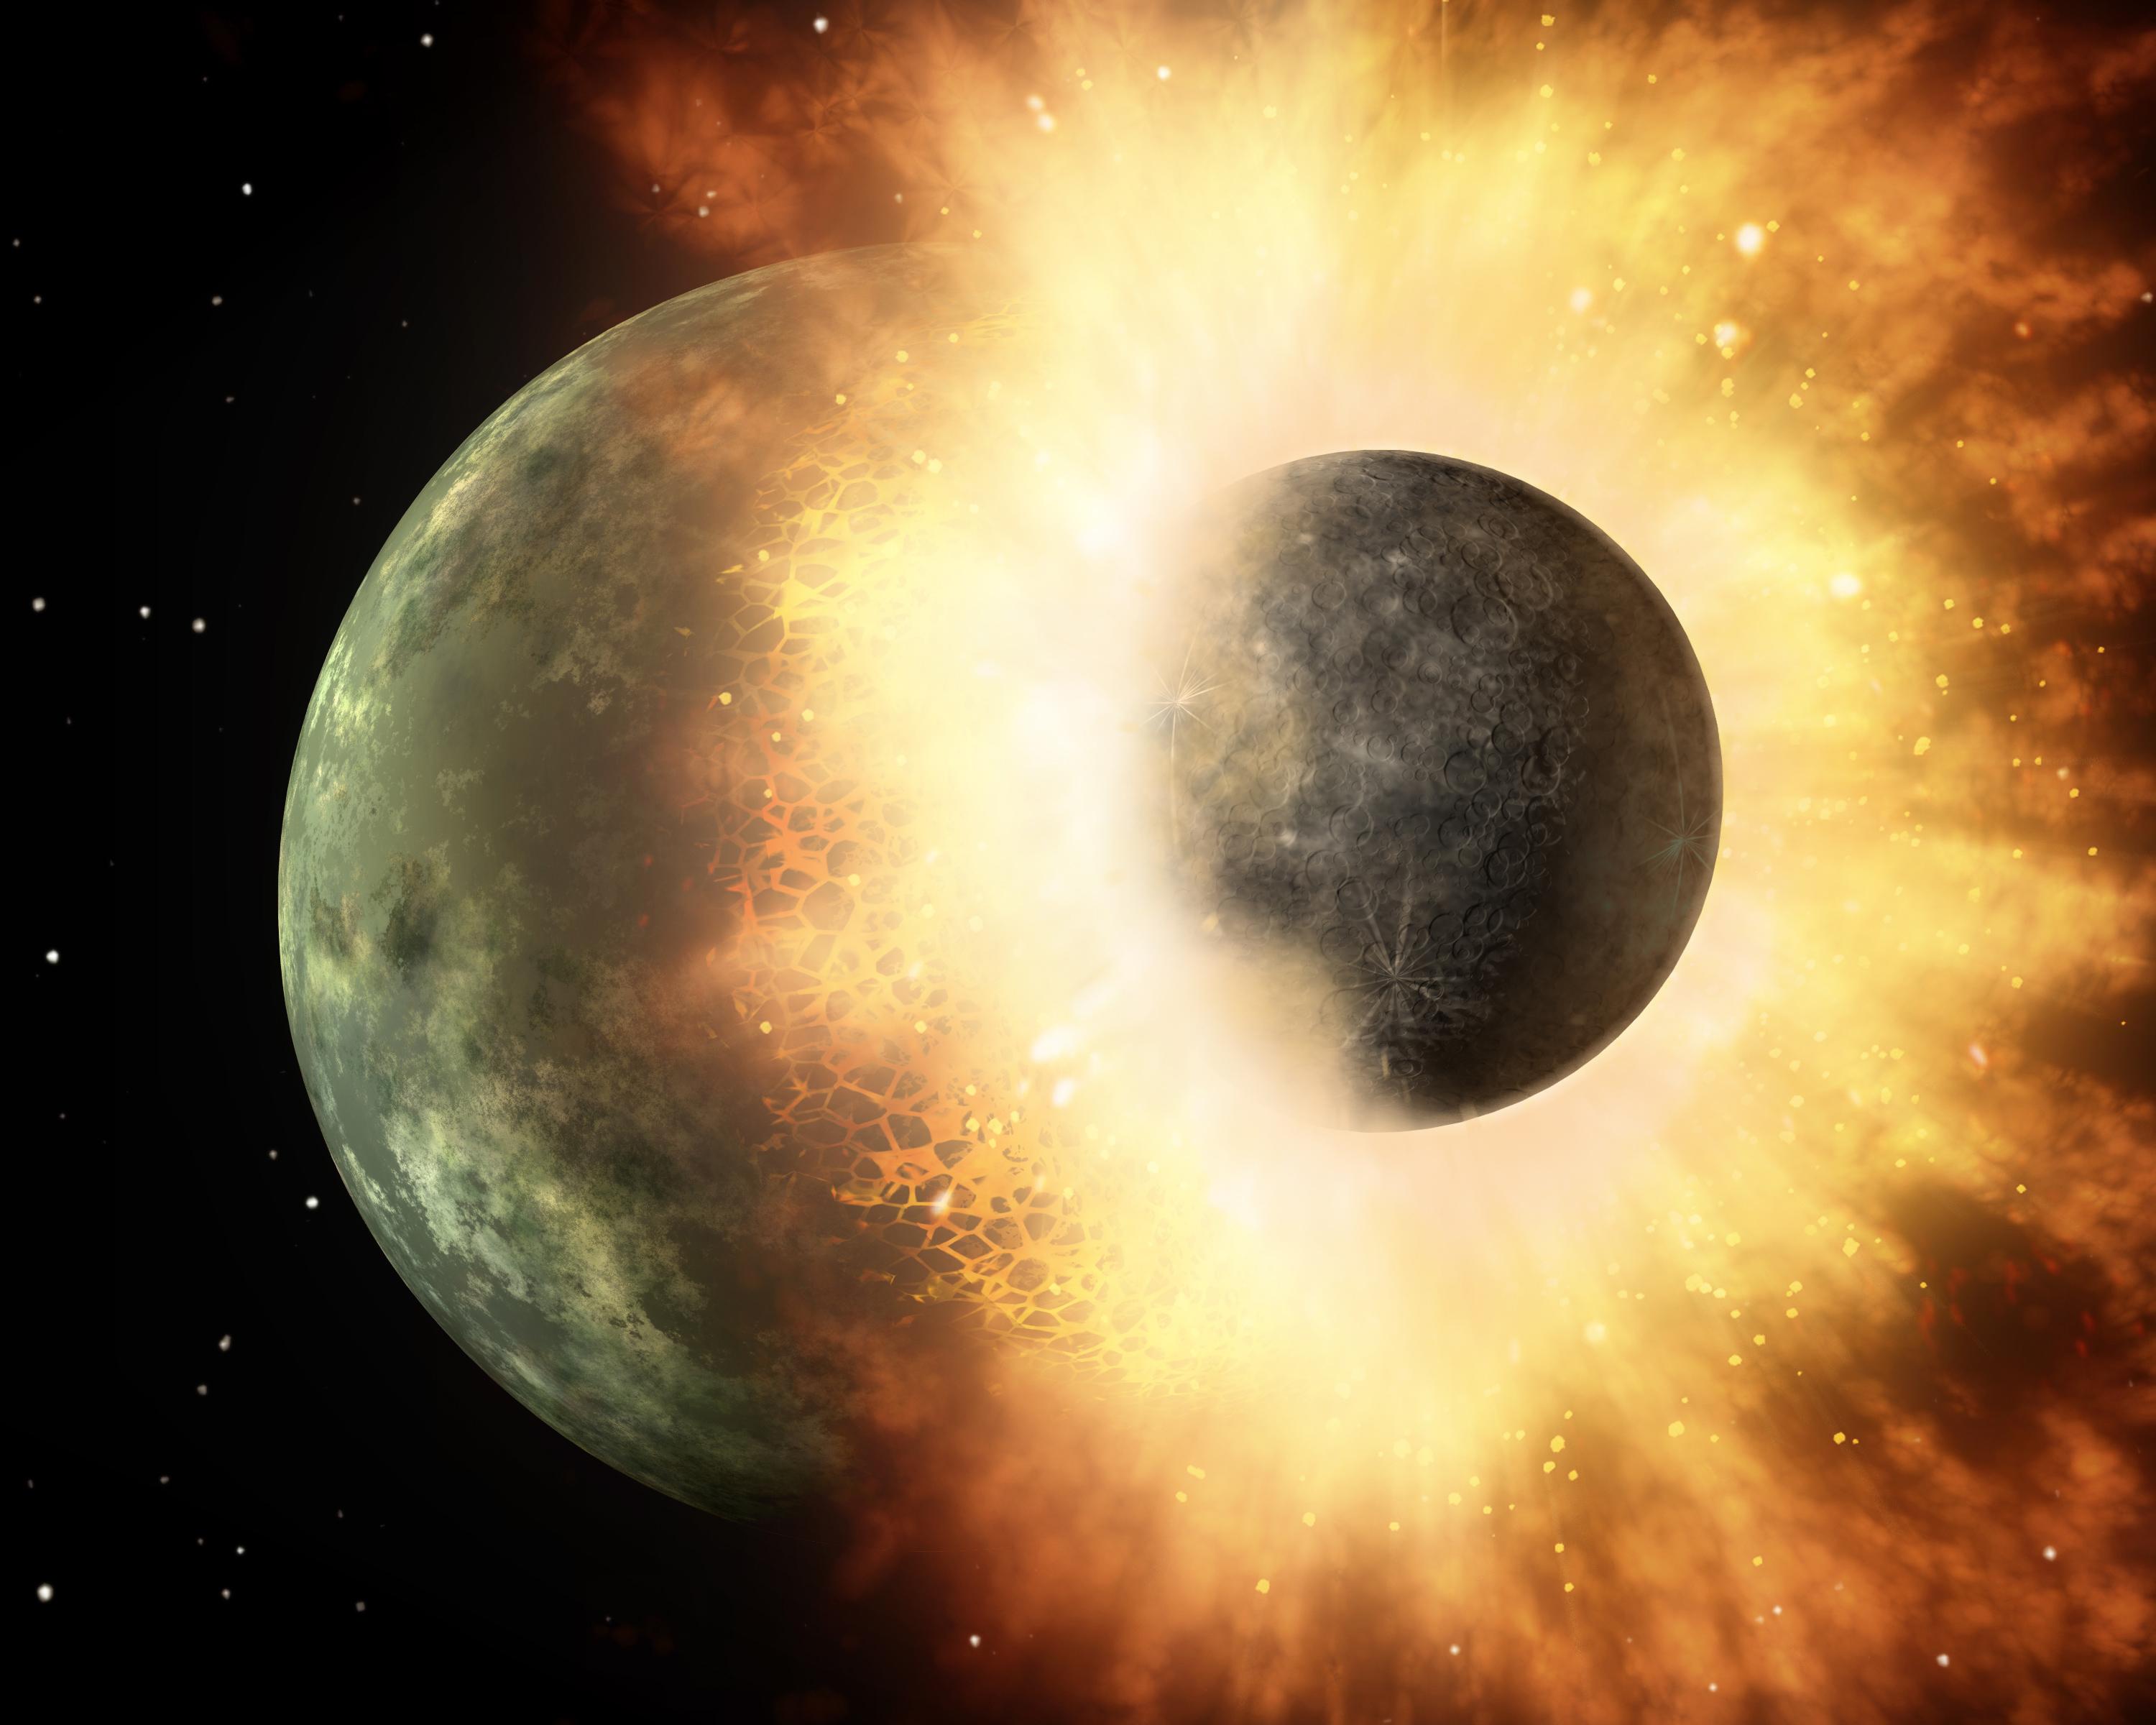
Artist’s concept of a collision that is believed to have taken place in the HD 172555 star system between a moon-sized object and a Mercury-sized planet. Credit: NASA/JPL-Caltech
Basically, this theory states that the presence of a Jupiter-size planet in a star system will lead to comets being deflected by its massive gravity, thus sending them into the star. This phenomena is associated with younger stars, and is believed to have taken place in our own Solar System billions of years ago – which also led to number of comets being diverted towards Earth.
The detection of infalling comets in this system (and the way it bolsters the theory of gravitational stirring) is of imminence significant, since it is believed that it was this very mechanism that transported water to Earth when it was quite young. By observing how comets behave around young stars like HD 172555, which is estimated to be around 40 million years old, astronomers are able to see just how this mechanism could work.
“Seeing these sun-grazing comets in our solar system and in three extrasolar systems means that this activity may be common in young star systems. This activity at its peak represents a star’s active teenage years. Watching these events gives us insight into what probably went on in the early days of our solar system, when comets were pelting the inner solar system bodies, including Earth. In fact, these star-grazing comets may make life possible, because they carry water and other life-forming elements, such as carbon, to terrestrial planets.”
And while exocomets are far too small to be observed directly, the research team – which included members from the European Space Agency, the Kapteyn Institute, NASA Goddard Space Flight Center, and the University of Colorado – were able to discern their presence in 2015 using data obtained by Hubble’s Space Telescope Imaging Spectrograph (STIS) and the Cosmic Origins Spectrograph (COS).
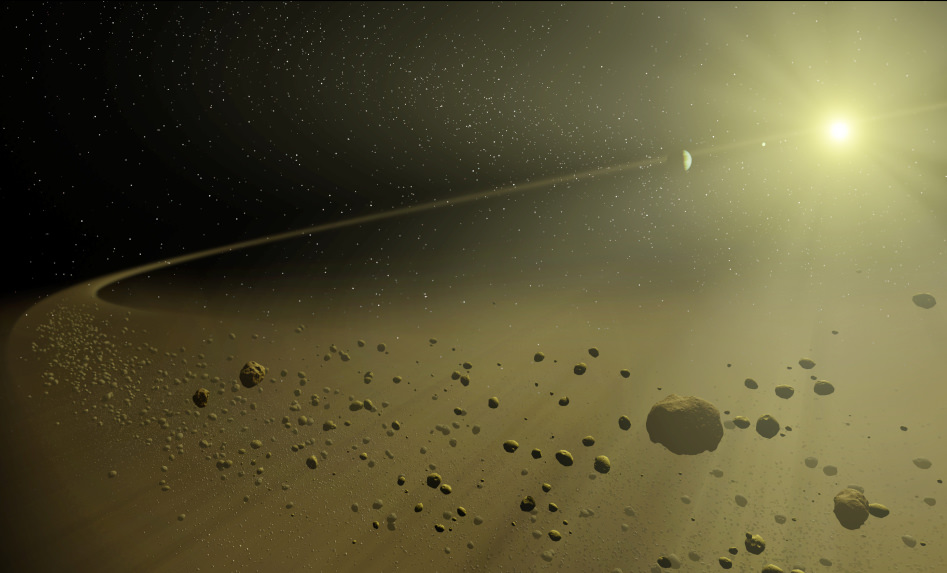
Artist’s concept of circumstellar disk of debris, which the HD 172555 star system is known to have. Credit: NASA
Over the course of six days of observation, Hubble’s instruments detected silicon and carbon gas in the ultraviolet wavelength. The source of these gases also appeared to be moving at a speed of over 579,360 km (360,000 mph) across the face of the star. The only viable explanation for this was that they were spotting trails of gas as they evaporated from comets as they made their way across the system’s debris disk and closer to the star.
This is not the first time that exocomets have been seen transiting HD 172555. In 2004 and 2011, similar detections were made by the European Southern Observatory’s High Accuracy Radial velocity Planet Searcher (HARPS) spectrograph. On those occasions, HARPS detected spectra that indicated the presence of calcium, which was seen as evidence that comet-like objects were falling into the star.
Dr. Grady and her team followed up on this by conducting their own spectral analysis of the system. By viewing HD 172555 and its debris disk in ultraviolet light, they were able to discern the presence of silicon and carbon. This was made easier thanks to the fact that HD 172555’s debris disk is viewed close to edge-on, which gives the telescope a clear view of any comet activity taking place within it.
Dr. Grady admits that there are still some uncertainties with their study. For instance, it is not entirely clear whether the objects they observed were comets or asteroids. Though the behavior is consistent with comets, more data on their particular compositions will be needed before they can be sure.
But in the meantime, it is compelling evidence for how comets behaved during the early history of the Solar System. And it may lend weight to the debate about how water originated on Earth, which is also central to determining how and where life may emerge in other parts of the Universe.
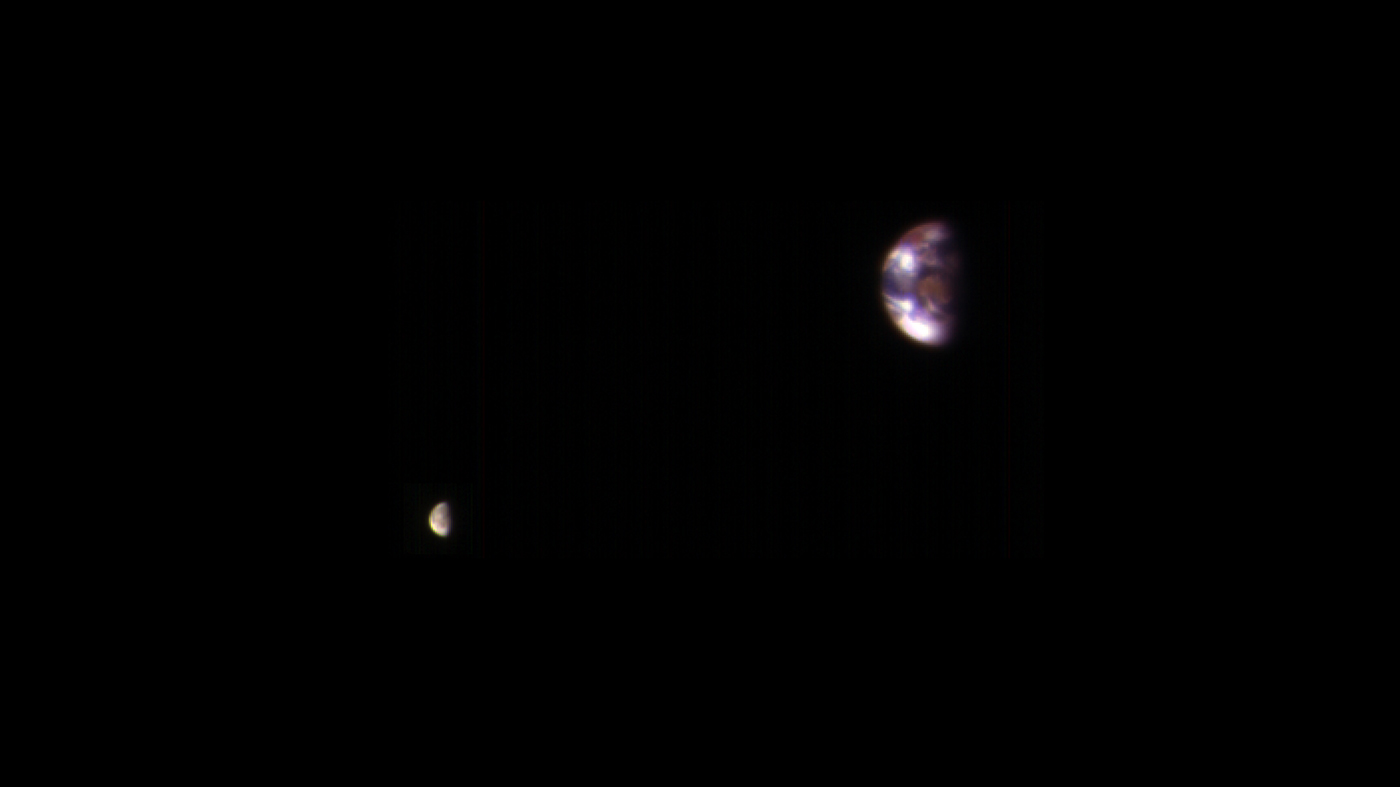
A view of Earth and its Moon, as seen from Mars. It combines two images acquired on Nov. 20, 2016, by the HiRISE camera on NASA's Mars Reconnaissance Orbiter, with brightness adjusted separately for Earth and the moon to show details on both bodies. Credit: NASA/JPL-Caltech/Univ. of Arizona.
The incredible HiRISE camera on board the Mars Reconnaissance Orbiter turned its eyes away from its usual target – Mars’ surface – and for calibration purposes only, took some amazing images of Earth and our Moon. Combined to create one image, this is a marvelous view of our home from about 127 million miles (205 million kilometers) away.
Alfred McEwen, principal investigator for HiRISE said the image is constructed from the best photo of Earth and the best photo of the Moon from four sets of images. Interestingly, this combined view retains the correct positions and sizes of the two bodies relative to each other. However, Earth and the Moon appear closer than they actually are in this image because the observation was planned for a time at which the Moon was almost directly behind Earth, from Mars’ point of view, to see the Earth-facing side of the Moon.
A view of Earth and its Moon, as seen from Mars. It combines two images acquired on Nov. 20, 2016, by the HiRISE camera on NASA’s Mars Reconnaissance Orbiter, with brightness adjusted separately for Earth and the moon to show details on both bodies. Credit: NASA/JPL-Caltech/Univ. of Arizona.
“Each is separately processed prior to combining (in correct relative positions and sizes), so that the Moon is bright enough to see,” McEwen wrote on the HiRISE website. “The Moon is much darker than Earth and would barely show up at all if shown at the same brightness scale as Earth. Because of this brightness difference, the Earth images are saturated in the best Moon images, and the Moon is very faint in the best (unsaturated) Earth image.”
Earth looks reddish because the HiRISE imaging team used color filters similar to the Landsat images where vegetation appears red.
“The image color bandpasses are infrared, red, and blue-green, displayed as red, green, and blue, respectively,” McEwen explained. “The reddish blob in the middle of the Earth image is Australia, with southeast Asia forming the reddish area (vegetation) near the top; Antarctica is the bright blob at bottom-left. Other bright areas are clouds. We see the western near-side of the Moon.”
HiRISE took these pictures on Nov. 20, 2016, and this is not the first time HiRISE has turned its eyes towards Earth.
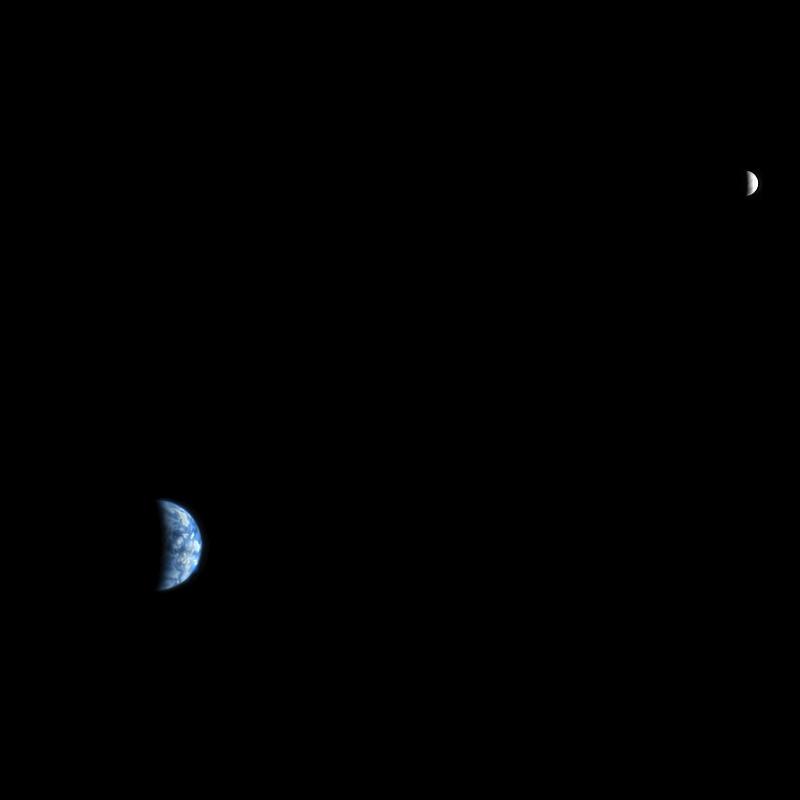
Back in 2007, HiRISE took this image, below, from Mars’ orbit when it was just 88 million miles (142 million km) from Earth. This one is more like how future astronauts might see Earth and the Moon through a telescope from Mars’ orbit.
An image of Earth and the Moon, acquired on October 3, 2007, by the HiRISE camera on NASA’s Mars Reconnaissance Orbiter. Credit: NASA/JPL-Caltech/University of Arizona.
If you look closely, you can make out a few features on our planet. The west coast outline of South America is at lower right on Earth, although the clouds are the dominant features. In fact, the clouds were so bright, compared with the Moon, that they almost completely saturated the filters on the HiRISE camera. The people working on HiRISE say this image required a fair amount of processing to make such a nice-looking picture.
You can see an image from a previous Mars’ orbiter, the Mars Global Surveyor, that took a picture of Earth, the Moon and Jupiter — all in one shot — back in 2003 here.
Special Guests:
This week’s guest is Abigail “Astronaut Abby” Harrison. Abigail is the founder of The Mars Generation nonprofit. Currently a sophomore at Wellesley College in Massachusetts majoring in Astrobiology and Russian. Harrison is positioned to enter a PhD program upon graduation and continue her pursuit of becoming a scientist, astronaut and member of the first human crew to land on Mars in the 2030’s. Hundreds of thousands of supporters from around the world follow her journey to becoming an astronaut via the blog Harrison authors at AstronautAbby.org.
The Mars Generation is a 510c3 nonprofit in the United States. The organization is volunteer-driven with a board of directors that includes astronauts, engineers, scientists and professionals from the nonprofit and business communities. With a reach of more than 10 million people in the organization’s first year of operation and more than 650 students from around the world participating in its Student Space Ambassador Leadership Program, over 600 donors, 350 members and several space industry sponsors in place, the organization continues to grow and offer programs to excite and educate students and adults about the importance of human space exploration and STEM education.
We use a tool called Trello to submit and vote on stories we would like to see covered each week, and then Fraser will be selecting the stories from there. Here is the link to the Trello WSH page (http://bit.ly/WSHVote), which you can see without logging in. If you’d like to vote, just create a login and help us decide what to cover!
If you would like to join the Weekly Space Hangout Crew, visit their site here and sign up. They’re a great team who can help you join our online discussions!
If you would like to sign up for the AstronomyCast Solar Eclipse Escape, where you can meet Fraser and Pamela, plus WSH Crew and other fans, visit our site linked above and sign up!
We record the Weekly Space Hangout every Friday at 12:00 pm Pacific / 3:00 pm Eastern. You can watch us live on Universe Today, or the Universe Today YouTube page<
Artist's impression of debris in low Earth orbit. Credit: ESA
Beginning in the 1950s with the Sputnik, Vostok and Mercury programs, human beings began to “slip the surly bonds of Earth”. And for a time, all of our missions were what is known as Low-Earth Orbit (LEO). Over time, with the Apollo missions and deep space missions involving robotic spacecraft (like the Voyager missions), we began to venture beyond, reaching the Moon and other planets of the Solar System.
But by and large, the vast majority of missions to space over the years – be they crewed or uncrewed – have been to Low-Earth Orbit. It is here that the Earth’s vast array of communications, navigation and military satellites reside. And it is here that the International Space Station (ISS) conducts its operations, which is also where the majority of crewed missions today go. So just what is LEO and why are we so intent on sending things there? Continue reading “What is Low Earth Orbit?”