Welcome back to Messier Monday! In our ongoing tribute to the great Tammy Plotner, we take a look at the open star cluster known as Messier 29. Enjoy!
During the 18th century, famed French astronomer Charles Messier noted the presence of several “nebulous objects” in the night sky. Having originally mistaken them for comets, he began compiling a list of them so that others would not make the same mistake he did. In time, this list would come to include 100 of the most fabulous objects in the night sky.
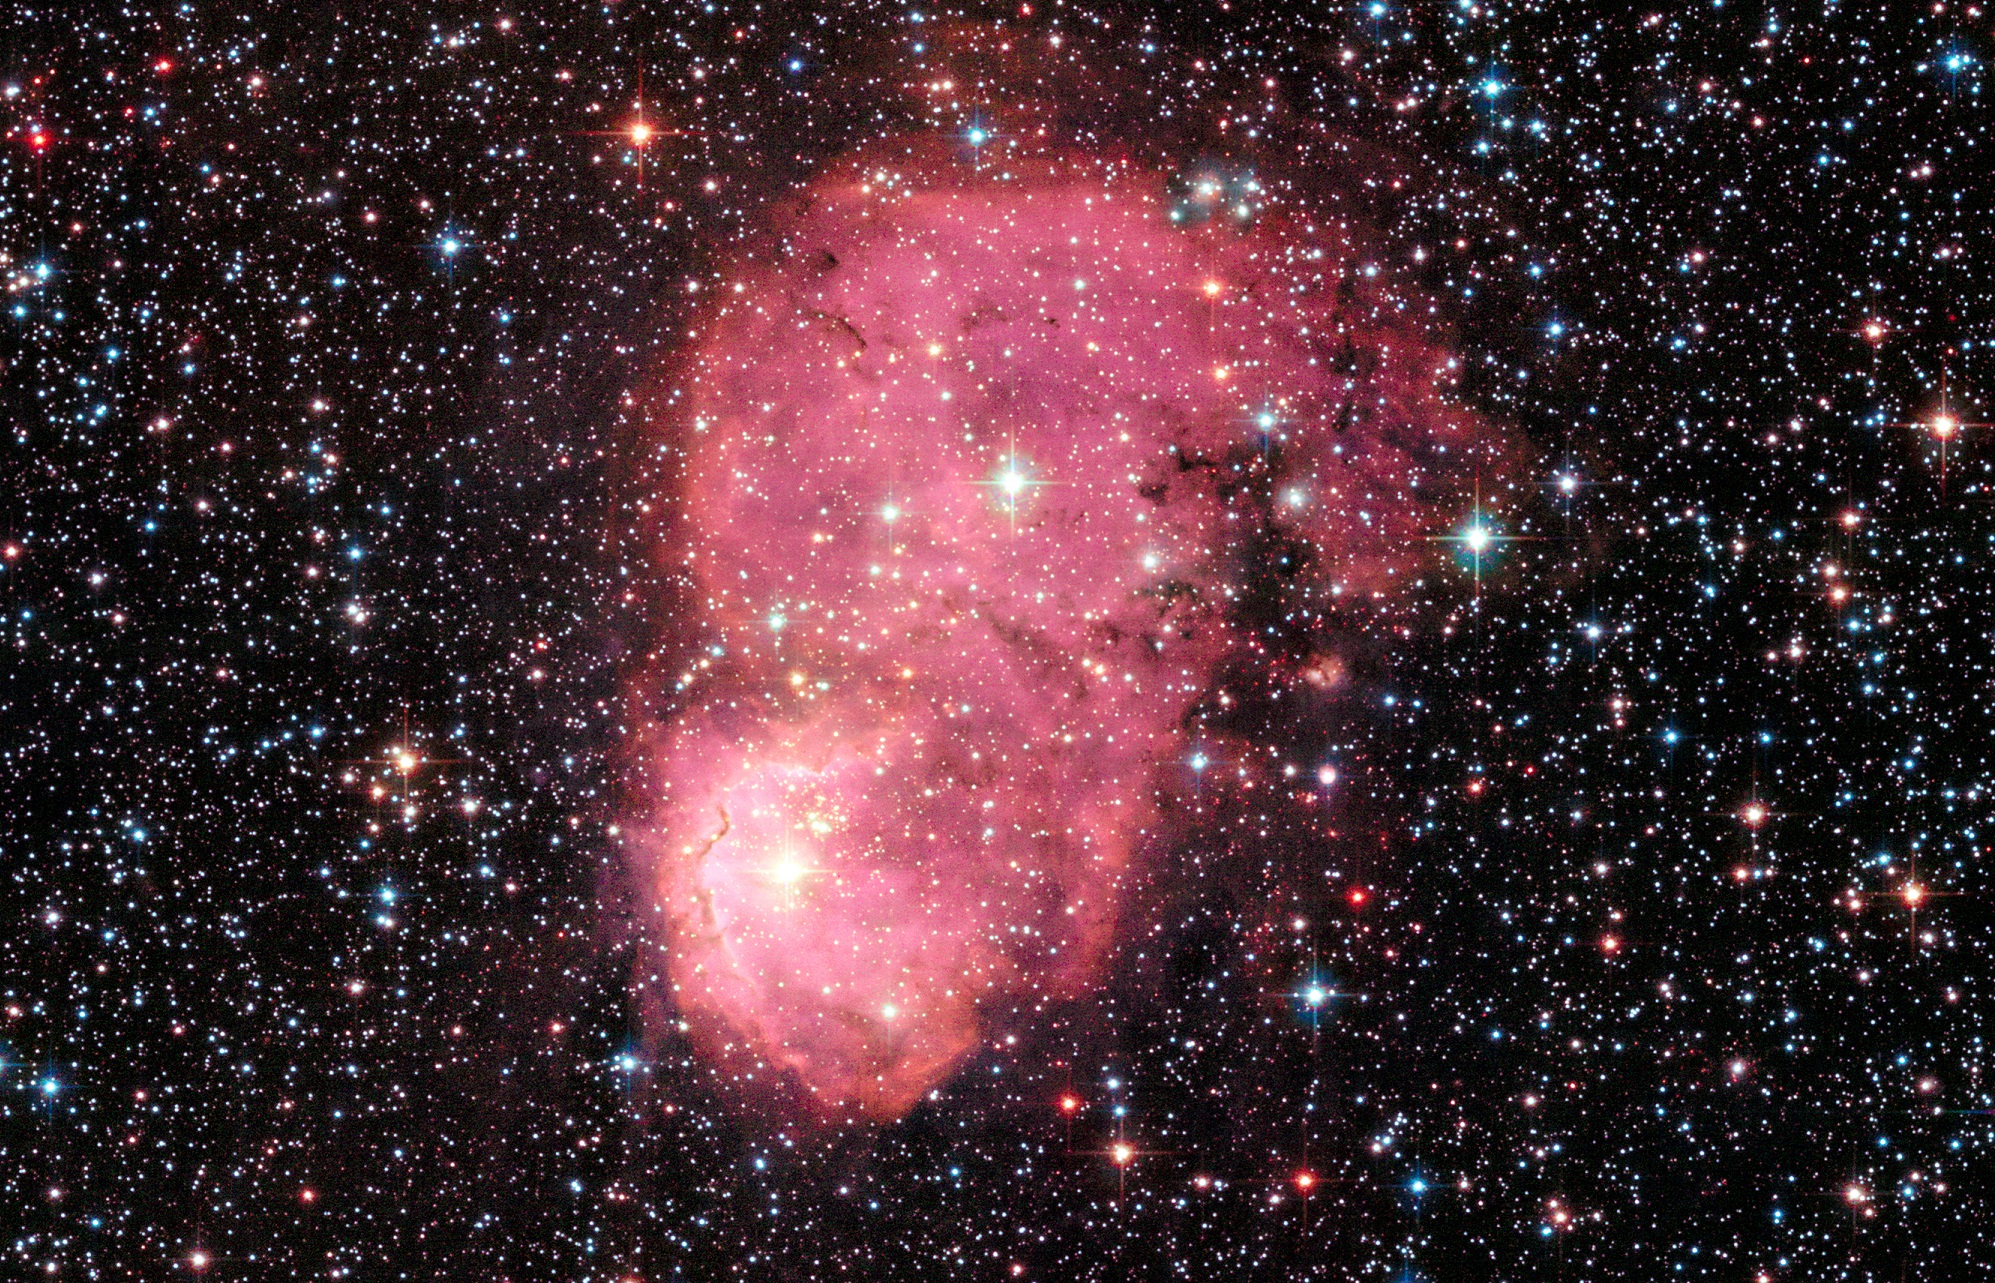
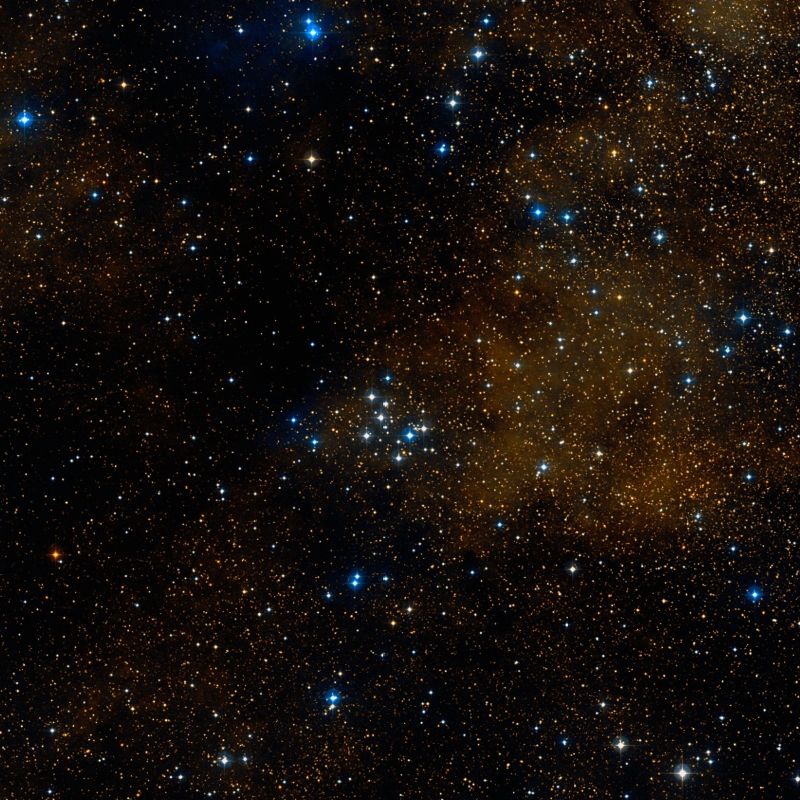
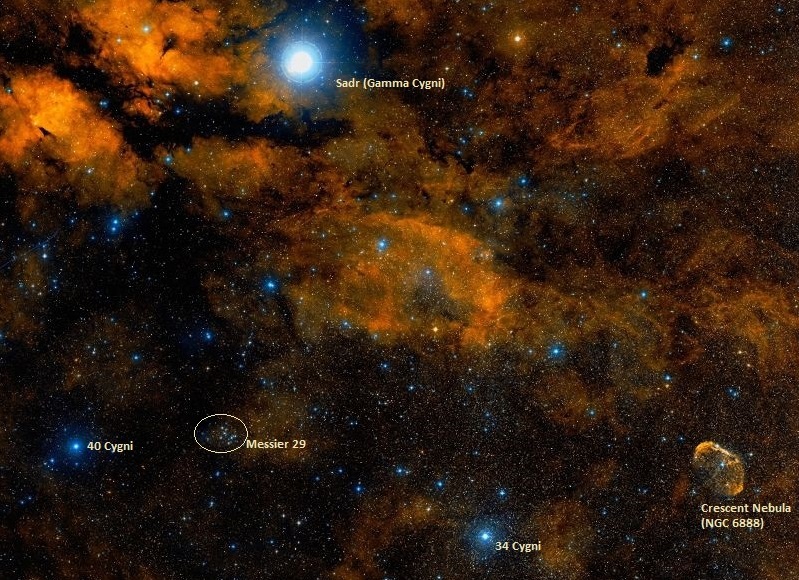
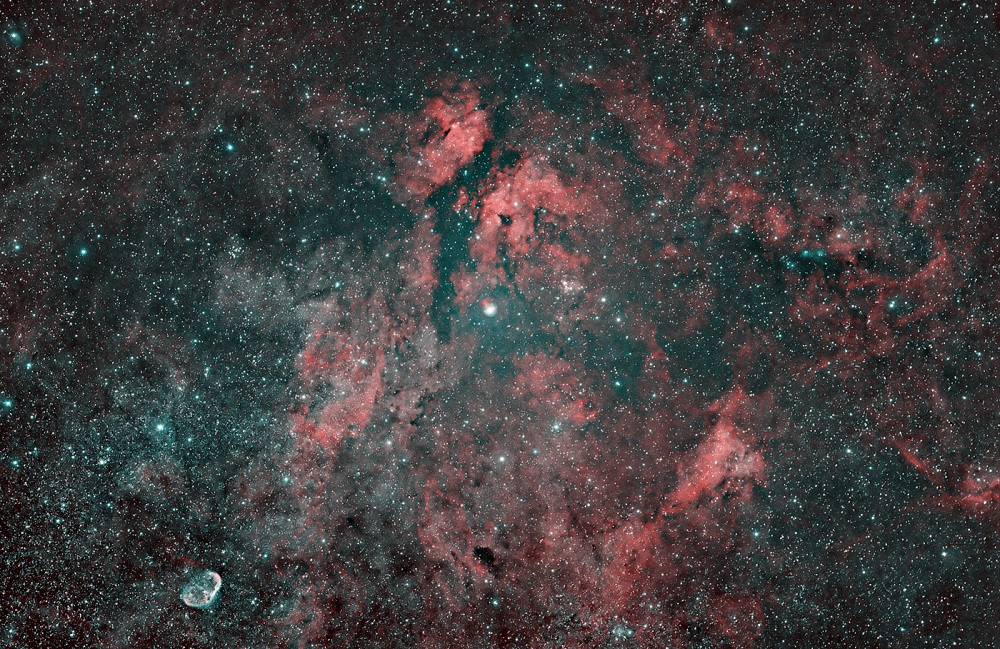
One of these objects is Messier 29, an open star cluster located in the northern skies in the direction of the Cygnus constellation. Situated in a highly crowded area of the Milky Way Galaxy, about 4,000 light-years from Earth, this star cluster is slowly moving towards us. Though somewhat isolated in the night sky, it can be easily spotted using binoculars and small telescopes.
Description:
While Messier Object 29 might appear a little bit boring compared to some of its more splashy catalog companions, it really isn’t. This little group of stars is part of the Cygnus OB1 association which just happens to be heading towards us at a speed of 28 kilometers per second (17.4 mps) . If it weren’t obscured by Milky Way dust, the light of its stars would be 1000 times brighter!
All in all, M29 has around 50 member stars, but this 10 million year old star cluster still has some surprises. The five brightest stars you see are are all giant stars of spectral class B0, and if we were to put one next to our own Sol, it would shine 160,000 times brighter. Image just how “lit up” any planet might be that would reside inside that 11 light year expanse!
Astronomers were curious about Messier 29, too, so they went in search of binary stars. As C. Boeche (et al) wrote in a 2003 study:
“Between 1996 and 2003 we obtained 226 high resolution spectra of 16 stars in the field of the young open cluster NGC 6913, to constrain its main properties and study its internal kinematics. Twelve of the program stars turned out to be members, one of them probably unbound. Nine are binaries (one eclipsing and another double lined) and for seven of them the observations allowed us to derive the orbital elements. All but two of the nine discovered binaries are cluster members. In spite of the young age (a few Myr), the cluster already shows signs that could be interpreted as evidence of dynamical relaxatin and mass segregation.
“However, they may be also the result of an unconventional formation scenario. The dynamical (virial) mass as estimated from the radial velocity dispersion is larger than the cluster luminous mass, which may be explained by a combination of the optically thick interstellar cloud that occults part of the cluster, the unbound state or undetected very wide binary orbit of some of the members that inflate the velocity dispersion and a high inclination for the axis of possible cluster angular momentum. All the discovered binaries are hard enough to survive average close encounters within the cluster and do not yet show signs of relaxation of the orbital elements to values typical of field binaries.”
So why is finding binary stars important? Evolution is the solution, the hunt for Be stars. As S.L. Malchenko of the Crimean Astrophysical Observatory wrote in a 2008 study on Be stars:
“The phenomenon of Be stars has been known for over a century. The fact that at least 20% of B stars have an emission spectrum supports that the definition that this phenomenon is not special but it is rather typical from a large group of objects at a certain stage of evolution. The vagueness of the concept of the Be phenomenon suggests that this definition encompasses a broad group of objects near the main sequence that includes binary systems with different rate of mass exchange. This young open cluster in the Cyg OB1 association, is also know as M29, contains a large number of luminous stars with spectral types around B0. An extreme variation of extinction is found across the young open cluster NGC 6913, extinction in the cluster center is relatively homogeneous, but very large. We observed 10 spectra for 7 B stars and one known Be star in the blue region.”
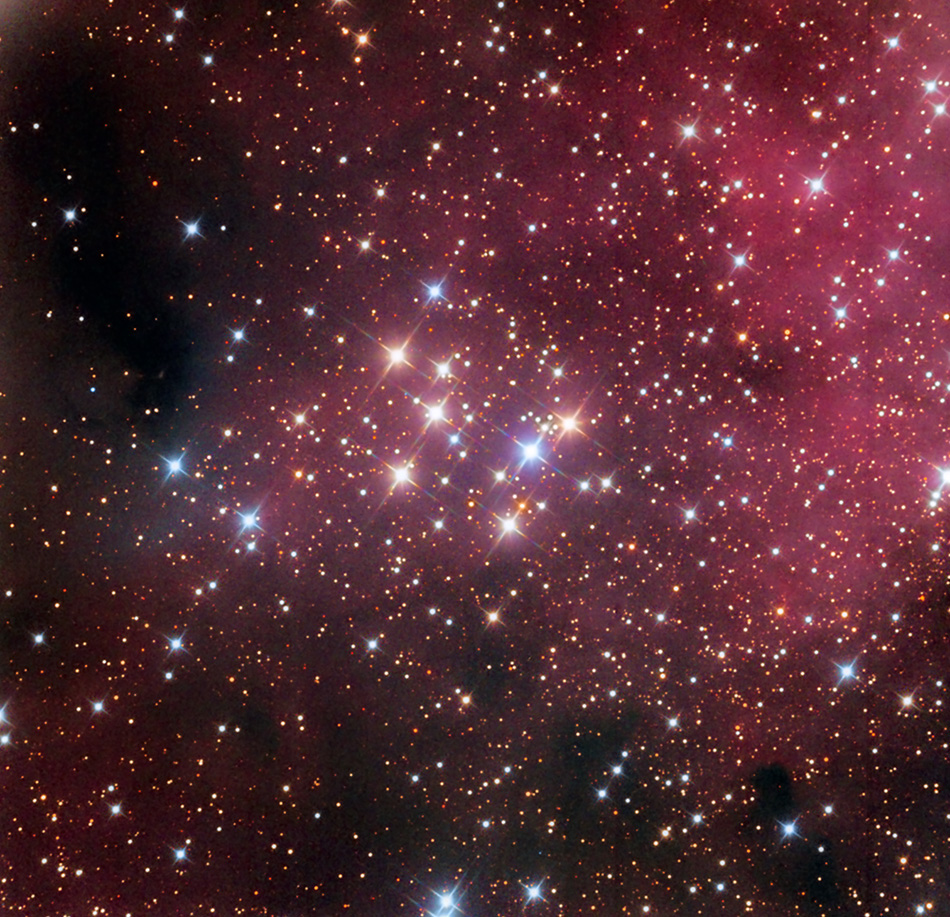
Although you won’t be able to detect it visually, there is also some nebulosity associated with M29, which is another important clue to this star cluster’s evolution. As B. Bhavya of Cochin University of Science and Technology wrote in a 2008 study:
“The Cygnus region is a region of recent star formation activity in the Milky Way and is rich in massive early type stars concentrated in OB associations. The presence of nebulosity and massive stars indicate that the stars have been forming till very recently and the young clusters found here are the result of the recent star formation event. Though the above fact is known, what is not known is that when this star formation process started and how it proceeded in the region. Though one assumes that all the stars in a cluster have the same age, this assumption is not valid when the candidate cluster is very young. In the case of young clusters, there is a chance for a spread in the age of the stars, depending on the duration of star formation. An estimation of this formation time-scale in the clusters formed in a star forming complex, will indicate the duration of star formation and its direction of propagation within the complex. In principle, duration of star formation is defined as the difference between the ages of the oldest and the youngest star formed in the cluster. In practice, the age of the oldest star is assumed as the age of that star which is about to turn-off from the main-sequence (MS) (turn-off age) and the age of the youngest star is the age of the youngest pre-MS star (turn-on age). The turn-off age of many clusters are known, but the turn-on age is not known for most of the clusters.”
History of Observation:
This cool little star cluster was an original discovery of Charles Messier, who first observed it in 1764. As he wrote of the object in his notes at the time:
“In the night of July 29 to 30, 1764, I have discovered a cluster of six or seven very small stars which are below Gamma Cygni, and which one sees with an ordinary refractor of 3 feet and a half in the form of a nebula. I have compared this cluster with the star Gamma, and I have determined its position in right ascension as 303d 54′ 29″, and its declination of 37d 11′ 57″ north.”
In the case of this cluster, it was independently recovered again by Caroline Herschel, who wrote: “About 1 deg under Gamma Cygni; in my telescope 5 small stars thus. My Brother looked at them with the 7 ft and counted 12. It is not in Mess. catalogue.”
William would also return to the cluster as well with his own observations: “Is not sufficiently marked in the heavens to deserve notice, as 7 or 8 small stars together are so frequent about this part of the heavens that one might find them by hundreds.”
So why the confusion? In this circumstance, perhaps Messier was a bit distracted, for it would appear that his logged coordinates were somewhat amiss. Leave it to Admiral Symth to set the records straight:
“A neat but small cluster of stars at the root of the Swan’s neck, and in the preceding branch of the Milky Way, not quite 2deg south of Gamma; and preceding 40 Cygni, a star of the 6th magnitude, by one degree just on the parallel. In the sp [south preceding, SW] portion are the two stars here estimated as double, of which A is 8, yellow; B 11, dusky. Messier discovered this in 1764; and though his description of it is very fair, his declination is very much out: worked up for my epoch it would be north 37d 26′ 15″. But one is only surprised that, with his confined methods and means, so much was accomplished.”
Kudos to Mr. Messier for being able to distinguish a truly related group of stars in a field of so many! Take the time to enjoy this neat little grouping for yourself and remember – it’s heading our way.
Locating Messier 29:
Finding M29 in binoculars or a telescope is quite easy once you recognize the constellation of Cygnus. Its cross-shape is very distinctive and the marker star you will need to locate this open star cluster is Gamma – bright and centermost. For most average binoculars, you will only need to aim at Gamma and you will see Messier 29 as a tiny grouping of stars that resembles a small box.
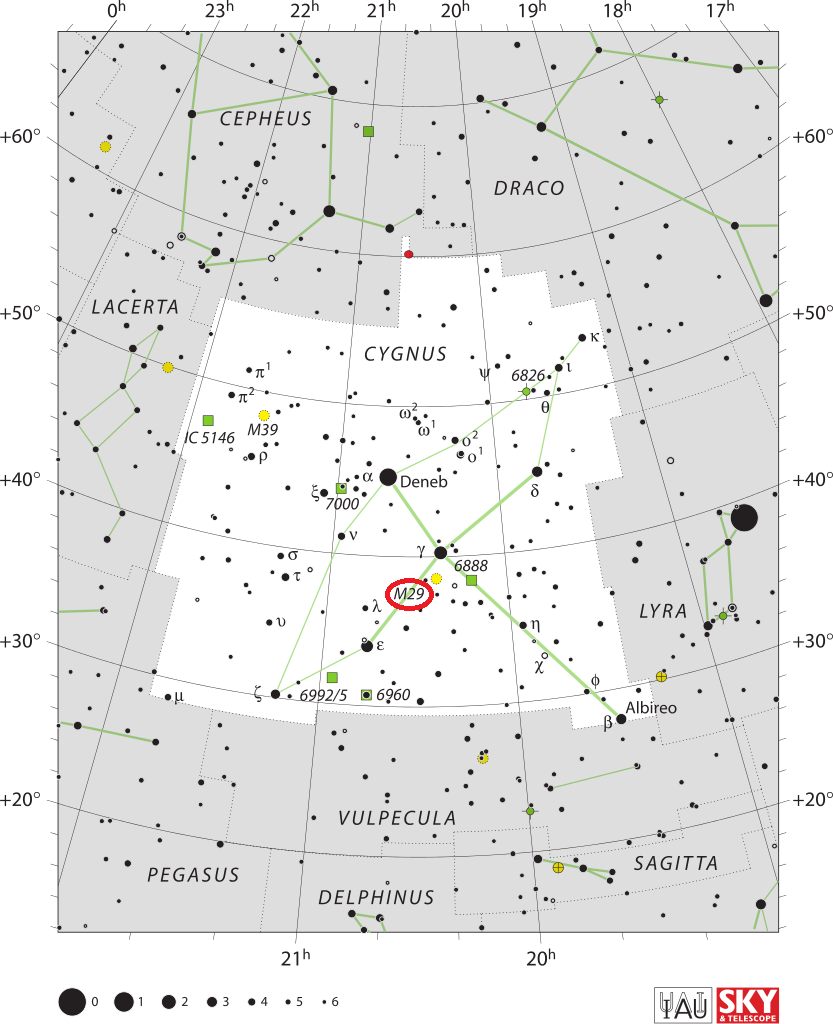
For a telescope, begin with your finderscope on Gamma, and look for your next starhop marker star about a finger width southwest. Once this star is near the center of your finderscope field, M29 will also be in a low magnification eyepiece field of view. Because it is a very widely spaced galactic open star cluster that only consists of a few stars, it makes an outstanding object that stands up to any type of sky conditions.
Except, of course, clouds! Messier 29 can easily be seen in light polluted areas and during a full Moon – making it a prize object for study for even the smallest of telescopes.
As always, here are the quick facts to help you get started:
Object Name: Messier 29
Alternative Designations: M29, NGC 6913
Object Type: Open Galactic Star Cluster
Constellation: Cygnus
Right Ascension: 20 : 23.9 (h:m)
Declination: +38 : 32 (deg:m)
Distance: 4.0 (kly)
Visual Brightness: 7.1 (mag)
Apparent Dimension: 7.0 (arc min)
We have written many interesting articles about Messier Objects here at Universe Today. Here’s Tammy Plotner’s Introduction to the Messier Objects, , M1 – The Crab Nebula, M8 – The Lagoon Nebula, and David Dickison’s articles on the 2013 and 2014 Messier Marathons.
Be to sure to check out our complete Messier Catalog. And for more information, check out the SEDS Messier Database.
Sources: