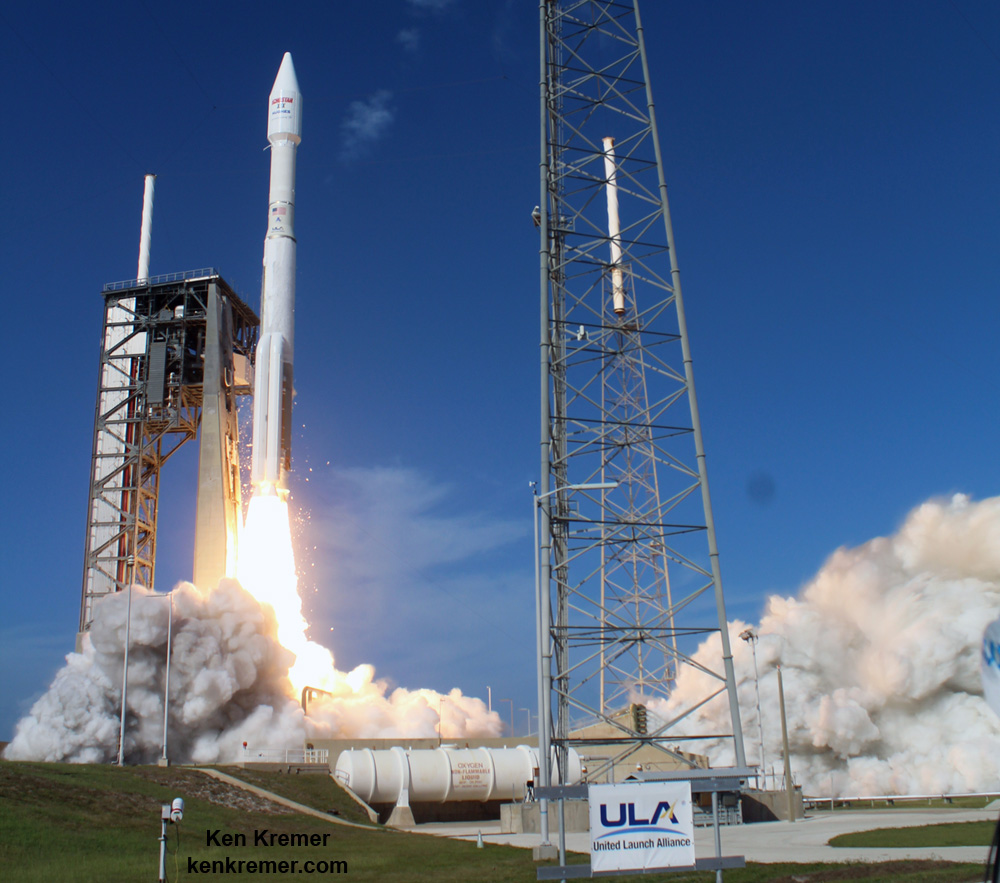
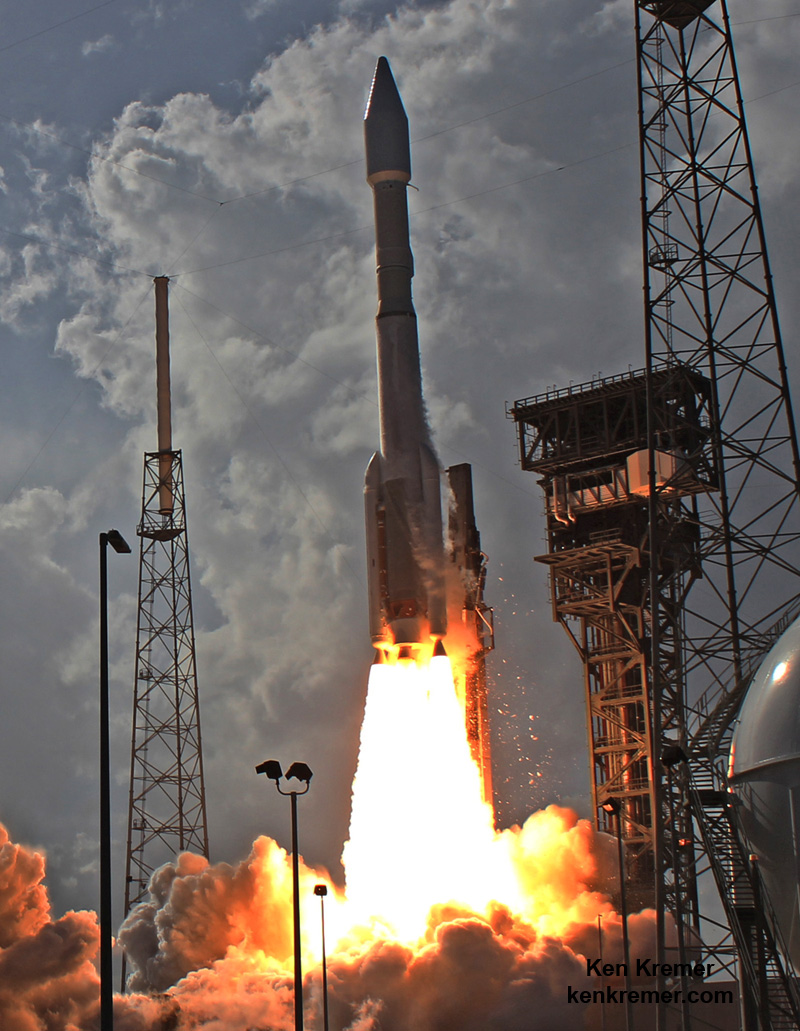
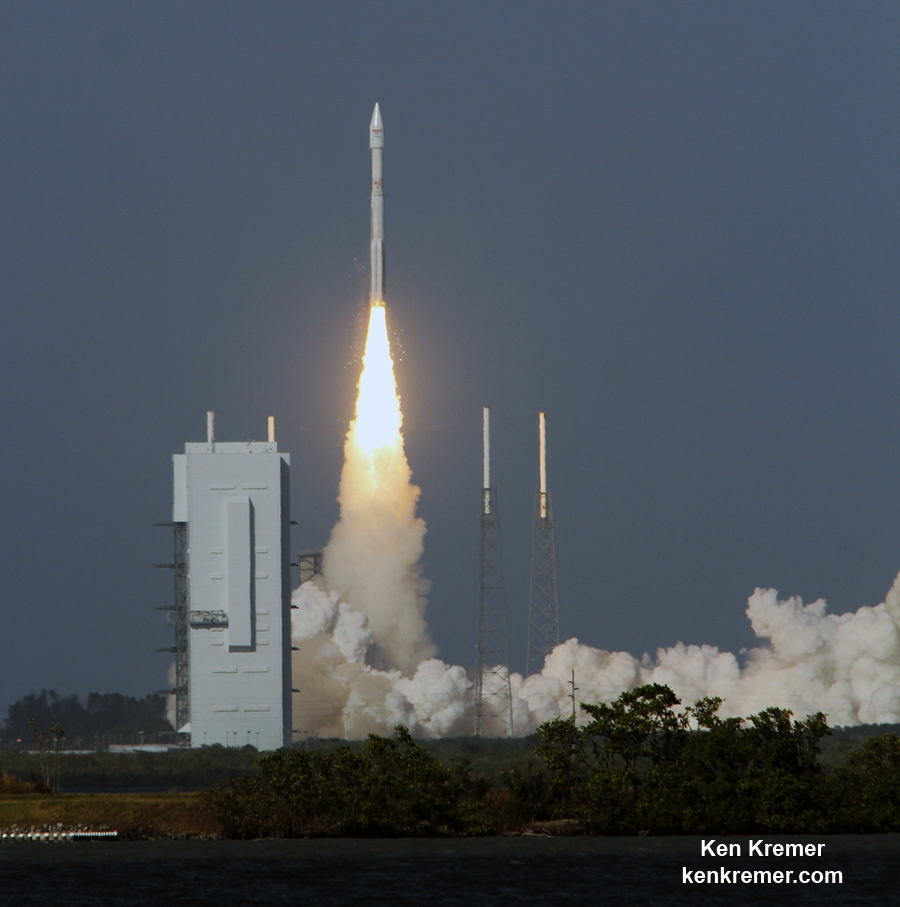
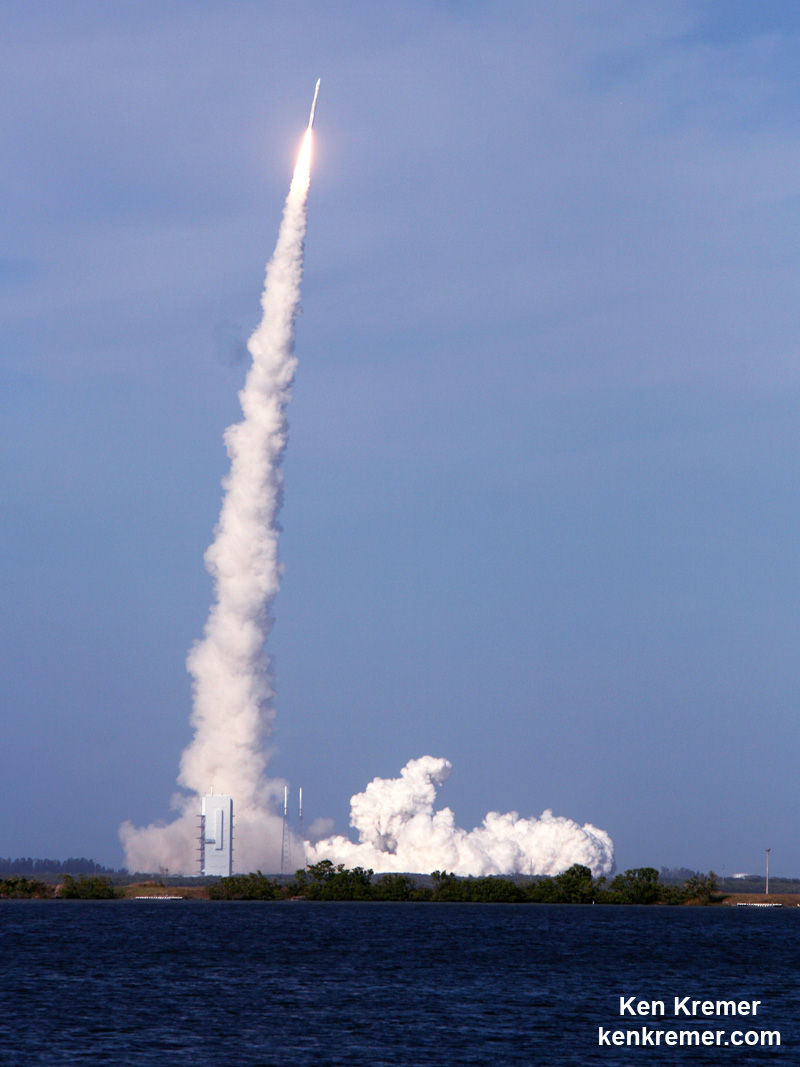
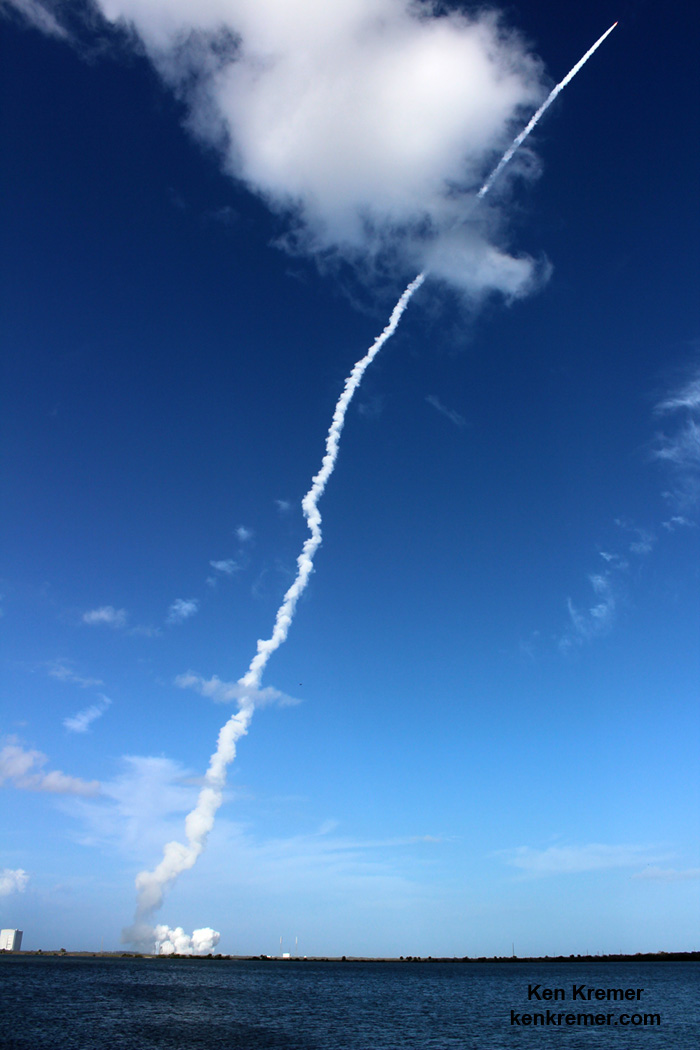
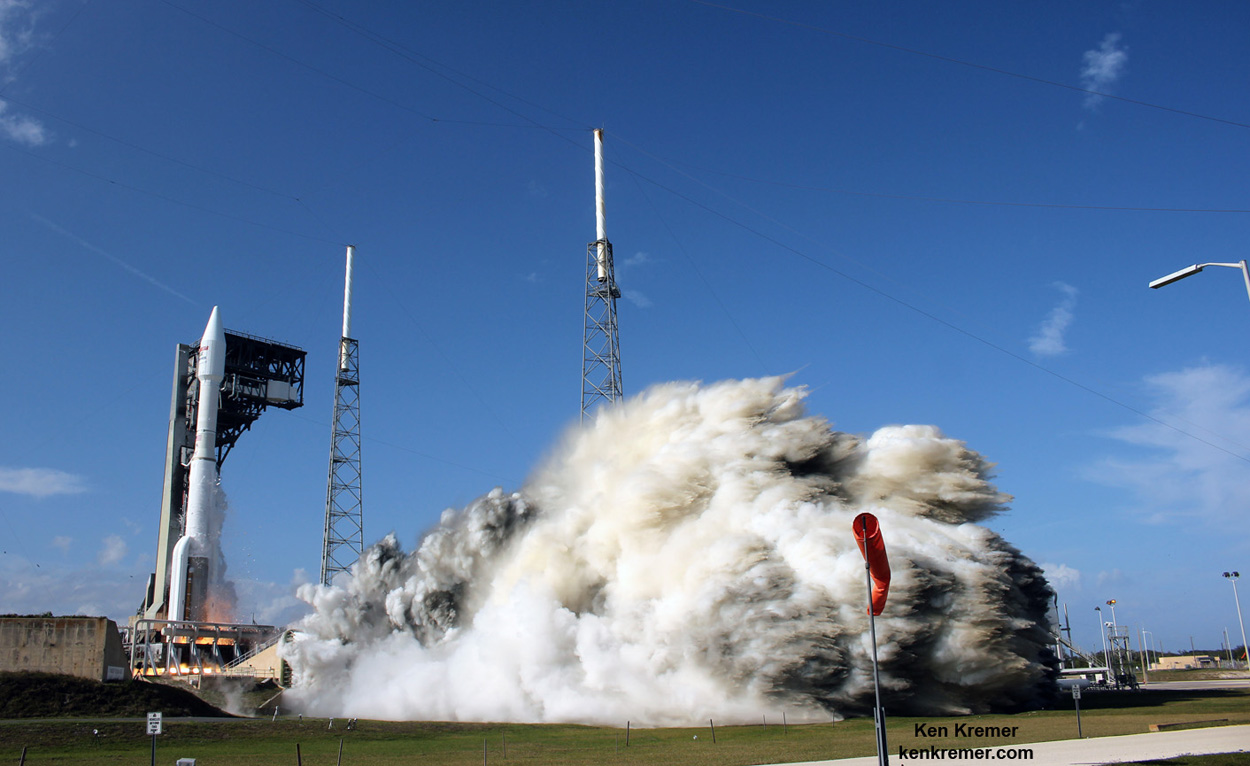
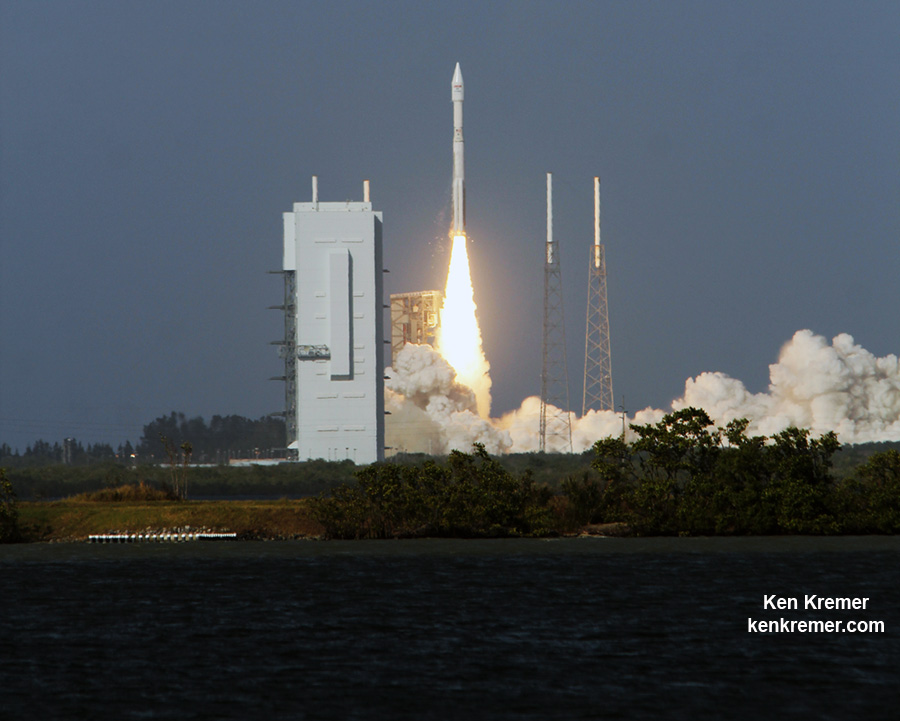
Fiery blastoff of a United Launch Alliance (ULA) Atlas V rocket carrying the EchoStar XIX satellite from Space Launch Complex-41 on Cape Canaveral Air Force Station, Fl., at 2:13 p.m. EST on Dec. 18, 2016. Credit: Ken Kremer/kenkremer.com
Fiery blastoff of a United Launch Alliance (ULA) Atlas V rocket carrying the EchoStar XIX satellite from Space Launch Complex-41 on Cape Canaveral Air Force Station, Fl., at 2:13 p.m. EST on Dec. 18, 2016. Credit: Ken Kremer/kenkremer.com
EchoStar 19 or XIX, is the highest capacity broadband satellite ever built and launched and promises a vast increase in capacity for homes and businesses subscribing to HughesNet® across North America.
Check out this expanding and explicit gallery of eyepopping photos and videos from several space journalist colleagues and friends and myself – and revealing how EchoStar earned its way to geosynchronous orbit from prelaunch to launch atop a United Launch Alliance Atlas V rocket.
Click back as the gallery grows !
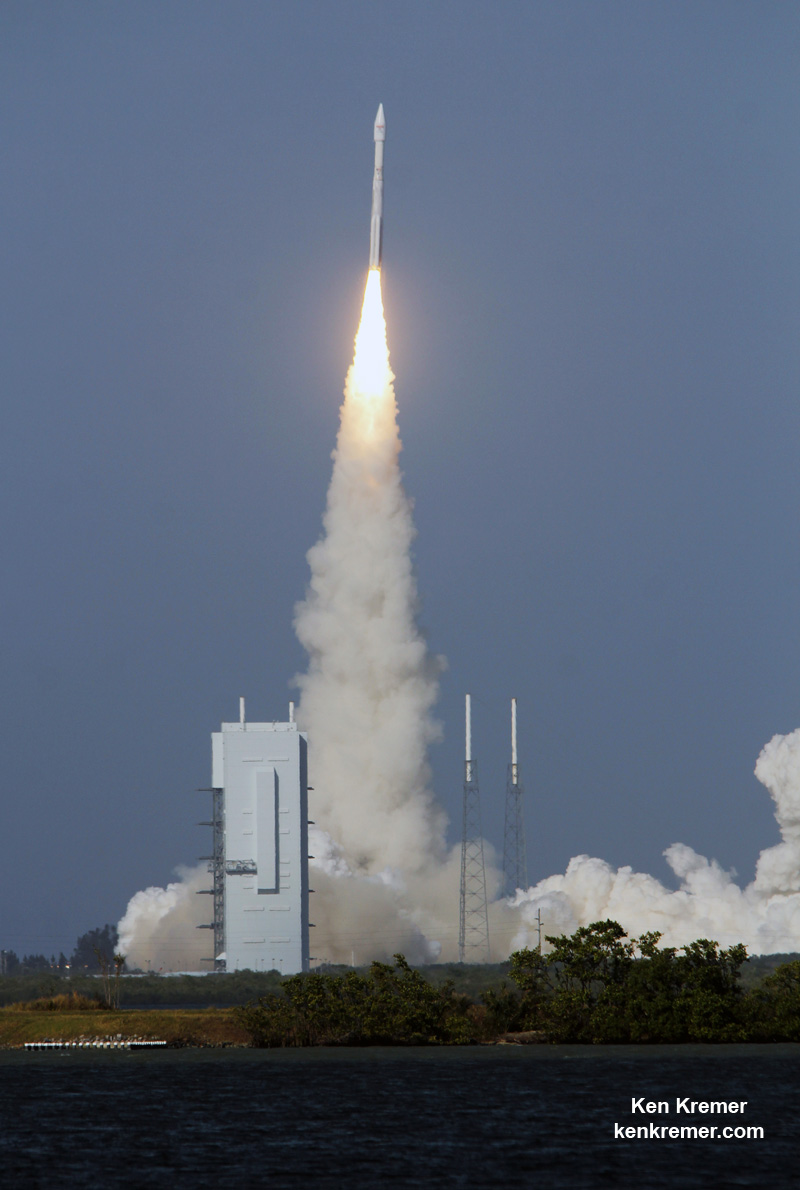
The ULA Atlas V blasted off from Space Launch Complex 41 (SLC-41) Cape Canaveral Air Force Station at 2:13 p.m. EST at lunchtime on Sunday, Dec. 18, 2016.
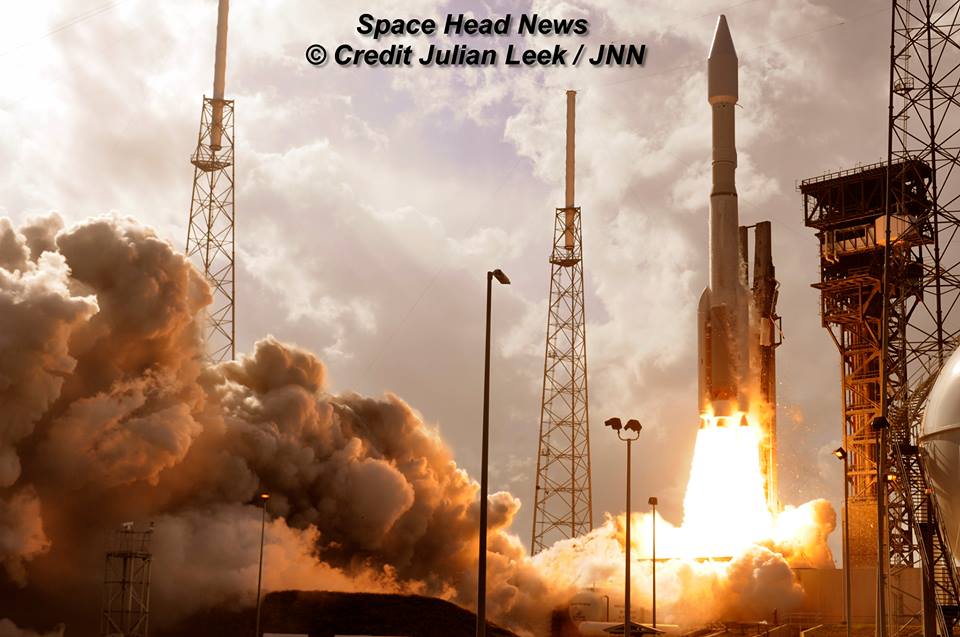
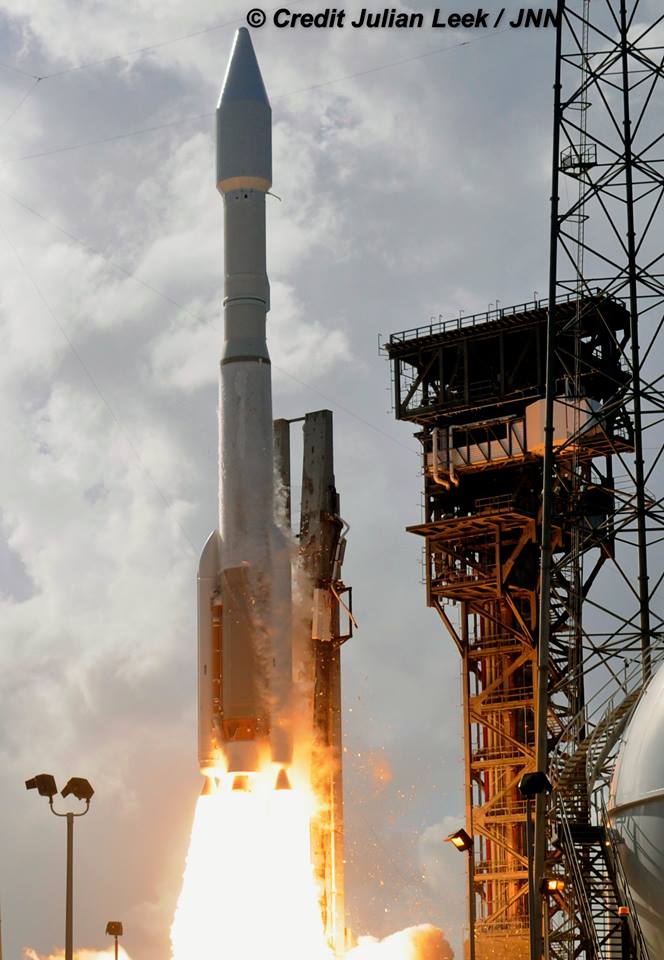
ULA Atlas V rocket and EchoStar XIX satellite lift off from Space Launch Complex-41 on Cape Canaveral Air Force Station at 2:13 p.m. ET on Dec. 18, 2016. Credit: Julian Leek
EchoStar 19, also known as Jupiter 2, marked ULA’s final mission of 2016 – completing a dozen liftoffs and a dozen sterling successes.
ULA has enjoyed a 100% success rate for this 68th Atlas V launch stretching back to the company’s founding back in 2006.
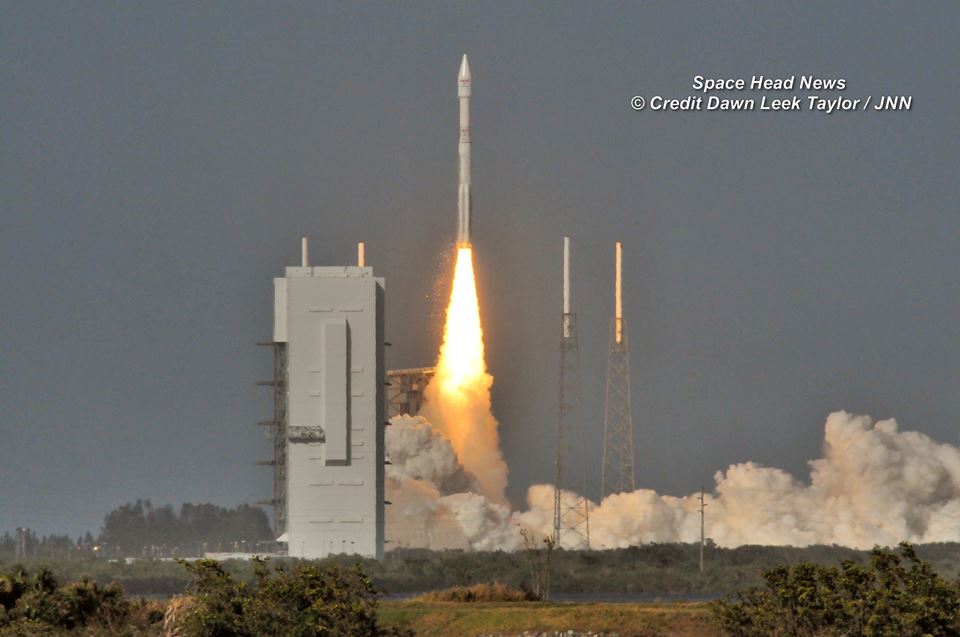
Launch of EchoStar XIX satellite atop ULA Atlas V from pad 41 on Cape Canaveral Air Force Station at 2:13 p.m. ET on Dec. 18, 2016. Credit: Dawn Leek Taylor
ULA is a joint venture of Boeing and Lockheed Martin with 115 successful launches under its belt.
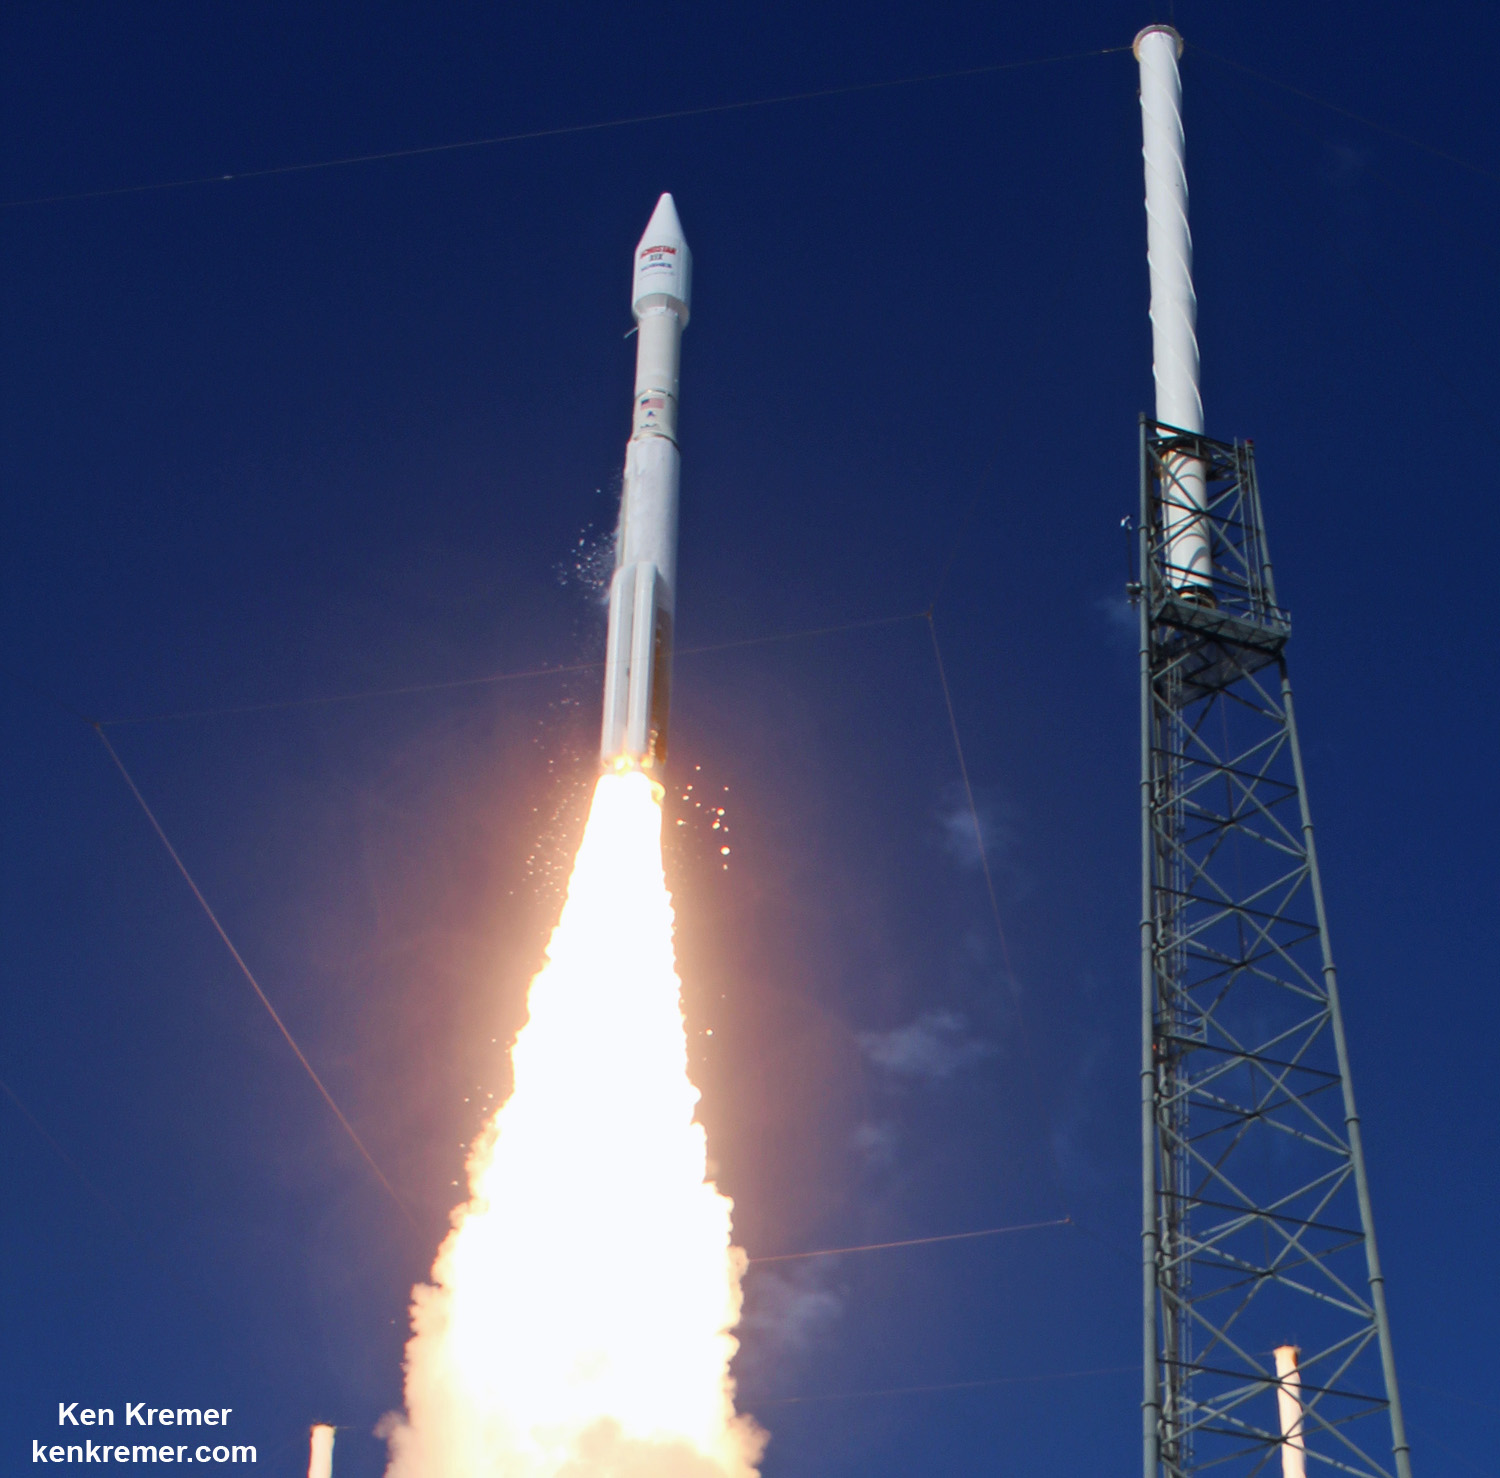
The 194-foot-tall commercial Atlas V booster launched in the 431 rocket configuration with approximately 2 million pounds of first stage thrust.
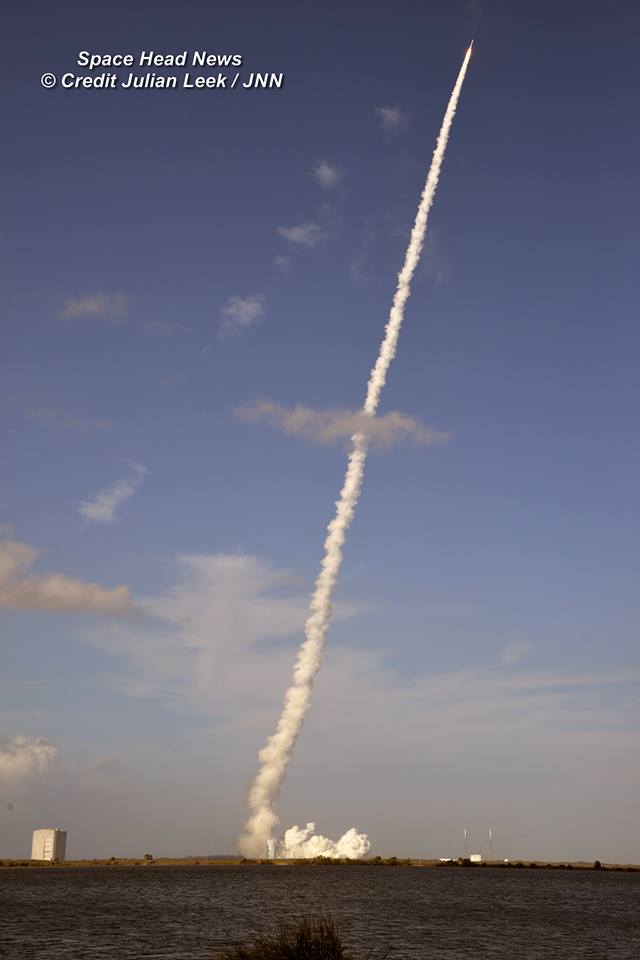
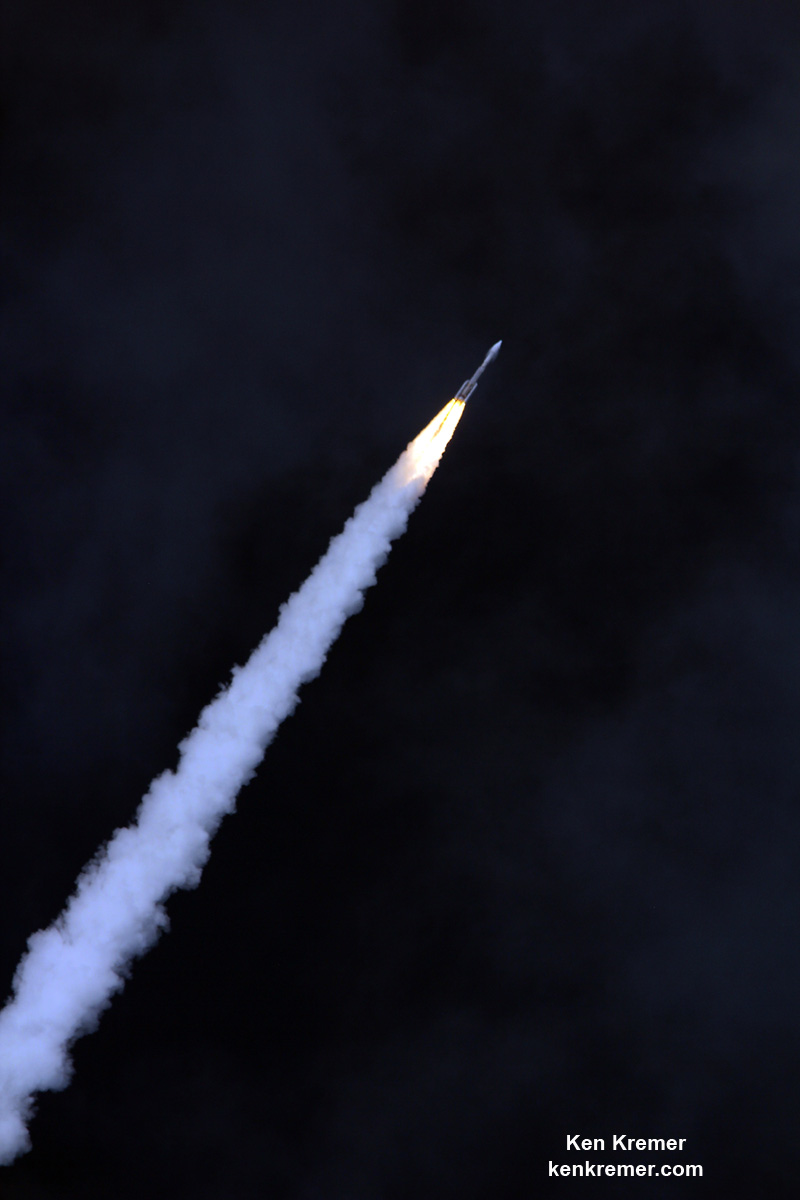
ULA Atlas V rocket streaks to orbit carrying EchoStar XIX satellite after lift off from pad 41 on Cape Canaveral Air Force Station, Fl., at 2:13 p.m. EST on Dec. 18, 2016. Credit: Julian Leek
This is the 3rd launch of the 431 configuration. All 3 delivered commercial communications satellites to orbit.
Three solid rocket motors are attached to the Atlas booster to augment the first stage powered by the dual nozzle RD AMROSS RD-180 engine.
The satellite is housed inside a 4-meter diameter extra extended payload fairing (XEPF). The Centaur upper stage was powered by the Aerojet Rocketdyne RL10C engine.
Here’s a trio of launch videos revealing different perspectives of the launch, including views from a remote video at the pad, a remote time-lapse camera at the pad, and from the Kennedy Space Center Visitor Complex at the Apollo-Saturn center.
Video Caption: This 160X speed time lapse starts at 5AM with a fogged camera. It follows last minute ULA prep work, w/ launch at 03:15 on the video on Dec. 18, 2016. It then follows pad cool down and securing by ULA, and concludes with our remote camera pickup at 3:45PM. We even had a little rain shower at the end. Credit: Jeff Seibert
Video Caption: Atlas V rocket launched the US EchoStar 19 high-speed internet satellite on Dec 18, 2016 from Cape Canaveral Air Force Station at 2:13 p.m. EST. Credit: Tania Rostane
Video Caption: Launch of EchoStar 19 high speed internet satellite for North America on a United Launch Alliance (ULA) Atlas V rocket from SLC-41 on Cape Canaveral Air Force Station at 2:13 p.m. EST on Dec. 18, 2016 – as seen in this remote video taken at the pad. Credit: Ken Kremer/kenkremer.com
December has been an extremely busy time for launches at the Cape, with three in the past week and a half supported by U.S. Air Force’s 45th Space Wing.
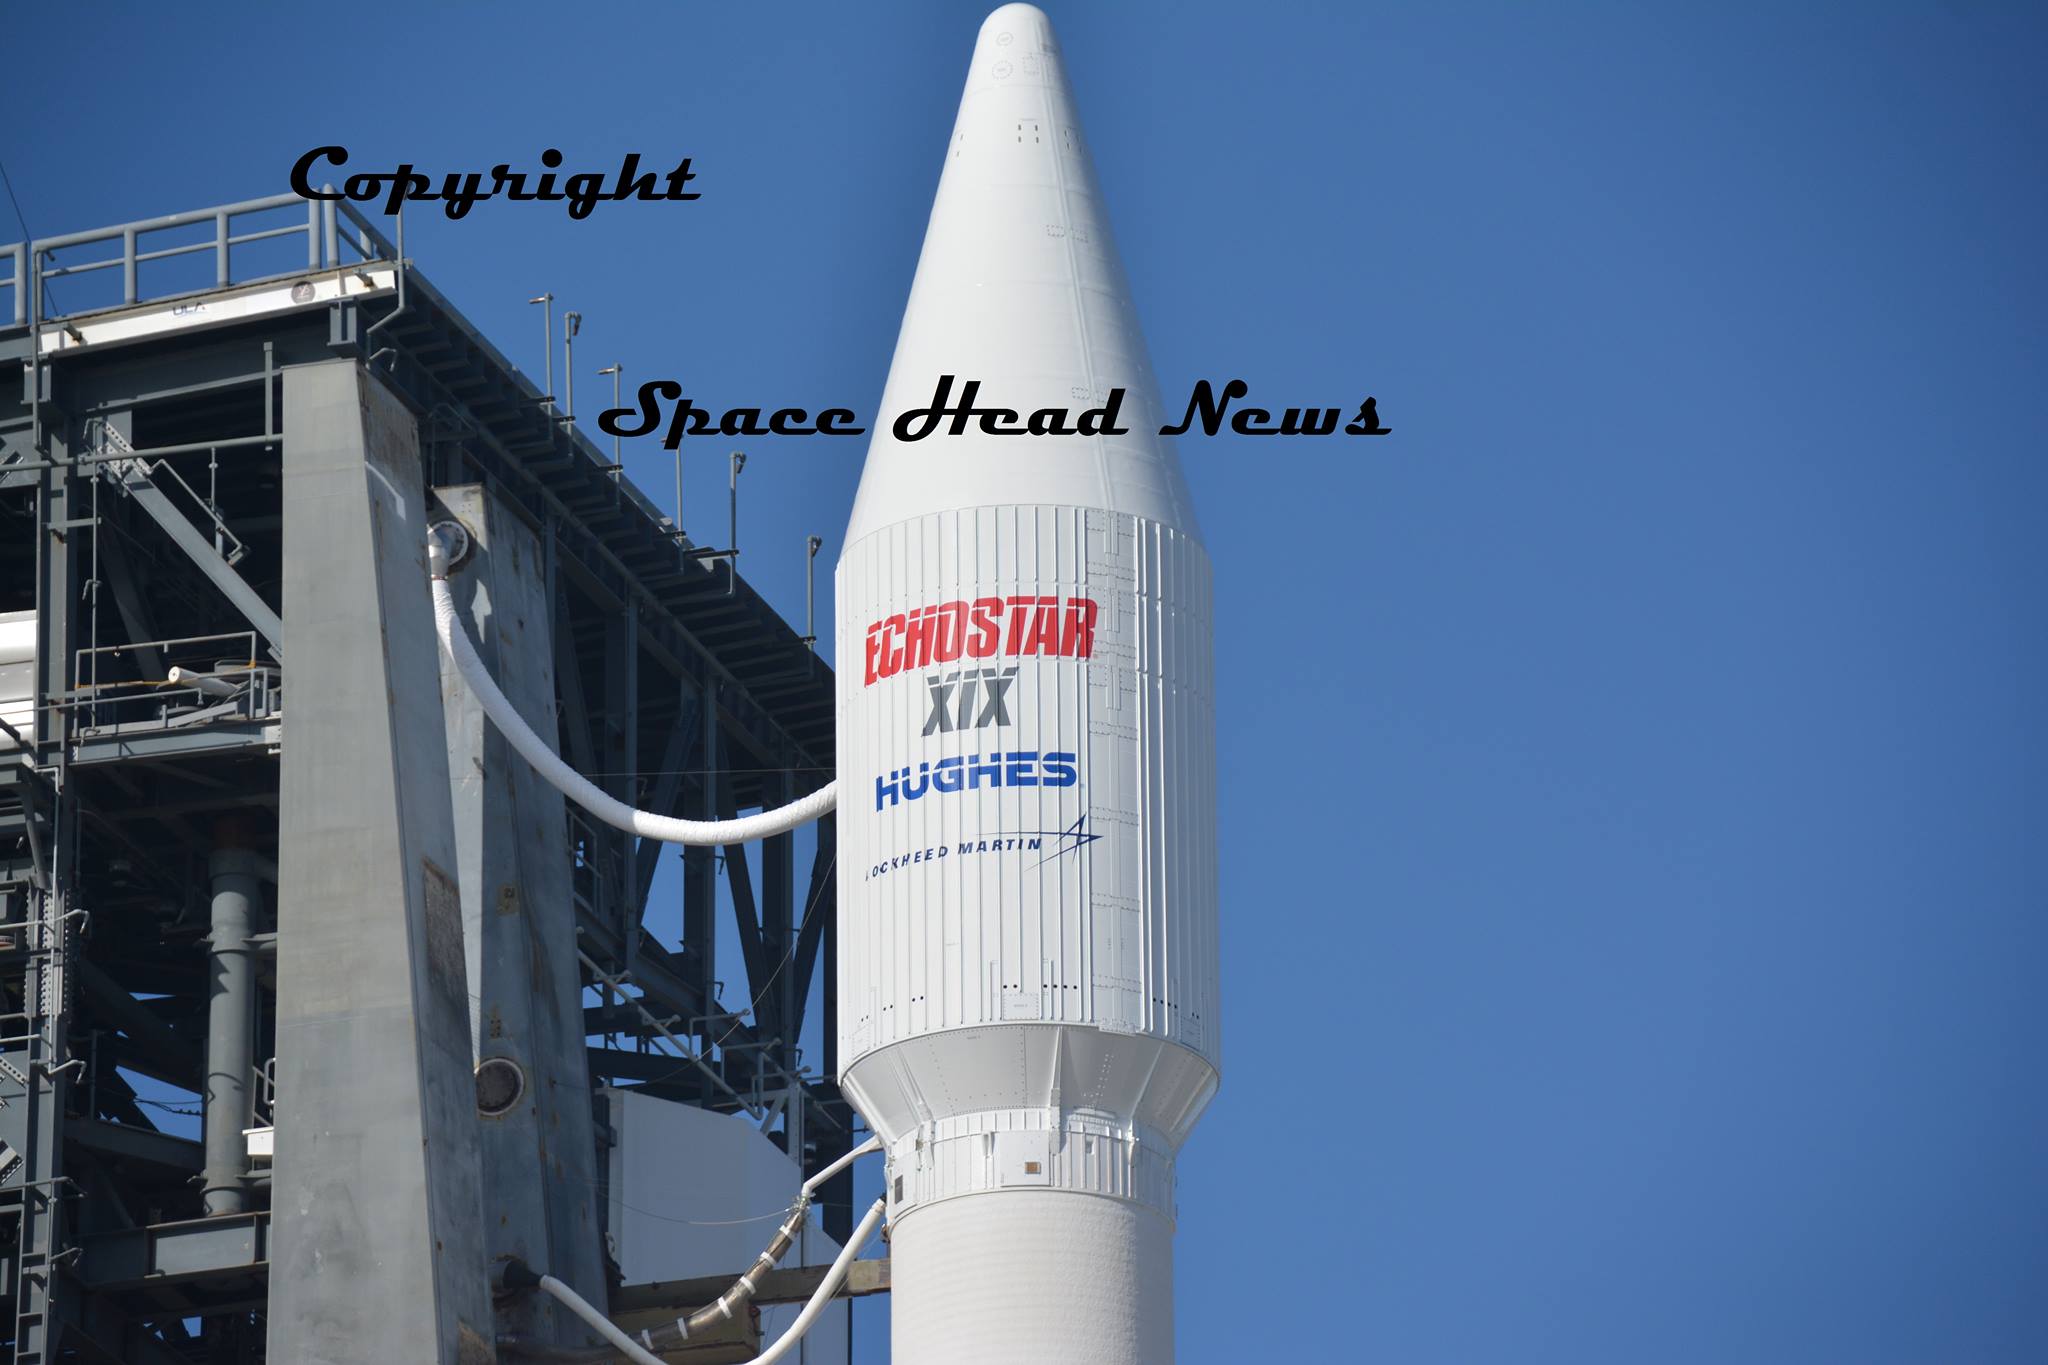
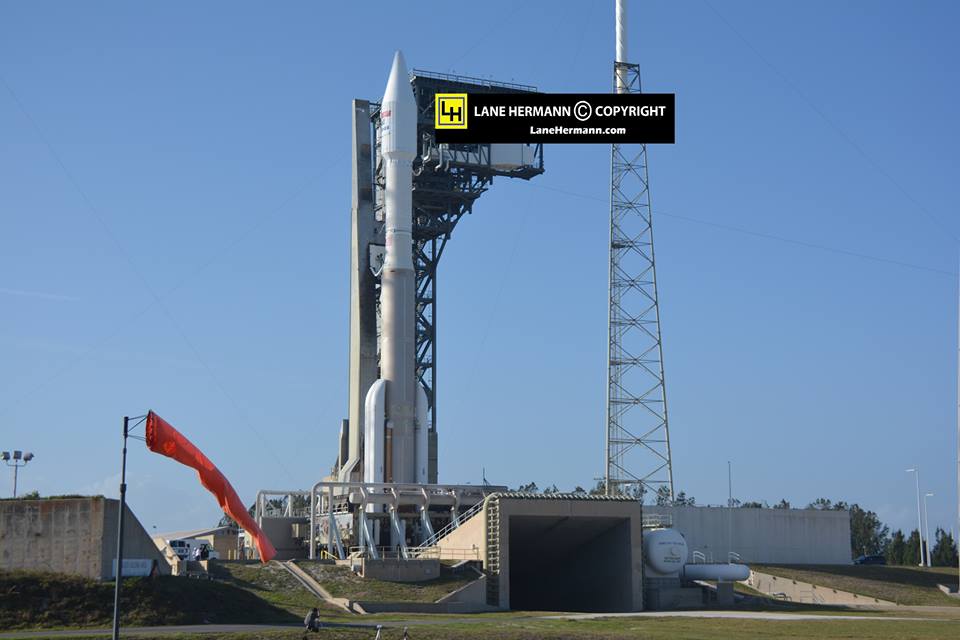
EchoStar XIX satellite housed inside payload fairing atop ULA Atlas V at pad 41 prior to liftoff on Dec. 18, 2016 from Cape Canaveral, Fl. Credit: Lane Hermann
Stay tuned here for Ken’s continuing Earth and Planetary science and human spaceflight news.
Blastoff of a United Launch Alliance (ULA) Atlas V rocket carrying the EchoStar XIX satellite from Space Launch Complex-41 on Cape Canaveral Air Force Station, Fl., at 2:13 p.m. EST on Dec. 18, 2016. Credit: Ken Kremer/kenkremer.comULA Atlas V rocket and EchoStar XIX satellite lift off from Space Launch Complex-41 on Cape Canaveral Air Force Station at 2:13 p.m. ET on Dec. 18, 2016. Credit: Julian LeekEchoStar XIX satellite lifts off atop ULA Atlas V from pad 41 on Dec. 18, 2016. Credit: Julian LeekIgnition and liftoff of United Launch Alliance (ULA) Atlas V rocket delivering EchoStar 19 satellite to orbit from Space Launch Complex-41 on Cape Canaveral Air Force Station, Fl., at 2:13 p.m. EST on Dec. 18, 2016. Credit: Ken Kremer/kenkremer.comLiftoff of ULA Atlas V rocket delivering EchoStar 19 satellite to orbit from Space Launch Complex-41 on Cape Canaveral Air Force Station, Fl., at 2:13 p.m. EST on Dec. 18, 2016. Credit: Ken Kremer/kenkremer.comEchoStar XIX satellite poised for liftoff on ULA Atlas V at pad 41 on Dec. 18, 2016 from Cape Canaveral, Fl. Credit: Lane HermannEchoStar XIX satellite speeds to geosynchronous orbit launching atop ULA Atlas V rocket from pad 41 on Cape Canaveral Air Force Station at 2:13 p.m. ET on Dec. 18, 2016. Credit: Ken Kremer/kenkremer.comULA Atlas V rocket streaks to orbit carrying EchoStar XIX satellite after lift off from Space Launch Complex-41 on Cape Canaveral Air Force Station, Fl., at 2:13 p.m. EST on Dec. 18, 2016. Credit: Ken Kremer/kenkremer.comULA Atlas V zooms to orbit with EchoStar 19 from Florida Space Coast with first stage engines firing 2 million pounds of thrust from liquid and solid fueled motors as it arcs over to Africa on Dec. 18, 2016. Credit: Ken Kremer/kenkremer.com ULA Atlas V zooms to orbit with EchoStar 19 from Florida Space Coast on 2 million pounds of thrust from liquid and solid fueled motors on Dec. 18, 2016 . Credit: Ken Kremer/kenkremer.comFiery blastoff of a United Launch Alliance (ULA) Atlas V rocket carrying the EchoStar XIX satellite from Space Launch Complex-41 on Cape Canaveral Air Force Station, Fl., at 2:13 p.m. EST on Dec. 18, 2016. Credit: Ken Kremer/kenkremer.comUnited Launch Alliance (ULA) Atlas V rocket streaks to orbit carrying EchoStar XIX satellite after lift off from Space Launch Complex-41 on Cape Canaveral Air Force Station, Fl., at 2:13 p.m. EST on Dec. 18, 2016. Credit: Ken Kremer/kenkremer.comFiery blastoff of a United Launch Alliance (ULA) Atlas V rocket carrying the EchoStar XIX satellite from Space Launch Complex-41 on Cape Canaveral Air Force Station, Fl., at 2:13 p.m. EST on Dec. 18, 2016. Credit: Ken Kremer/kenkremer.com
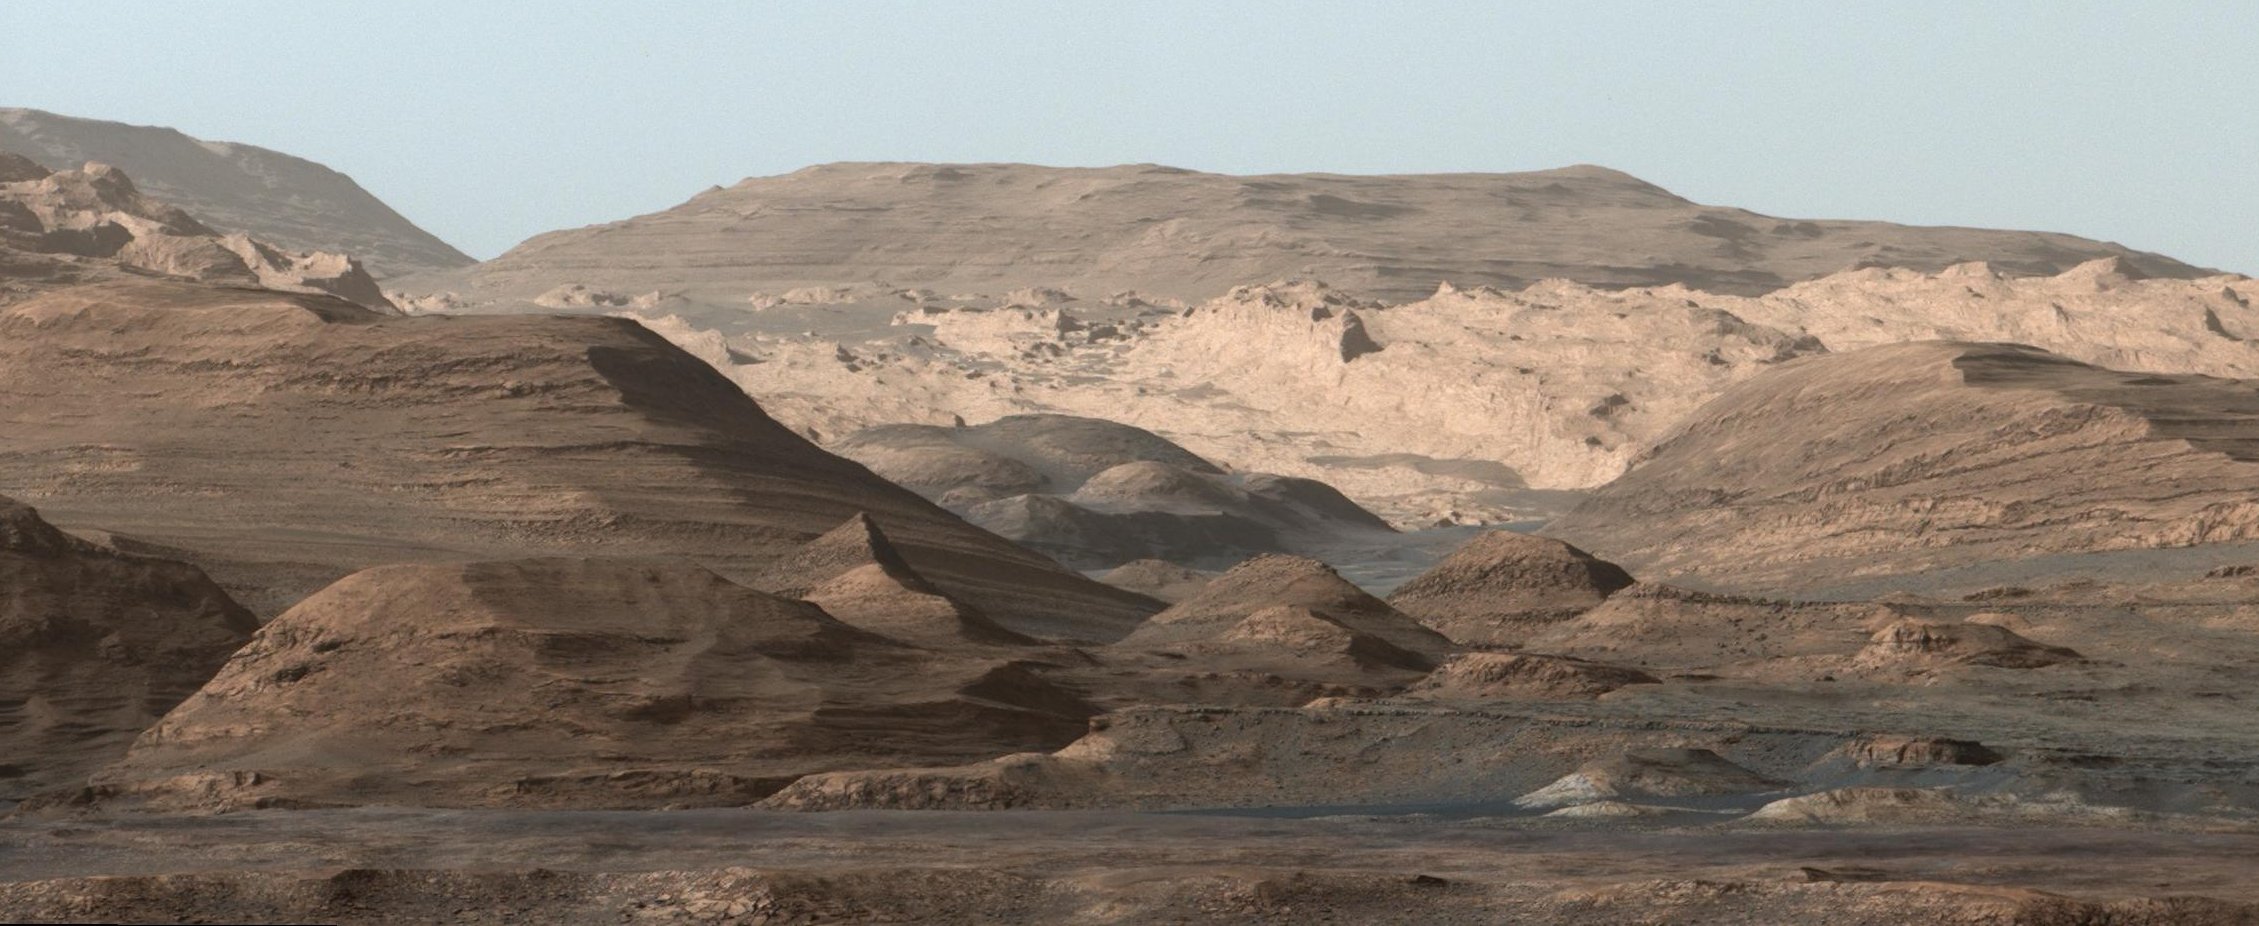
Curiosity's view of Mount Sharp, taken with the MastCam on Sept. 9th, 2015. Credit: NASA/JPL-Caltech/MSSS
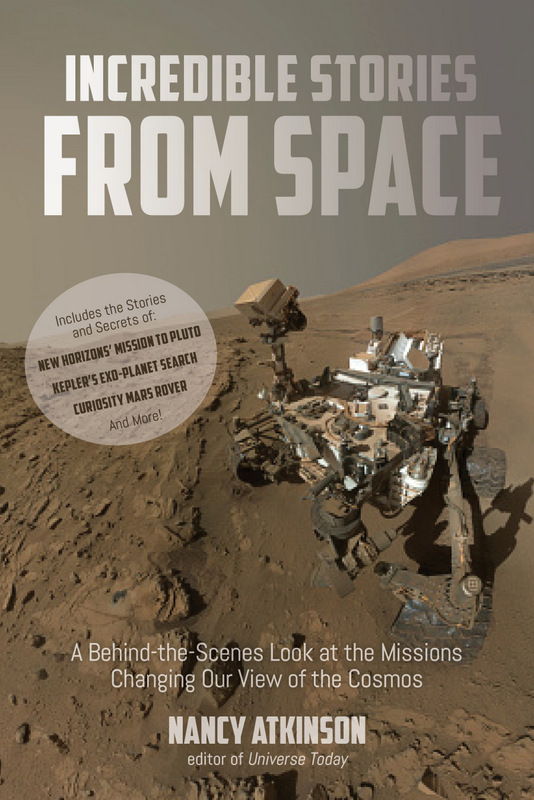
Following is Part 2 of an excerpt from my new book, “Incredible Stories From Space: A Behind-the-Scenes Look at the Missions Changing Our View of the Cosmos.” The book is an inside look at several current NASA robotic missions, and this excerpt is part 2 of 3 which will be posted here on Universe Today, of Chapter 2, “Roving Mars with Curiosity.” You can read Part 1 here. The book is available in print or e-book (Kindle or Nook) Amazon and Barnes & Noble.
Living on Mars Time
The landing occurred at 10:30 pm in California. The MSL team had little time to celebrate, transitioning immediately to mission operations and planning the rover’s first day of activity. The team’s first planning meeting started at 1 o’clock in the morning, ending about 8 a.m. They had been up all night, putting in a nearly 40-hour day.
This was a rough beginning of the mission for the scientists and engineers who needed to live on ‘Mars Time.’
A day on Mars day is 40 minutes longer than Earth’s day, and for the first 90 Mars days – called sols — of the mission, the entire team worked in shifts around the clock to constantly monitor the newly landed rover. To operate on the same daily schedule as the rover meant a perpetually shifting sleep/wake cycle where the MSL team would alter their schedules 40 minutes every day to stay in sync with the day and night schedules on Mars. If team members came into work at 9:00 a.m., the next day, they’d come in at 9:40 a.m., and the next day at 10:20 a.m., and so on.
Those who have lived through Mars Time say their bodies continually feel jet-lagged. Some people slept at JPL so as not to disrupt their family’s schedule, some wore two watches so they would know what time it was on two planets.
About 350 scientists from around the world were involved with MSL and many of them stayed at JPL for the first 90 sols of the mission, living on Mars Time.
But it took less than 60 Earth days for the team to announce Curiosity’s first big discovery.
Water, Water …
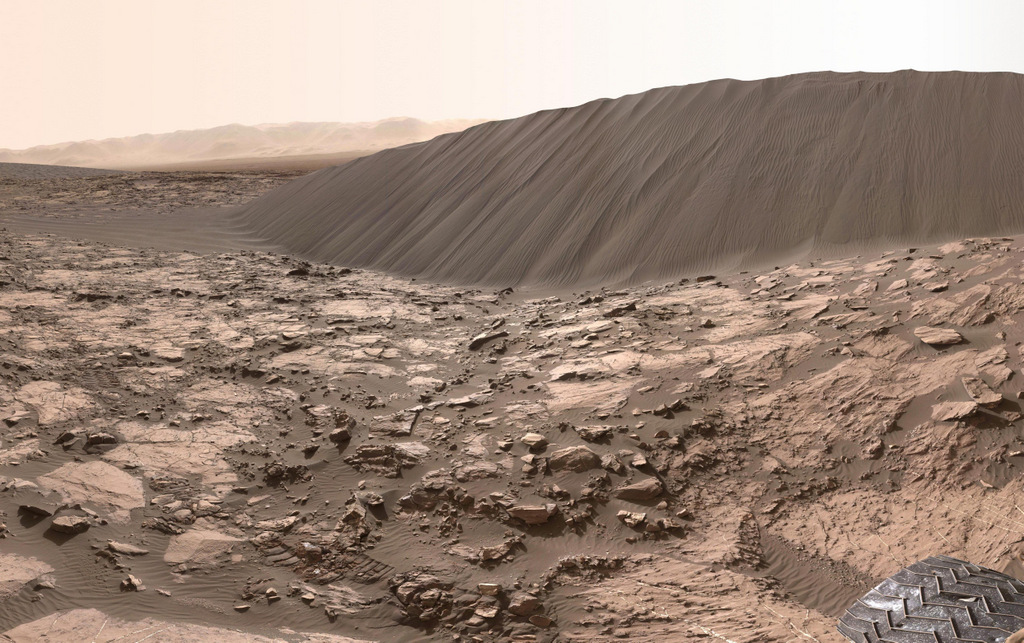
A 16-ft. (5 m) high sand dune on Mars called Namib Dune is part of the dark-sand ‘Bagnold Dunes’ field along the northwestern flank of Mount Sharp. Images taken from orbit indicate that dunes in the Bagnold field move as much as about 3 feet (1 m) per Earth year. This image is part of a 360 degree panorama taken by the Curiosity rover on Dec. 18, 2015 or the 1,197th Martian day, or sol, of the rover’s work on Mars. Credit: NASA/JPL-Caltech/MSSS.
Ashwin Vasavada grew up in California and has fond childhood memories of visiting state and national parks in the southwest United States with his family, playing among sand dunes and hiking in the mountains. He’s now able to do both on another planet, vicariously through Curiosity. The day I visited Vasavada at his office at JPL in early 2016, the rover was navigating through a field of giant sand dunes at the base of Mount Sharp, with some dunes towering 30 feet (9 meters) above the rover.
“It’s just fascinating to see dunes close up on another planet,” Vasavada said. “And the closer we get to the mountain, the more fantastic the geology gets. So much has gone on there, and we have so little understanding of it … as of yet.”
At the time we talked, Curiosity was approaching four Earth years on Mars. The rover is now studying those enticing sedimentary layers on Mt. Sharp in closer detail. But first, it needed to navigate through the “Bagnold Dunes” which form a barrier along the northwestern flank of the mountain. Here, Curiosity is doing what Vasavada calls “flyby science,” stopping briefly to sample and study the sand grains of the dunes while moving through the area as quickly as possible.
Now working as the lead Project Scientist for the mission, Vasavada plays an even larger role in coordinating the mission.
“It’s a constant balance of doing things quickly, carefully and efficiently, as well as using the instruments to their fullest,” he said.
Since the successful August 2012 landing, Curiosity has sent back tens of thousands of images from Mars – from expansive panoramas to extreme close-ups of rocks and sand grains, all of which are helping to tell the story of Mars’ past.
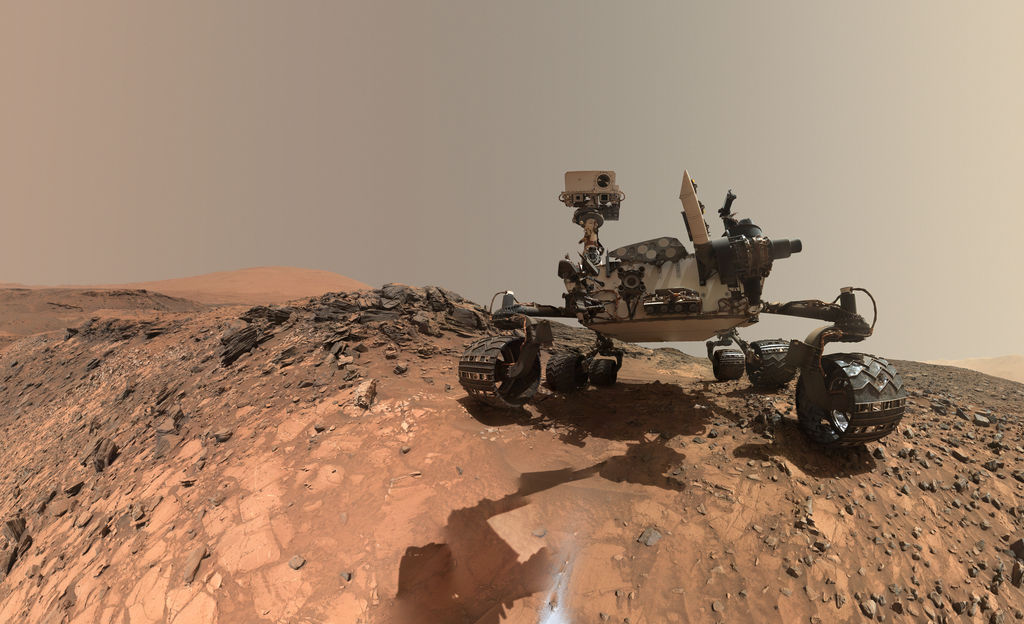
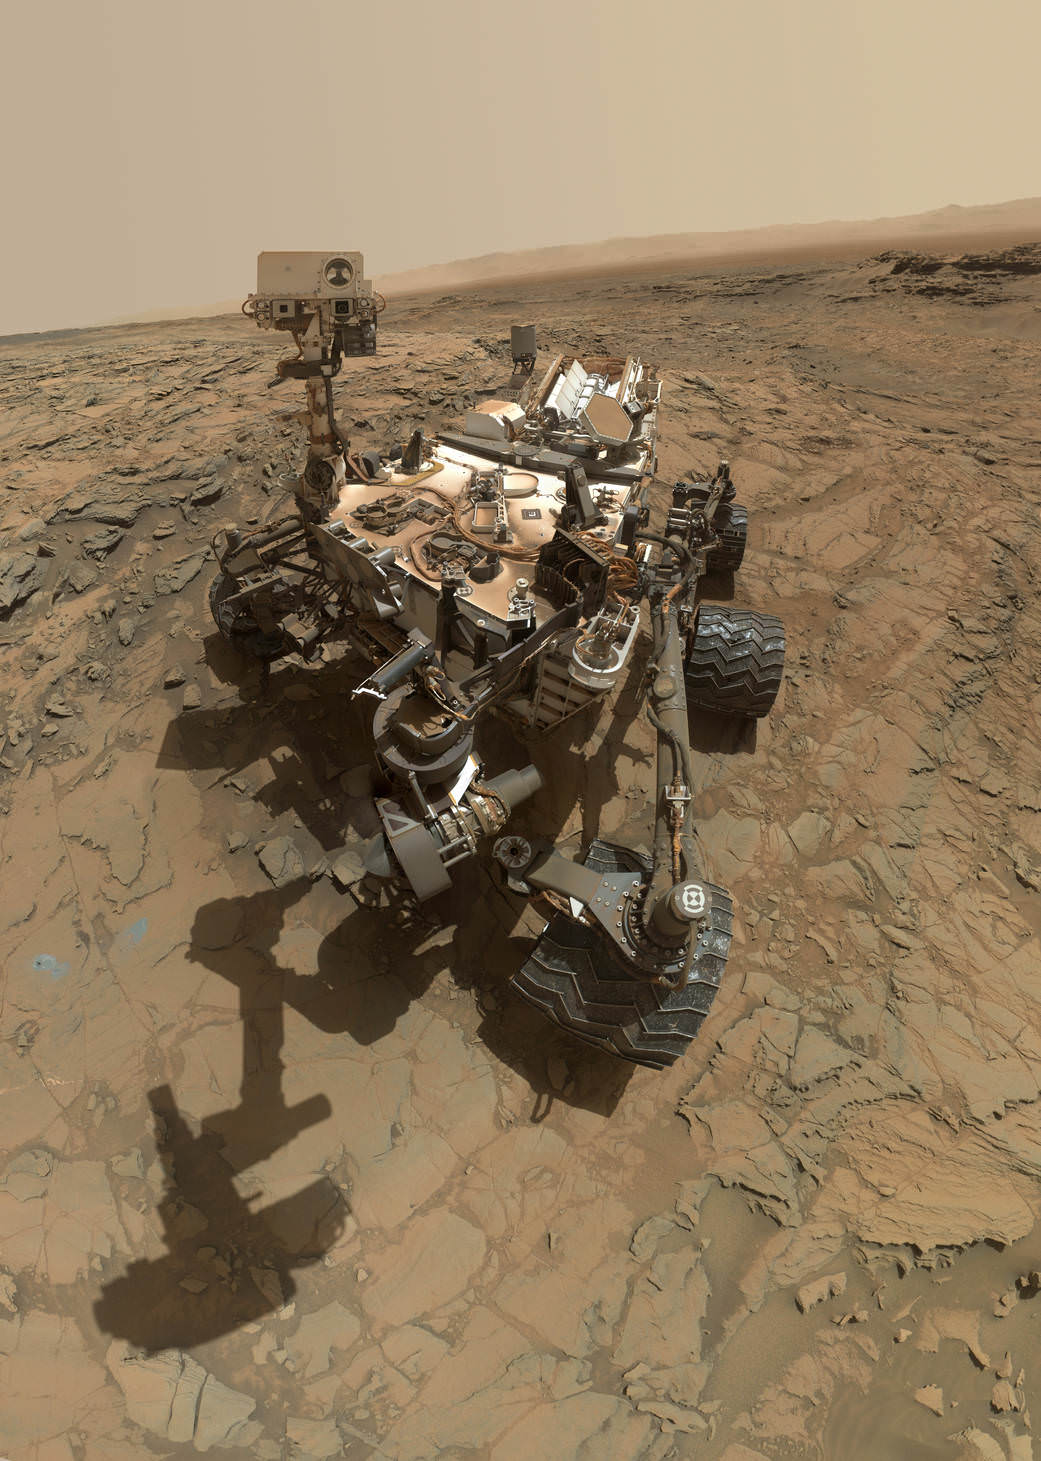
‘Selfies’ taken by the Curiosity rover are actually a mosaic created from numerous images taken with the Mars Hand Lens Imager (MAHLI), located on the end of the rover’s robotic arm. However, the arm is not shown in the selfies, because with the wrist motions and turret rotations used in pointing the camera for the component images, the arm was positioned out of the shot in the frames or portions of frames used in this mosaic. However, the shadow of the arm is visible on the ground. This low-angle selfie shows the vehicle at the site from which it reached down to drill into a rock target called “Buckskin” on lower Mount Sharp. Credit: NASA/JPL-Caltech/MSSS.
The images the public seems to love the most are the ‘selfies,’ the photos the rover takes of itself sitting on Mars. The selfies aren’t just a single image like the ones we take with our cell phones, but a mosaic created from dozens of separate images taken with the Mars Hand Lens Imager (MAHLI) camera at the end of the rover’s robotic arm. Other fan favorites are the pictures Curiosity takes of the magnificent Martian landscape, like a tourist documenting its journey.
Vasavada has a unique personal favorite.
“For me, the most meaningful picture from Curiosity really isn’t that great of an image,” he said, “but it was one of our first discoveries so it has an emotional tie to it.”
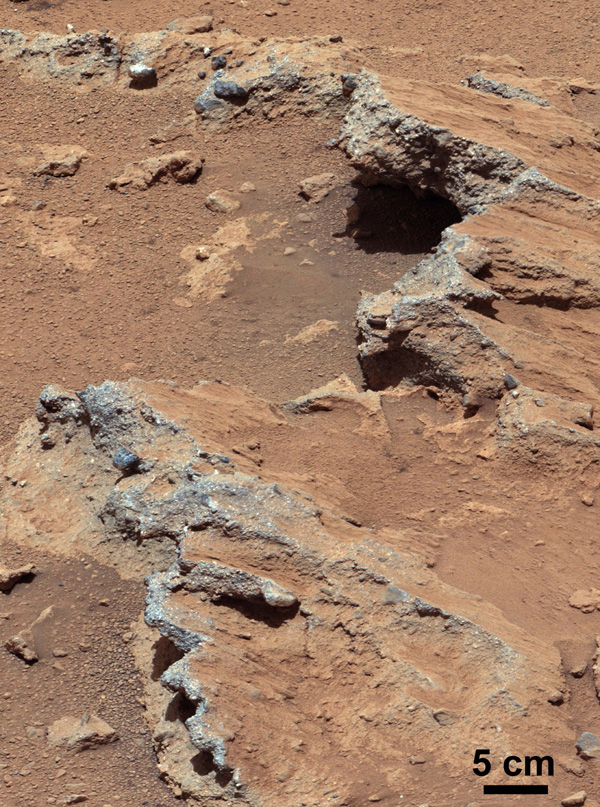
Within the first 50 sols, Curiosity took pictures of what geologists call conglomerates: a rock made of pebbles cemented together. But these were no ordinary pebbles — they were pebbles worn by flowing water. Serendipitously, the rover had found an ancient streambed where water once flowed vigorously. From the size of pebbles, the science team could interpret the water was moving about 3 feet (1 meter) per second, with a depth somewhere between a few inches to several feet. This geological feature on Mars is exposed bedrock made up of smaller fragments cemented together, or what geologists call a sedimentary conglomerate, and is evidence for an ancient, flowing stream. Some of embedded and loose gravel are round in shape, leading the Curiosity science team to conclude it were transported by a vigorous flow of water. Curiosity’s 100-millimeter Mastcam telephoto lens on its 39th sol of the mission (Sept. 14, 2012). Credit: NASA/JPL-Caltech/MSSS
“When you see this picture, and whether you are a gardener or geologist, you know what this means,” Vasasvada said excitedly. “At Home Depot, the rounded rock for landscaping are called river pebbles! It was mind-blowing to me to think that the rover was driving through a streambed. That picture really brought home there was actually water flowing here long ago, probably ankle to hip deep.”
Vasavada looked down. “It still gives me the shivers, just thinking about it,” he said, with his passion for exploration and discovery visibly evident.
From that early discovery, Curiosity continued to find more water-related evidence. The team took a calculated gamble and instead of driving straight towards Mt. Sharp, took a slight detour to the east to an area dubbed ‘Yellowknife Bay.’
“Yellowknife Bay was something we saw with the orbiters,” Vasavada explained, “and there appeared to be a debris fan fed by a river—evidence for flowing water in the ancient past.”
This map shows the route driven by NASA’s Curiosity Mars rover from the location where it landed in August 2012 to its location in September 2016 at “Murray Buttes,” and the path planned for reaching destinations at “Hematite Unit” and “Clay Unit” on lower Mount Sharp. Credits: NASA/JPL-Caltech/Univ. of Arizona
Here, Curiosity fulfilled ones of its main goals: determining whether Gale Crater ever was habitable for simple life forms. The answer was a resounding yes. The rover sampled two stone slabs with the drill, feeding half-baby-aspirin-sized portions to SAM, the onboard lab. SAM identified traces of elements like carbon, hydrogen, nitrogen, oxygen, and more —the basic building blocks of life. It also found sulfur compounds in different chemical forms, a possible energy source for microbes.
Data gathered by Curiosity’s other instruments constructed a portrait detailing how this site was once a muddy lakebed with mild – not acidic – water. Add in the essential elemental ingredients for life, and long ago, Yellowknife Bay would have been the perfect spot for living organisms to hang out. While this finding doesn’t necessarily mean there is past or present life on Mars, it shows the raw ingredients existed for life to get started there at one time, in a benign environment.
“Finding the habitable environment in Yellowknife Bay was wonderful because it really showed the capability our mission has to measure so many different things,” Vasavada said. “A wonderful picture came together of streams that flowed into a lake environment. This was exactly what we were sent there to find, but we didn’t think we’d find it that early in the mission.”
Still, this lakebed could have been created by a one-time event over just hundreds of years. The ‘jackpot’ would be to find evidence of long-term water and warmth.
That discovery took a little longer. But personally, it means more to Vasavada.
Mars’ climate was one of Vasavada’s early interests in his career and he spent years creating models, trying to understand Mars’ ancient history.
“I grew up with pictures of Mars from the Viking mission,” he said, “and thinking of it as a barren place with jagged volcanic rock and a bunch of sand. Then I had done all this theoretical work about Mars climate, that rivers and oceans perhaps once existed on Mars, but we had no real evidence.”
That’s why the discovery made by Curiosity in late 2015 is so exciting to Vasavada and his team.
“We didn’t just see the rounded pebbles and remnants of the muddy lake bottom at Yellowknife Bay, but all along the route,” Vasavada said. “We saw river pebbles first, then tilted sandstones where the river emptied into lakes. Then as we got to Mt. Sharp, we saw huge expanses of rock made of the silt that settled out from the lakes.”
The explanation that best fits the “morphology” in this region — that is, the configuration and evolution of rocks and land forms – is rivers formed deltas as they emptied into a lake. This likely occurred 3.8 to 3.3 billion years ago. And the rivers delivered sediment that slowly built up the lower layers of Mt. Sharp.
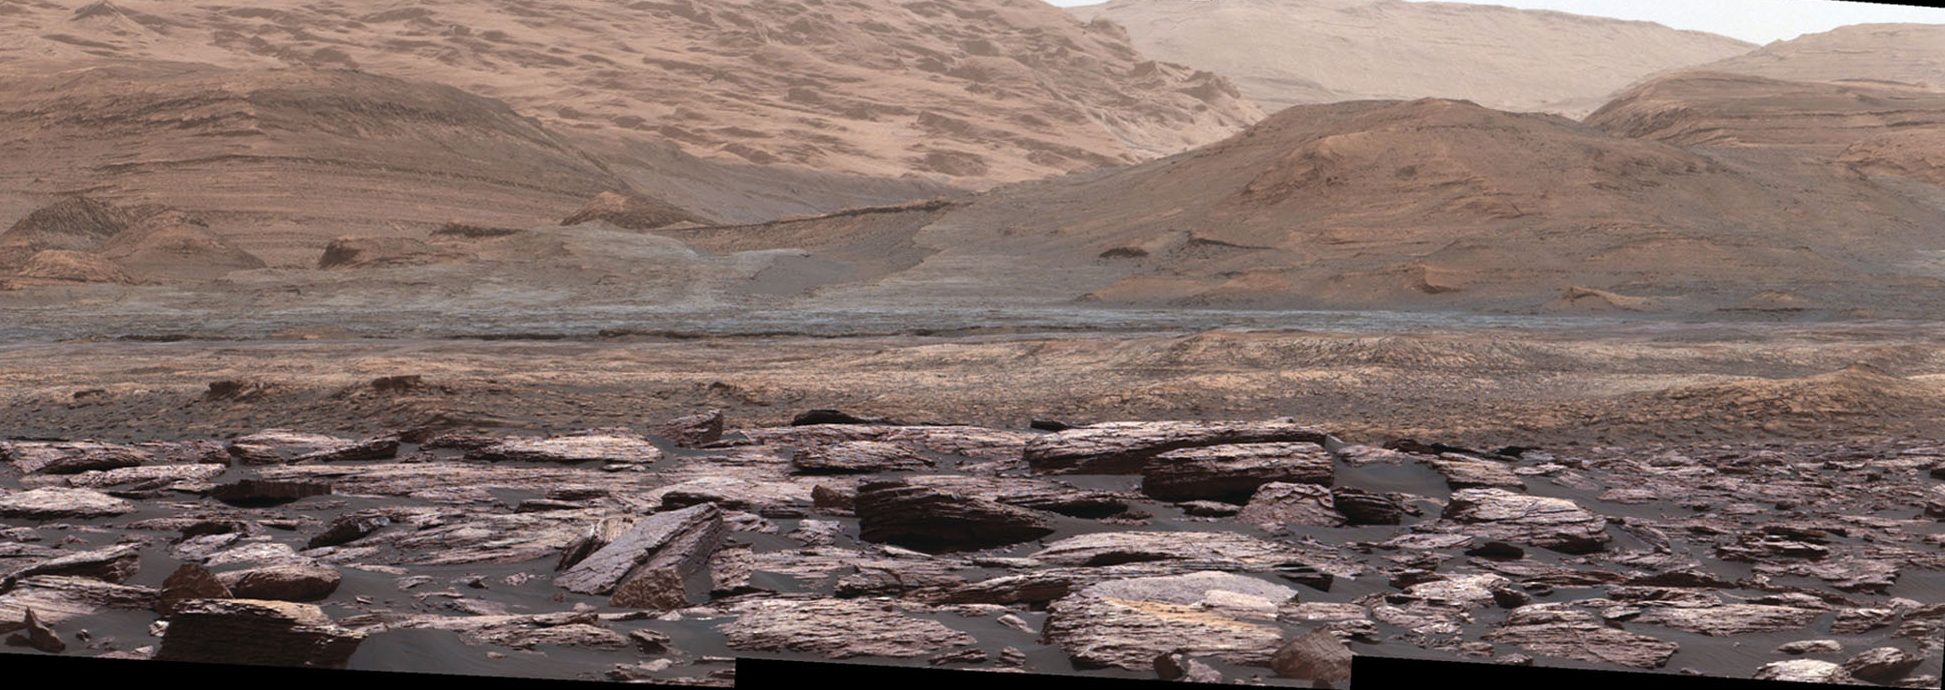
Curiosity picture showing the layers and color variations on Mount Sharp, Mars. Credit: NASA/JPL
“My gosh, we were seeing this full system now,” Vasavada explained, “showing how the entire lower few hundred meters of Mount Sharp were likely laid down by these river and lake sediments. That means this event didn’t take hundreds or thousands of years; it required millions of years for lakes and rivers to be present to slowly build up, millimeter by millimeter, the bottom of the mountain.”
For that, Mars also needed a thicker atmosphere than it has now, and a greenhouse gas composition that Vasavada said they haven’t quite figured out yet.
But then, somehow dramatic climate change caused the water to disappear and winds in the crater carved the mountain to its current shape.
The rover had landed in exactly the right place, because here in one area was a record of much of Mars’ environmental history, including evidence of a major shift in the planet’s climate, when the water that once covered Gale Crater with sediment dried up.
“This all is a significant driver now for what we need to explain about Mars’ early climate,” Vasavada said. “You don’t get millions of years of climate change from a single event like a meteor hit. This discovery has broad implications for the entire planet, not just Gale Crater.”
Other Discoveries
• Silica: The rover made a completely unanticipated discovery of high-content silica rocks as it approached Mt. Sharp. “This means that the rest of the normal elements that form rocks were stripped away, or that a lot of extra silica was added somehow,” Vasavada said, “both of which are very interesting, and very different from rocks we had seen before. It’s such a multifaceted and curious discovery, we’re going to take a while figuring it out.”
• Methane on Mars: Methane is usually a sign of activity involving organic matter — even, potentially, of life. On Earth, about 90 percent of atmospheric methane is produced from the breakdown of organic matter. On Mars, methane has been detected by other missions and telescopes over the years, but it was tenuous – the readings seemed to come and go, and are hard to verify. In 2014, the Tunable Laser Spectrometer within the SAM instrument observed a ten-fold increase in methane over a two-month period. What caused the brief and sudden increase? Curiosity will continue to monitor readings of methane, and hopefully provide an answer to the decades-long debate.
• Radiation Risks for Human Explorers: Both during her trip to Mars and on the surface, Curiosity measured the high-energy radiation from the Sun and space that poses a risk astronauts. NASA will use data from the Radiation Assessment Detector (RAD) instrument Curiosity’s data to design future missions to be safe for human explorers.
Tomorrow: The conclusion of this chapter, including ‘How To Drive a Mars Rover, and ‘The Beast.’ Part 1 is available here.
“Incredible Stories From Space: A Behind-the-Scenes Look at the Missions Changing Our View of the Cosmos” is published by Page Street Publishing, a subsidiary of Macmillan.
Artist's impression of a cloud of trapped antihydrogen atoms. Credit: CERN/Chukman So
Ever since the existence of antimatter was proposed in the early 20th century, scientists have sought to understand how relates to normal matter, and why there is an apparent imbalance between the two in the Universe. To do this, particle physics research in the past few decades has focused on the anti-particle of the most elementary and abundant atom in the Universe – the antihydrogen particle.
Until recently, this has been very difficult, as scientists have been able to produce antihydrogen, but unable to study it for long before it annihilated. But according to recent a study that was published in Nature, a team using the ALPHA experiment was able to obtain the first spectral information on antihydrogen. This achievement, which was 20 years in the making, could open up an entirely new era of research into antimatter.
Measuring how elements absorb or emit light – i.e. spectroscopy – is a major aspect of physics, chemistry and astronomy. Not only does it allow scientists to characterize atoms and molecules, it allows astrophysicists to determine the composition of distant stars by analyzing the spectrum of the light they emit.
The ALPHA experiment probes whether matter behaves differently from antimatter by measuring the antihydrogen spectrum with high-precision, further testing the robustness of the Standard Model. Credit: Maximilien Brice/CERN
In the past, many studies have been conducted into the spectrum of hydrogen, which constitutes roughly 75% of all baryonic mass in the Universe. These have played a vital role in our understanding of matter, energy, and the evolution of multiple scientific disciplines. But until recently, studying the spectrum of its anti-particle has been incredibly difficult.
For starters, it requires that the particles that constitute antihydrogen – antiprotons and positrons (anti-electrons) – be captured and cooled so that they may come together. In addition, it is then necessary to maintain these particles long enough to observe their behavior, before they inevitable make contact with normal matter and annihilate.
Luckily, technology has progressed in the past few decades to the point where research into antimatter is now possible, thus affording scientists the opportunity to deduce whether the physics behind antimatter are consistent with the Standard Model or go beyond it. As the CERN research team – which was led by Dr. Ahmadi of the Department of Physics at the University of Liverpool – indicated in their study:
“The Standard Model predicts that there should have been equal amounts of matter and antimatter in the primordial Universe after the Big Bang, but today’s Universe is observed to consist almost entirely of ordinary matter. This motivates physicists to carefully study antimatter, to see if there is a small asymmetry in the laws of physics that govern the two types of matter.”
ALPHA uses a magnetic trap to hold neutral atoms of antihydrogen and then subjecting them to spectrographic analysis. Credit: CERN
Beginning in 1996, this research was conducted using the AnTiHydrogEN Apparatus (ATHENA) experiment, a part of the CERN Antiproton Decelerator facility. This experiment was responsible for capturing antiprotons and positrons, then cooling them to the point where they can combine to form anithydrogen. Since 2005, this task has become the responsibility of ATHENA’s successor, the ALPHA experiment.
Using updated instruments, ALPHA captures atoms of neutral antihydrogen and holds them for a longer period before they inevitably annihilate During this time, research teams conduct spectrographic analysis using ALPHA’s ultraviolet laser to see if the atoms obey the same laws as hydrogen atoms. As Jeffrey Hangst, the spokesperson of the ALPHA collaboration, explained in a CERN update:
“Using a laser to observe a transition in antihydrogen and comparing it to hydrogen to see if they obey the same laws of physics has always been a key goal of antimatter research… Moving and trapping antiprotons or positrons is easy because they are charged particles. But when you combine the two you get neutral antihydrogen, which is far more difficult to trap, so we have designed a very special magnetic trap that relies on the fact that antihydrogen is a little bit magnetic.”
In so doing, the research team was able to measure the frequency of light needed to cause a positron to transition from its lowest energy level to the next. What they found was that (within experimental limits) there was no difference between the antihydrogen spectral data and that of hydrogen. These results are an experimental first, as they are the first spectral observations ever made of an antihydrogen atom.
Besides allowing for comparisons between matter and antimatter for the first time, these results show that antimatter’s behavior – vis a vis its spectrographic characteristics – are consistent with the Standard Model. Specifically, they are consistent with what is known as Charge-Parity-Time (CPT) symmetry.
This symmetry theory, which is fundamental to established physics, predicts that energy levels in matter and antimatter would be the same. As the team explained in their study:
“We have performed the first laser-spectroscopic measurement on an atom of antimatter. This has long been a sought-after achievement in low-energy antimatter physics. It marks a turning point from proof-of-principle experiments to serious metrology and precision CPT comparisons using the optical spectrum of an anti-atom. The current result… demonstrate that tests of fundamental symmetries with antimatter at the AD are maturing rapidly.”
In other words, the confirmation that matter and antimatter have similar spectral characteristics is yet another indication that the Standard Model holds up – just as the discovery of the Higgs Boson in 2012 did. It also demonstrated the effectiveness of the ALPHA experiment at trapping antimatter particles, which will have benefits other antihydrogen experiments.
Naturally, the CERN researchers were very excited by this find, and it is expected to have drastic implications. Beyond offering a new means of testing the Standard Model, it is also expected to go a long way towards helping scientists to understand why there is a matter-antimatter imbalance in the Universe. Yet another crucial step in discovering exactly how the Universe as we know it came to be.
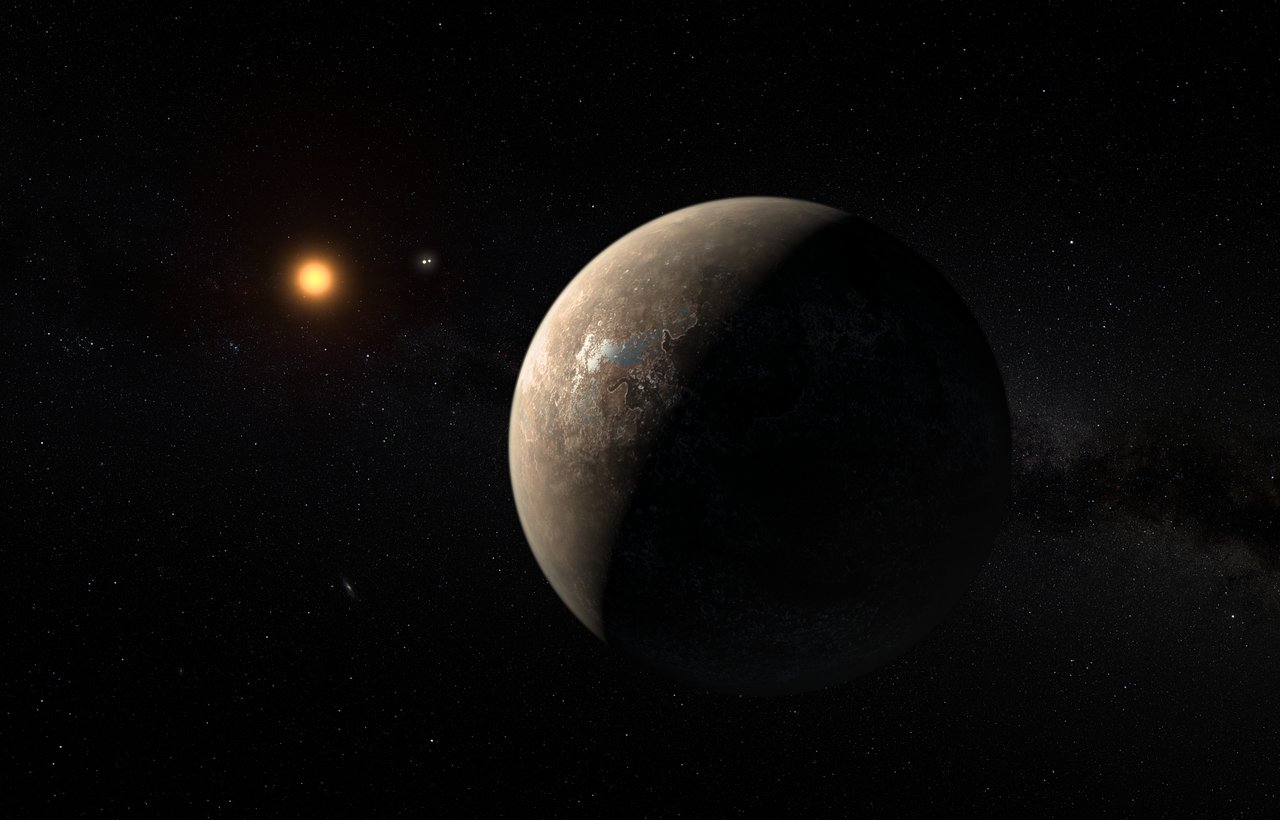
Artist’s impression of Proxima b, which was discovered using the Radial Velocity method. Credit: ESO/M. Kornmesser
Ever since the ESO announced the discovery of an extra-solar planet orbiting Proxima Centauri, scientists have been trying to determine what the conditions are like on this world. This has been especially important given the fact that while Proxima b orbits within the habitable zone of its sun, red dwarfs like Proxima Centauri are known to be somewhat inhospitable.
And while some research has cast doubt on the possibility that Proxima b could indeed support life, a new research study offers a more positive picture. The research comes from the Blue Marble Space Institute of Science (BMSIS) in Seattle, Washington, where astrobiologist Dimitra Atri has conducted simulations that show that Proxima b could indeed be habitable, assuming certain prerequisites were met.
Dr. Atri is a computational physicist whose work with the BMSIS includes the impacts of antiparticles and radiation on biological systems. For the sake of his study – “Modelling stellar proton event-induced particle radiation dose on close-in exoplanets“, which appeared recently in the Monthly Notices of the Royal Astronomical Society Letters – he conducted simulations to measure the impact stellar flares from its sun would have on Proxima b.
Artist’s impression of the surface of the planet Proxima b orbiting the red dwarf star Proxima Centauri. The double star Alpha Centauri AB is visible to the upper right of Proxima itself. Credit: ESO
To put this perspective, it is important to note how the Kepler mission has found a plethora of planets orbiting red dwarf stars in recent years, many of which are believed to be “Earth-like” and close enough to their suns to have liquid water on their surfaces. However, red dwarfs have a number of issues that do not bode well for habitability, which include their variable nature and the fact they are cooler and fainter than other classes of stars.
This means that any planet close enough to orbit within a red dwarf’s habitable zone would be subject to powerful solar flares – aka. Stellar Proton Events (SPEs) – and would likely be tidally-locked with the star. In other words, only one side would be getting the light and heat necessary to support life, but it would be exposed to a lot of solar protons, which would interact with its atmosphere to create harmful radiation.
As such, the astronomical community is interested in what kinds of conditions are there for planets like Proxima b so they might know if life has (or had) a shot at evolving there. For the sake of his study, Dr. Atri conducted a series of probability (aka. Monte Carlo) simulations that took into account three factors – the type and size of stellar flares, various thicknesses of the planet’s atmosphere and the strength of its magnetic field.
As Dr. Atri explained to Universe Today via email, the results were encouraging – as far as the implications for extra-terrestrial life are concerned:
“I used Monte Carlo simulations to study the radiation dose on the surface of the planet for different types of atmospheres and magnetic field configurations. The results are optimistic. If the planet has both a good magnetic field and a sizable atmosphere, the effects of stellar flares are insignificant even if the star is in an active phase.”
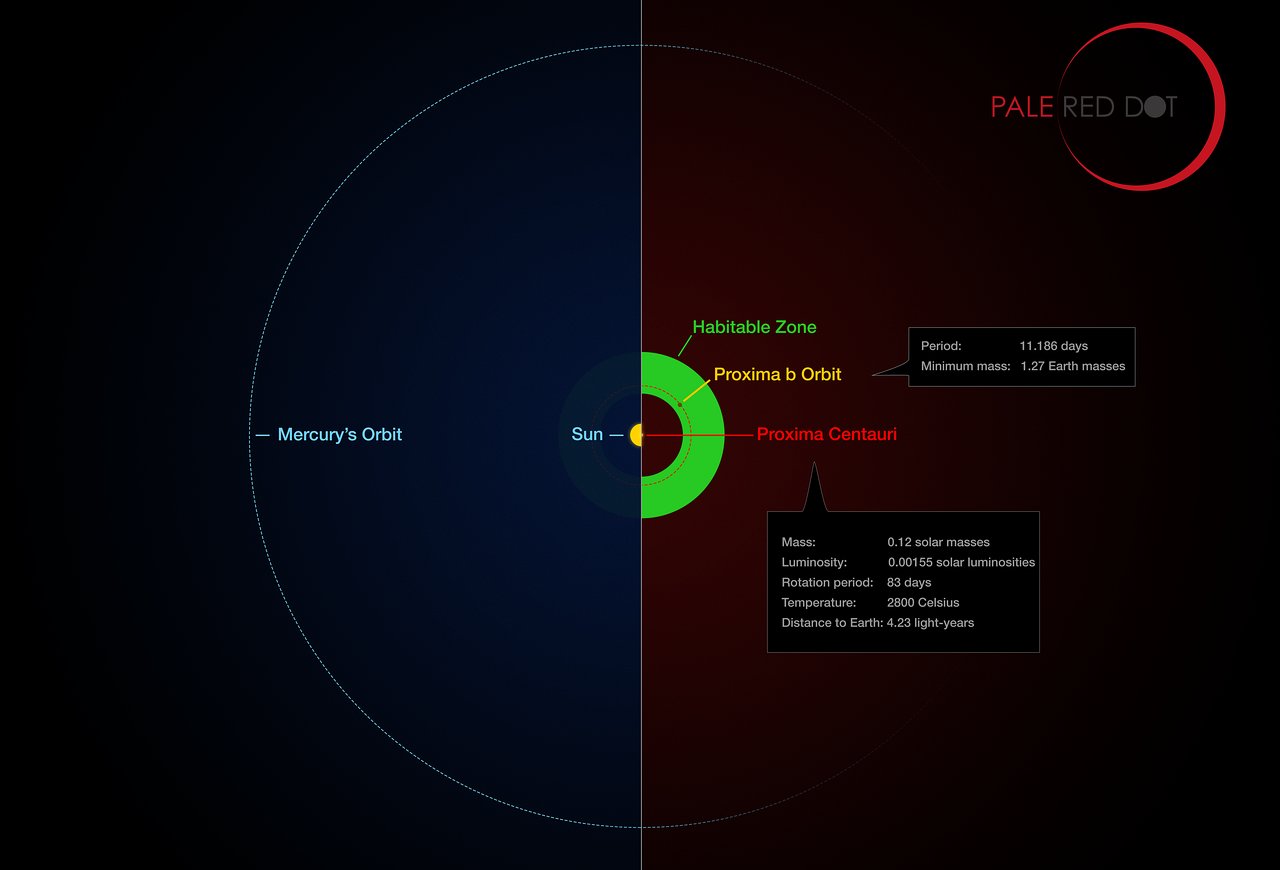
This infographic compares the orbit of the planet around Proxima Centauri (Proxima b) with the same region of the Solar System. Credit: ESO
In other words, Atri found that the existence of a strong magnetic field, which would also ensure that the planet has a viable atmosphere, would lead to survivable conditions. While the planet would still experience a spike in radiation whenever a superflare took place, life could survive on a planet like Proxima b in the long run. On the other hand, a weak atmosphere or magnetic field would foretell doom.
“If the planet does not have a significant magnetic field, chances of having any atmosphere and moderate temperatures are negligible,” he said. “The planet would be bombarded with extinction level superflares. Although in case of Proxima b, the star is in a stable condition and does not have violent flaring activity any more – past activity in its history would make the planet a hostile place for a biosphere to originate/evolve.”
History is the key word here, since red dwarf stars like Proxima Centauri have incredible longevity (as noted, up to 10 trillion years). According to some research, this makes red dwarf stars good candidates for finding habitable exoplanets, since it takes billions of years for complex life to evolve. But in order for life to be able to achieve complexity, planets need to maintain their atmospheres over these long periods of time.
Naturally, Atri admits that his study cannot definitively answer whether our closest exoplanet-neighbor is habitable, and that the debate on this is likely to continue for some time. “It is premature to think that Proxima b is habitable or otherwise,” he says. “We need more data about its atmosphere and the strength of its magnetic field.”
An artist’s depiction of planets transiting a red dwarf star in the TRAPPIST-1 System. Credit: NASA/ESA/STScl
In the future, missions like the James Webb Space Telescope should tell us more about this system, its planet, and the kinds of conditions that are prevalent there. By aiming its extremely precise suite of instruments at this neighboring star, it is sure to detect transits of the planet around this faint sun. One can only hope that it finds evidence of a dense atmosphere, which will hint at the presence of a magnetic field and life-supporting conditions.
Hope is another key word here. Not only would a habitable Proxima b be good news for those of us hoping to find life beyond Earth, it would also be good news as far as the existence of life throughout the Universe is concerned. Red dwarf stars make up 70% of the stars in spiral galaxies and more than 90% of all stars in elliptical galaxies. Knowing that even a fraction of these could support life greatly increases the odds of finding intelligence out there!
This self-portrait of NASA's Curiosity Mars rover shows the vehicle at the "Big Sky" site. Credit: NASA/JPL-Caltech/MSSS
Following is an excerpt from my new book, “Incredible Stories From Space: A Behind-the-Scenes Look at the Missions Changing Our View of the Cosmos,” which will be released tomorrow, Dec. 20, 2016. The book is an inside look at several current NASA robotic missions, and this excerpt is part 1 of 3 which will be posted here on Universe Today, of Chapter 2, “Roving Mars with Curiosity.” The book is available for order on Amazon and Barnes & Noble.
Seven Minutes of Terror
It takes approximately seven minutes for a moderate-sized spacecraft – such as a rover or a robotic lander — to descend through the atmosphere of Mars and reach the planet’s surface. During those short minutes, the spacecraft has to decelerate from its blazing incoming speed of about 13,000 mph (20,900 kph) to touch down at just 2 mph (3 kph) or less.
This requires a Rube Goldberg-like series of events to take place in perfect sequence, with precise choreography and timing. And it all needs to happen automatically via computer, with no input from anyone on Earth. There is no way to guide the spacecraft remotely from our planet, about 150 million miles (250 million km) away. At that distance, the radio signal delay time from Earth to Mars takes over 13 minutes. Therefore, by the time the seven-minute descent is finished, all those events have happened – or not happened – and no one on Earth knows which. Either your spacecraft sits magnificently on the surface of Mars or lies in a crashed heap.
A depiction of the numerous events required for the Curiosity rover to land successfully on Mars. Credit: NASA/JPL.
That’s why scientists and engineers from the missions to Mars call it “Seven Minutes of Terror.”
And with the Mars Science Laboratory (MSL) mission, which launched from Earth in November of 2011, the fear and trepidation about what is officially called the ‘Entry, Descent and Landing’ (EDL) increased exponentially. MSL features a 1-ton (900 kg), 6-wheeled rover named Curiosity, and this rover was going to use a brand new, untried landing system.
To date, all Mars landers and rovers have used — in order — a rocket-guided entry, a heat shield to protect and slow the vehicle, then a parachute, followed by thrusters to slow the vehicle even more. Curiosity would use this sequence as well. However, a final, crucial component encompassed one of the most complex landing devices ever flown.
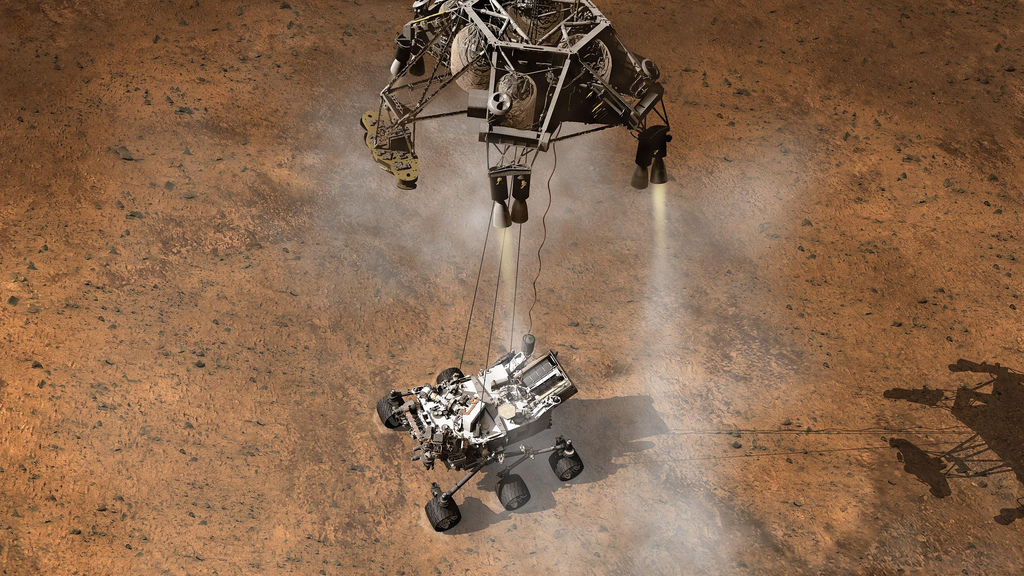
Artists concept of the moment the Curiosity rover touches down on the Martian surface, suspended on a bridle beneath the spacecraft’s descent stage. Credit: NASA/JPL-Caltech
Dubbed the “Sky Crane,” a hovering rocket stage would lower the rover on 66 ft. (20 meter) cables of Vectran rope like a rappelling mountaineer, with the rover soft-landing directly on its wheels. This all needed to be completed in a matter of seconds, and when the on-board computer sensed touchdown, pyrotechnics would sever the ropes, and the hovering descent stage would zoom away at full throttle to crash-land far from Curiosity.
Complicating matters even further, this rover was going to attempt the most precise off-world landing ever, setting down inside a crater next to a mountain the height of Mount Rainier.
A major part of the uncertainty was that engineers could never test the entire landing system all together, in sequence. And nothing could simulate the brutal atmospheric conditions and lighter gravity present on Mars except being on Mars itself. Since the real landing would be the first time the full-up Sky Crane would be used, there were questions: What if the cables didn’t separate? What if the descent stage kept descending right on top of the rover?
If the Sky Crane didn’t work, it would be game-over for a mission that had already overcome so much: technical problems, delays, cost overruns, and the wrath of critics who said this $2.5 billion Mars rover was bleeding money away from the rest of NASA’s planetary exploration program.
Mosaic of the Valles Marineris hemisphere of Mars, similar to what one would see from orbital distance of 2500 km. Credit: NASA/JPL-Caltech
Missions to Mars
With its red glow in the nighttime sky, Mars has beckoned skywatchers for centuries. As the closest planet to Earth that offers any potential for future human missions or colonization, it has been of great interest in the age of space exploration. To date, over 40 robotic missions have been launched to the Red Planet … or more precisely, 40-plus missions have been attempted.
Including all US, European, Soviet/Russian and Japanese efforts, more than half of Mars missions have failed, either because of a launch disaster, a malfunction en route to Mars, a botched attempt to slip into orbit, or a catastrophic landing. While recent missions have had greater success than our first pioneering attempts to explore Mars in situ (on location) space scientists and engineers are only partially kidding when they talk about things like a ‘Great Galactic Ghoul’ or the ‘Mars Curse’ messing up the missions.
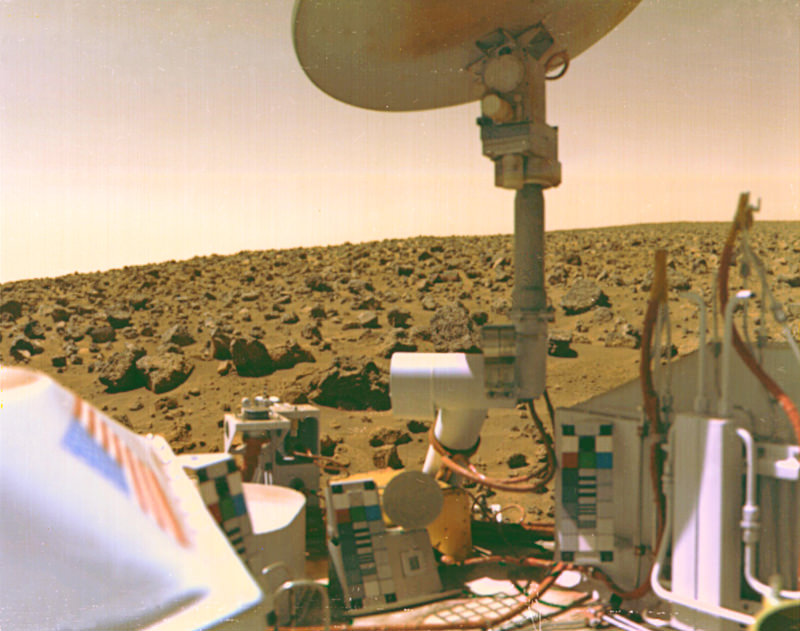
View of Mars from Viking 2 lander, September 1976. (NASA/JPL-Caltech)
But there have been wonderful successes, too. Early missions in the 1960’s and 70’s such as Mariner orbiters and Viking landers showed us a strikingly beautiful, although barren and rocky world, thereby dashing any hopes of ‘little green men’ as our planetary neighbors. But later missions revealed a dichotomy: magnificent desolation combined with tantalizing hints of past — or perhaps even present day – water and global activity.
Today, Mars’ surface is cold and dry, and its whisper-thin atmosphere doesn’t shield the planet from bombardment of radiation from the Sun. But indications are the conditions on Mars weren’t always this way. Visible from orbit are channels and intricate valley systems that appear to have been carved by flowing water.
For decades, planetary scientists have debated whether these features formed during brief, wet periods caused by cataclysmic events such as a massive asteroid strike or sudden climate calamity, or if they formed over millions of years when Mars may have been continuously warm and wet. Much of the evidence so far is ambiguous; these features could have formed either way. But billions of years ago, if there were rivers and oceans, just like on Earth, life might have taken hold.
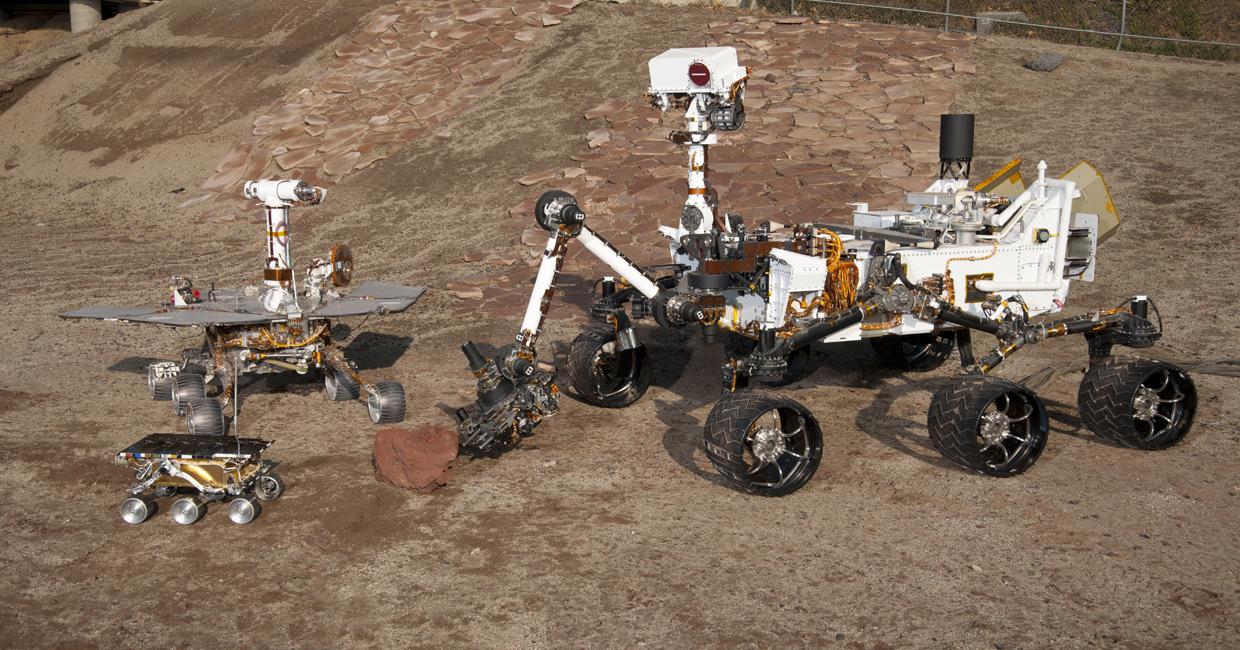
Three Generations of Mars Rovers in the ‘Mars Yard’ at the Jet Propulsion Laboratory. The Mars Pathfinder Project (front) landed the first Mars rover – Sojourner – in 1997. The Mars Exploration Rover Project (left) landed Spirit and Opportunity on Mars in 2004. The Mars Science Laboratory Curiosity rover landed on Mars in August 2012. Credit: NASA/JPL-Caltech.
The Rovers
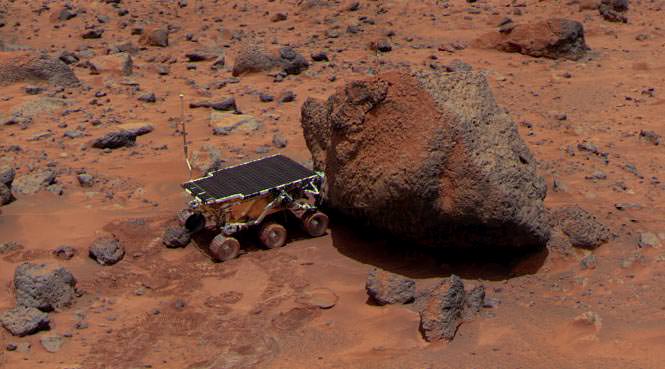
The Curiosity rover is the fourth mobile spacecraft NASA has sent to Mars’ surface. The first was a 23-pound (10.6 kg) rover named Sojourner that landed on a rock-covered Martian plain on July 4, 1997. About the size of a microwave oven, the 2-foot- (65 cm) long Sojourner never traversed more than 40 feet away from its lander and base station. The rover and lander together constituted the Pathfinder mission, which was expected to last about a week. Instead, it lasted nearly three months and the duo returned 2.6 gigabits of data, snapping more than 16,500 images from the lander and 550 images from the rover, as well as taking chemical measurements of rocks and soil and studying Mars’ atmosphere and weather. It identified traces of a warmer, wetter past for Mars.
Sojourner – NASA’s 1st Mars Rover. Rover takes an Alpha Proton X-ray Spectrometer (APXS) measurement of Yogi rock after Red Planet landing on July 4, 1997 landing. Credit: NASA
The mission took place when the Internet was just gaining popularity, and NASA decided to post pictures from the rover online as soon as they were beamed to Earth. This ended up being one of the biggest events in the young Internet’s history, with NASA’s website (and mirror sites set up for the high demand) receiving over 430 million hits in the first 20 days after landing.
Pathfinder, too, utilized an unusual landing system. Instead of using thrusters to touch down on the surface, engineers concocted a system of giant airbags to surround and protect the spacecraft. After using the conventional system of a rocket-guided entry, heat shield, parachutes and thrusters, the airbags inflated and the cocooned lander was dropped from 100 feet (30 m) above the ground. Bouncing several times across Mars’ surface times like a giant beach ball, Pathfinder eventually came to a stop, the airbags deflated and the lander opened up to allow the rover to emerge.
While that may sound like a crazy landing strategy, it worked so well that NASA decided to use larger versions of the airbags for the next rover mission: two identical rovers named Spirit and Opportunity. The Mars Exploration Rovers (MER) are about the size of a riding lawn mower, at 5.2 feet (1.6 meters) long, weighing about 400 lbs (185 kilograms). Spirit landed successfully near Mars’ equator on January 4, 2004, and three weeks later Opportunity bounced down on the other side of the planet. The goal of MER was to find evidence of past water on Mars, and both rovers hit the jackpot. Among many findings, Opportunity found ancient rock outcrops that were formed in flowing water and Spirit found unusual cauliflower-shaped silica rocks that scientists are still studying, but they may provide clues to potential ancient Martian life.
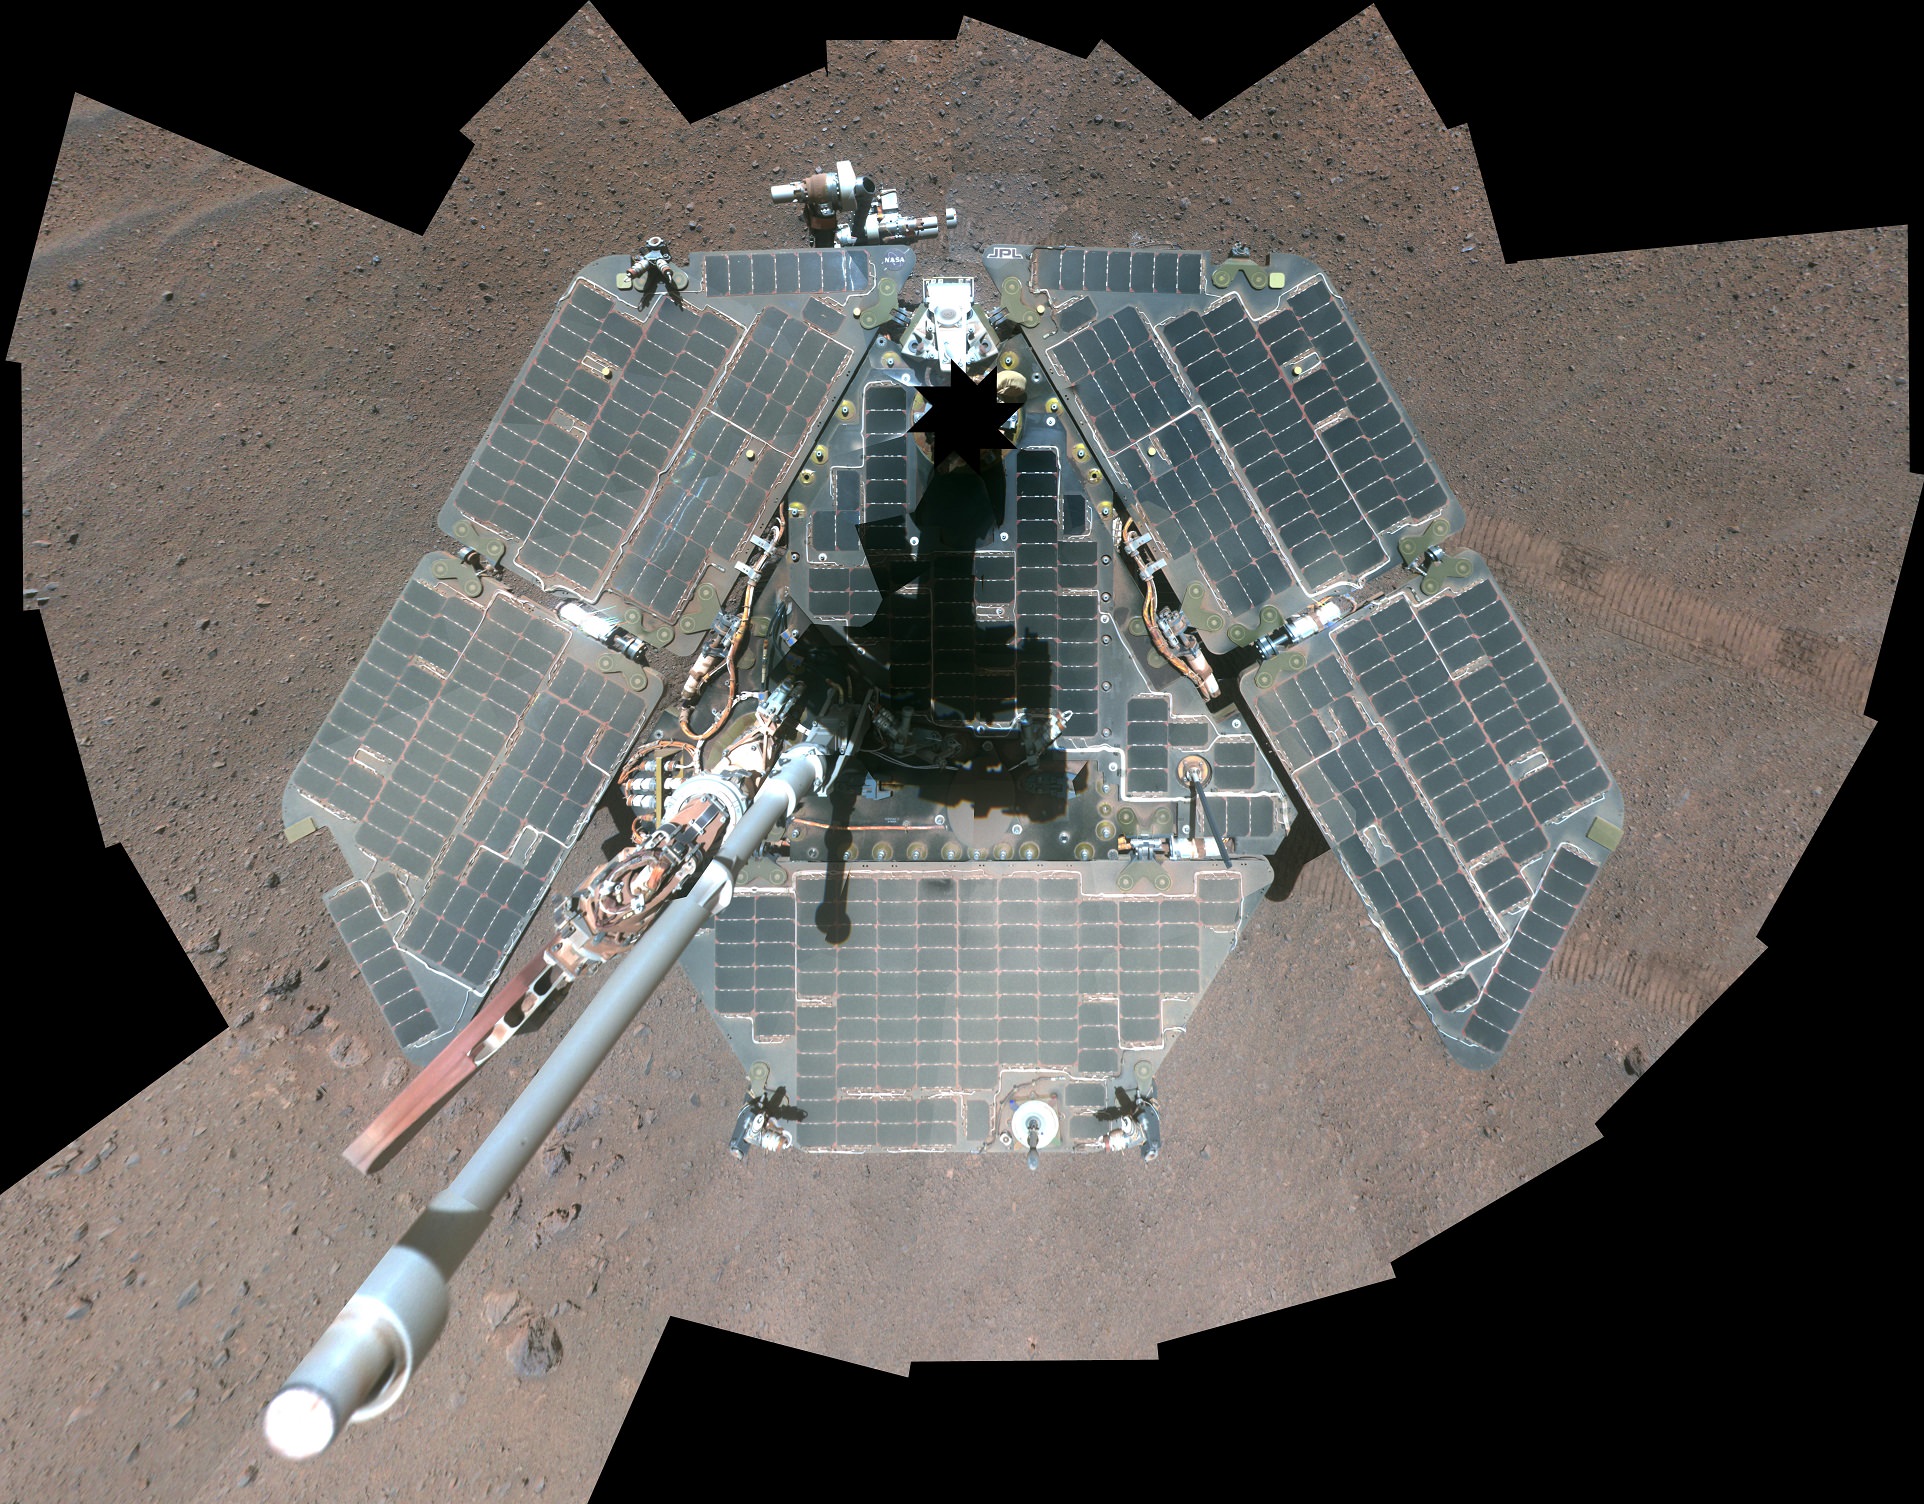
A self-portrait of the Opportunity rover shortly after dust cleared its solar panels in March 2014. Credit: NASA/JPL-Caltech/Cornell Univ./Arizona State Univ.Incredibly, at this writing (2016) the Opportunity rover is still operating, driving more than a marathon (26 miles/42 km) and it continues to explore Mars at a large crater named Endeavour. Spirit, however, succumbed to a loss of power during the cold Martian winter in 2010 after getting stuck in a sandtrap. The two rovers far outlived their projected 90-day lifetime.
Somehow, the rovers each developed a distinct ‘personality’ – or, perhaps a better way to phrase it is that people assigned personalities to the robots. Spirit was a problem child and drama queen but had to struggle for every discovery; Opportunity, a privileged younger sister, and star performer, as new findings seemed to come easy for her. Spirit and Opportunity weren’t designed to be adorable, but the charming rovers captured the imaginations of children and seasoned space veterans alike. MER project manager John Callas once called the twin rovers “the cutest darn things out in the Solar System.” As the long-lived, plucky rovers overcame hazards and perils, they sent postcards from Mars every day. And Earthlings loved them for it.
Curiosity
While it’s long been on our space to-do list, we haven’t quite yet figured out how to send humans to Mars. We need bigger and more advanced rockets and spacecraft, better technology for things like life support and growing our own food, and we really don’t have the ability to land the very large payloads needed to create a human settlement on Mars.
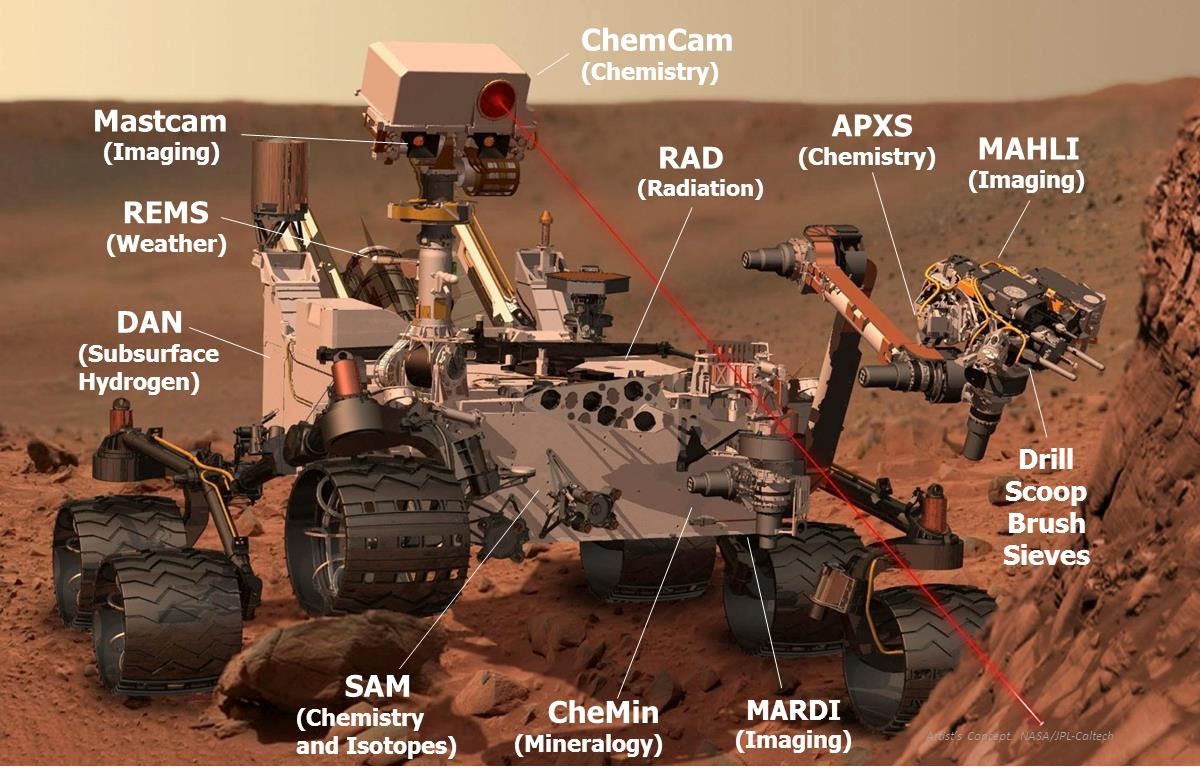
But in the meantime – while we try to figure all that out — we have sent the robotic equivalent of a human geologist to the Red Planet. The car-sized Curiosity rover is armed with an array of seventeen cameras, a drill, a scoop, a hand lens, and even a laser. These tools resemble equipment geologists use to study rocks and minerals on Earth. Additionally, this rover mimics human activity by mountain climbing, eating (figuratively speaking), flexing its (robotic) arm, and taking selfies.
Artist concept of the Curiosity rover, with the various science instruments labeled. Credit: NASA/JPL.
This roving robotic geologist is also a mobile chemistry lab. A total of ten instruments on the rover help search for organic carbon that might indicate the raw material required by life, and “sniff” the Martian air, trying to smell if gasses like methane — which could be a sign of life — are present. Curiosity’s robotic arm carries a Swiss Army knife of gadgets: a magnifying lens-like camera, a spectrometer to measure chemical elements, and a drill to bore inside rocks and feed samples to the laboratories named SAM (Sample Analysis at Mars) and) and CheMin (Chemistry and Mineralogy). The ChemCam laser can vaporize rock from up to 23 feet (7 meters) away, and identify the minerals from the spectrum of light emitted from the blasted rock. A weather station and radiation monitor round out the devices on board.
With these cameras and instruments, the rover becomes the eyes and hands for an international team of about 500 earthbound scientists.
While the previous Mars rovers used solar arrays to gather sunlight for power, Curiosity uses an RTG like New Horizons. The electricity generated from the RTG repeatedly powers rechargeable lithium-ion batteries, and the RTG’s heat is also piped into the rover chassis to keep the interior electronics warm.
With Curiosity’s size and weight, the airbag landing system used by the previous rovers was out of the question. As NASA engineer Rob Manning explained, “You can’t bounce something that big.” The Sky Crane is an audacious solution.
Curiosity’s mission: figure out how Mars evolved over billions of years and determine if it once was — or even now is — capable of supporting microbial life.
Curiosity’s target for exploration: a 3.4 mile (5.5 km) -high Mars mountain scientists call Mt. Sharp (formally known as Aeolis Mons) that sits in the middle of Gale Crater, a 96-mile (155-km) diameter impact basin.
Gale was chosen from 60 candidate sites. Data from orbiting spacecraft determined the mountain has dozens of layers of sedimentary rock, perhaps built over millions of years. These layers could tell the story of Mars’ geologic and climate history. Additionally, both the mountain and the crater appear to have channels and other features that look like they were carved by flowing water.
The plan: MSL would land in a lower, flatter part of the crater and carefully work its way upward towards the mountain, studying each layer, essentially taking a tour of the epochs of Mars’ geologic history.
The hardest part would be getting there. And the MSL team only had one chance to get it right.
Landing Night
Curiosity’s landing on August 5, 2012 was one of the most anticipated space exploration events in recent history. Millions of people watched events unfold online and on TV, with social media feeds buzzing with updates. NASA TV’s feed from JPL’s mission control was broadcast live on the screens in New York’s Time Square and at venues around the world hosting ‘landing parties.’
But the epicenter of action was at JPL, where hundreds of engineers, scientists and NASA officials gathered at JPL’s Space Flight Operations Facility. The EDL team – all wearing matching light blue polo shirts — monitored computer consoles at mission control.
Two members of the team stood out: EDL team lead Adam Steltzner — who wears his hair in an Elvis-like pompadour — paced back and forth between the rows of consoles. Flight Director Bobak Ferdowski sported and an elaborate stars and stripes Mohawk. Obviously, in the twenty-first century, exotic hairdos have replaced the 1960’s black glasses and pocket protectors for NASA engineers.
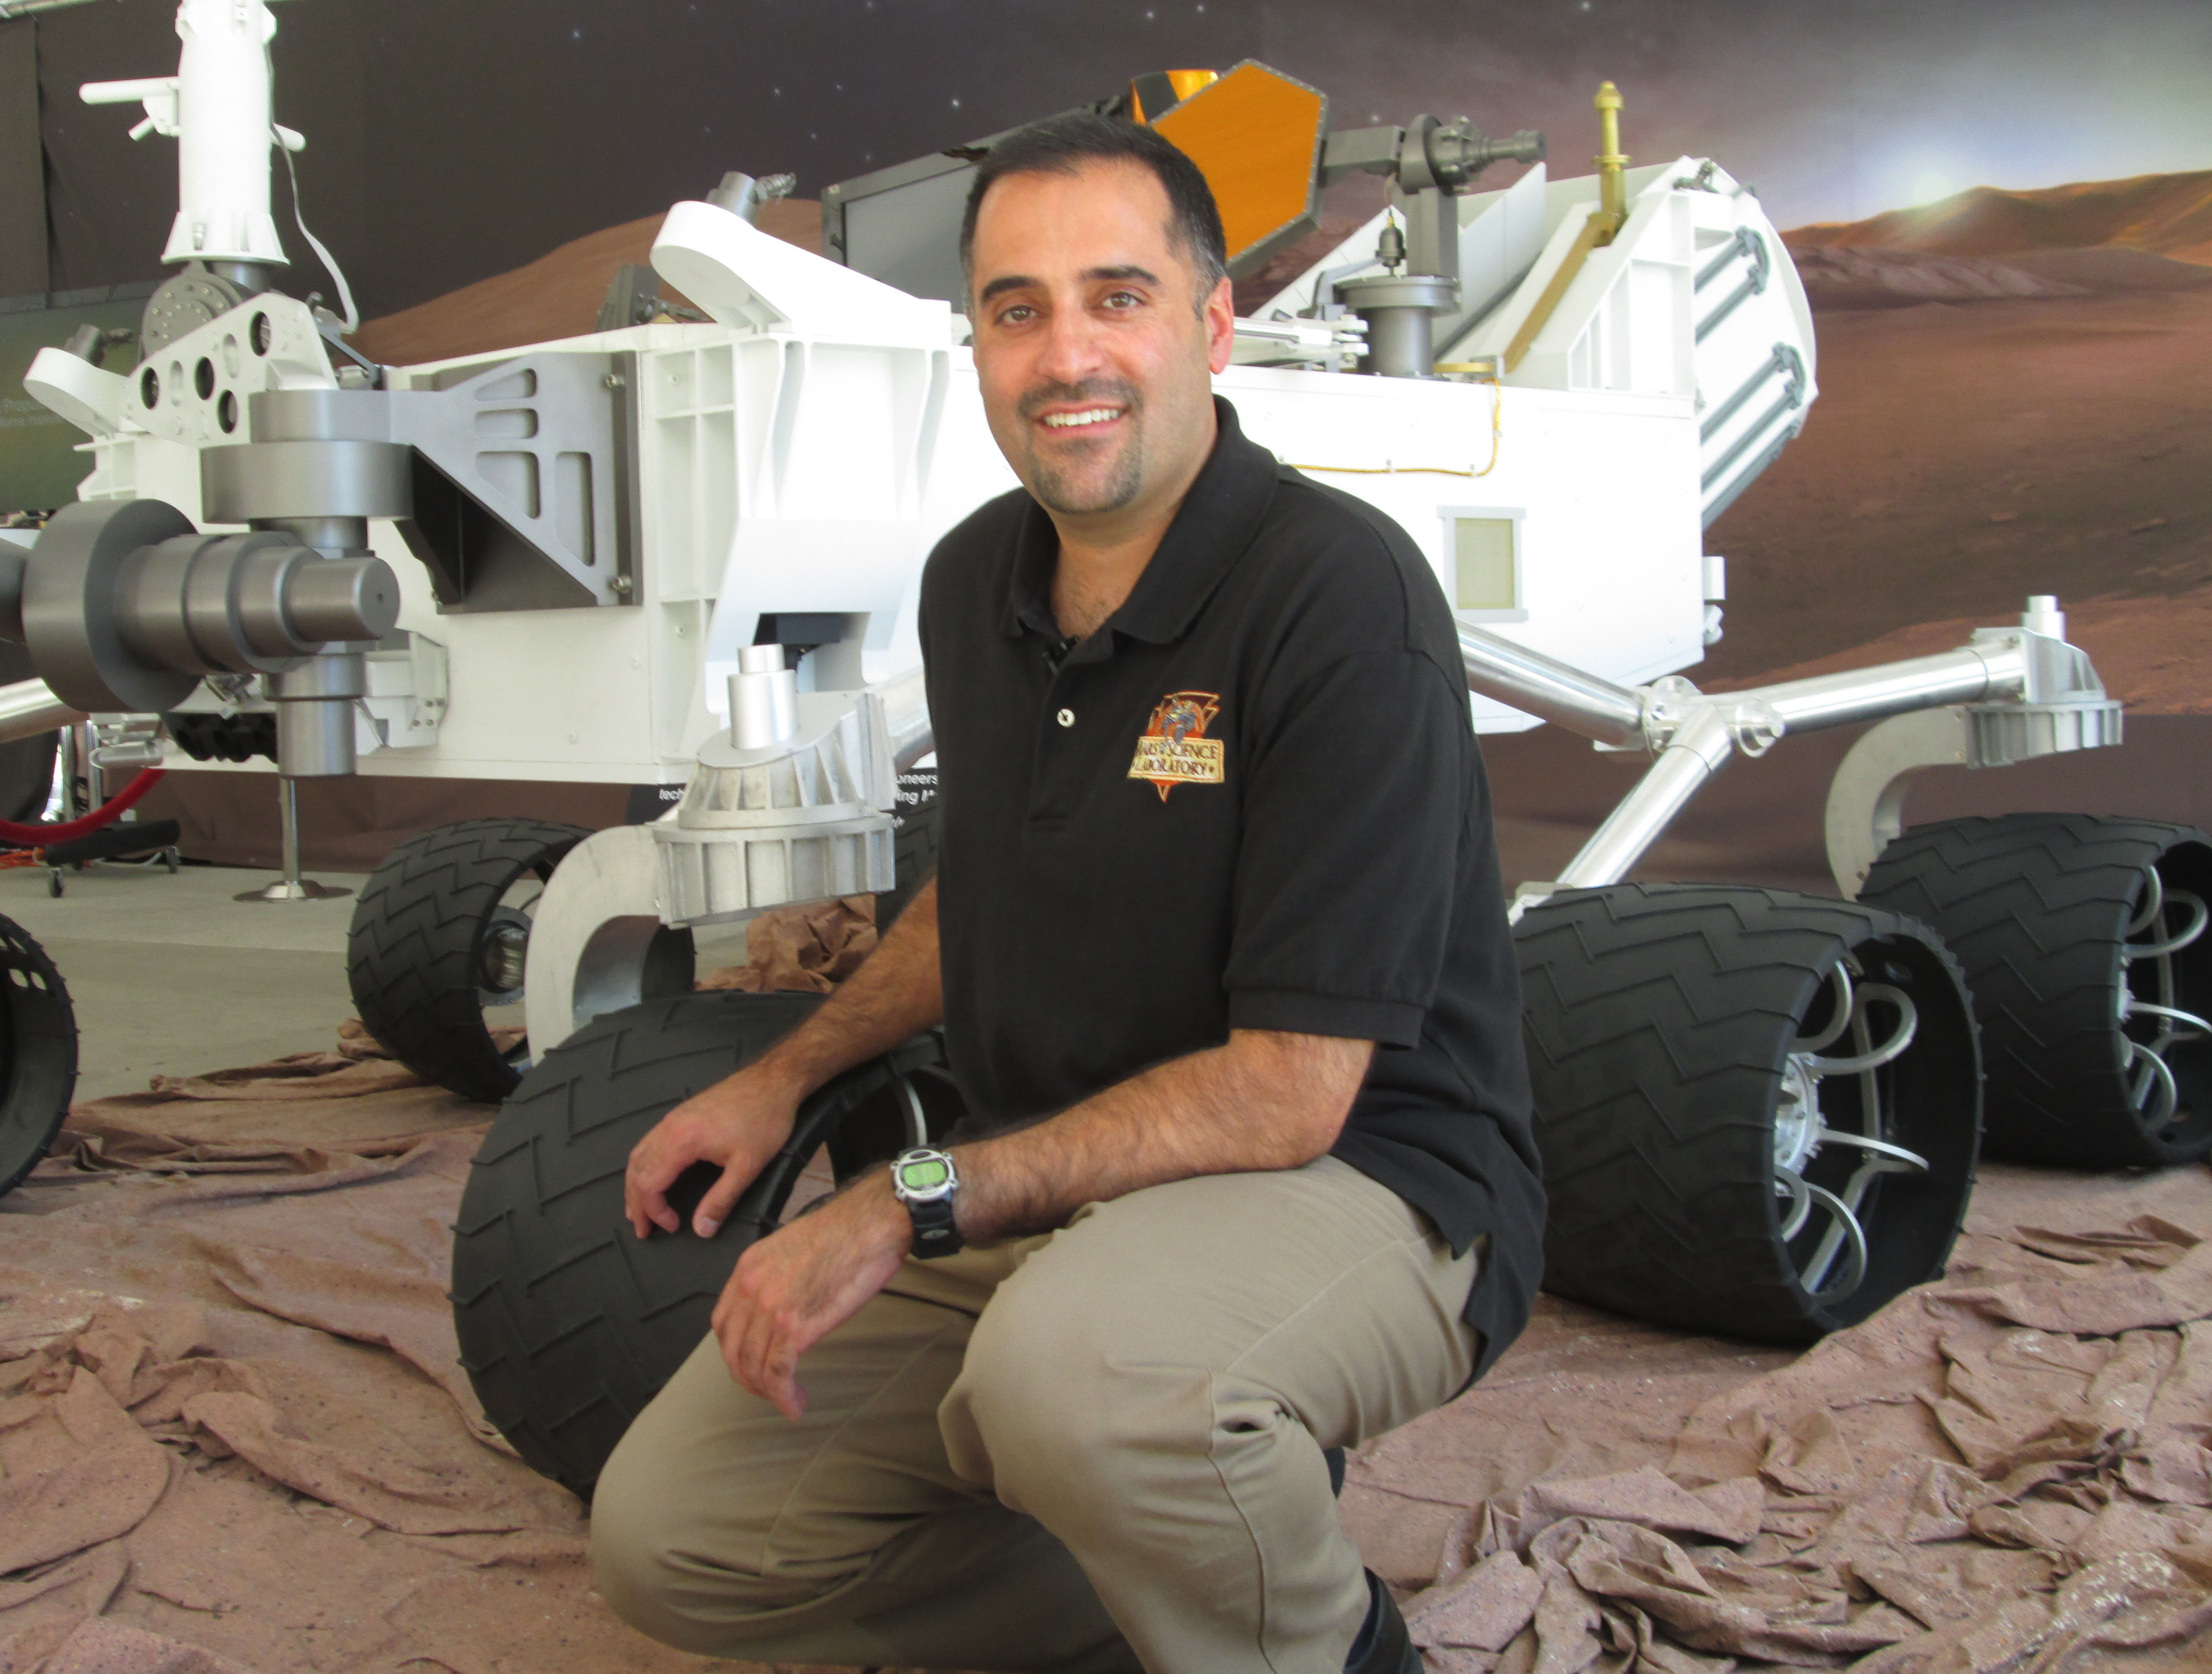
MSL project scientist Ashwin Vasavada with a full scale model of the Curiosity rover. Credit: NASA/JPL.
At the time of the landing, Ashwin Vasavada was one of the longest serving scientists on the mission team, having joined MSL as the Deputy Project Scientist in 2004 when the rover was under construction. Back then, a big part of Vasavada’s job was working with the instrument teams to finalize the objectives of their instruments, and supervise technical teams to help develop the instruments and integrate them with the rover.
Each of the ten selected instruments brought a team of scientists, so with engineers, additional staff and students, there were hundreds of people getting the rover ready for launch. Vasavada helped coordinate every decision and modification that might affect the eventual science done on Mars. During the landing, however, all he could do was watch.
“I was in the room next door to the control room that was being shown on TV,” Vasavada said. “For the landing there was nothing I could do except realize the past eight years of my life and my entire future was all riding on that seven minutes of EDL.”
Plus, the fact that no would know the real fate of the rover until 13 minutes after the fact due to the radio delay time led to a feeling of helplessness for everyone at JPL.
“Although I was sitting in a chair,” Vasavada added, “I think I was mentally curled up in the fetal position.”
As Curiosity sped closer to Mars, three other veteran spacecraft already orbiting the planet moved into position to be able to keep an eye on the newcomer MSL as it transmitted information on its status. At first, MSL communicated directly to the Deep Space Network (DSN) antennas on Earth.
To make telemetry from the spacecraft as streamlined as possible during EDL, Curiosity sent out 128 simple but distinct tones indicating when steps in the landing process were activated. Allen Chen, an engineer in the control room announced each as they came: one sound indicated the spacecraft entered Mars’ atmosphere; another signaled the thrusters fired, guiding the spacecraft towards Gale Crater. Tentative clapping and smiles came from the team at Mission Control at the early tones, with emotions increasing as the spacecraft moved closer and closer to the surface.
Partway through the descent, MSL went below the Martian horizon, putting it out of communication with Earth. But the three orbiters — Mars Odyssey, Mars Reconnaissance Orbiter and Mars Express — were ready to capture, record and relay data to the DSN.
Scenes from landing night for the Curiosity rover at JPL’s Space Flight Operations Facility. Credit: NASA/JPL.
Seamlessly, the tones kept coming to Earth as each step of the landing continued flawlessly. The parachute deployed. The heat shield dropped away. A tone signaled the descent stage carrying the rover let go of the parachute, another indicated powered flight and descent toward the surface. Another tone meant the Sky Crane began lowering the rover to the surface.
A tone arrived, indicating Curiosity’s wheels touched the surface, but even that didn’t mean success. The team had to make sure the Sky Crane flyaway maneuver worked.
Then, came the tone they were waiting for: “Touchdown confirmed,” cheered Chen. “We’re safe on Mars!”
Pandemonium and joy erupted in JPL’s mission control, at the landing party sites, and on social media. It seemed the world celebrated together at that moment. Cost overruns, delays, all the negative things ever said about the MSL mission seemed to vanish with the triumph of landing.
“Welcome to Mars!” the Director of the Jet Propulsion Laboratory, Charles Elachi said at a press conference following the dramatic touchdown, “Tonight we landed, tomorrow we start exploring Mars. Our Curiosity has no limits.”
Curiosity’s Twitter feed announced its arrival on Mars on August 5, 2012. Credit: Twitter.
“The seven minutes actually went really fast,” said Vasavada. “It was over before we knew it. Then everybody was jumping up and down, even though most of us were still processing that it went so successfully.”
That the landing went so well — indeed perfectly — may have actually shocked some of the team at JPL. While they had rehearsed Curiosity’s landing several times, remarkably, they were never able to land the vehicle in their simulations.
“We tried to rehearse it very accurately,” Vasavada said, “so that everything was in synch — both the telemetry that we had simulated that would be coming from the spacecraft, along with real-time animations that had been created. It was a pretty complex thing, but it never actually worked. So the real, actual landing was the first time everything worked right.”
Curiosity was programmed to immediately take pictures of its surroundings. Within two minutes of the landing, the first images were beamed to Earth and popped up on the viewing screens at JPL.
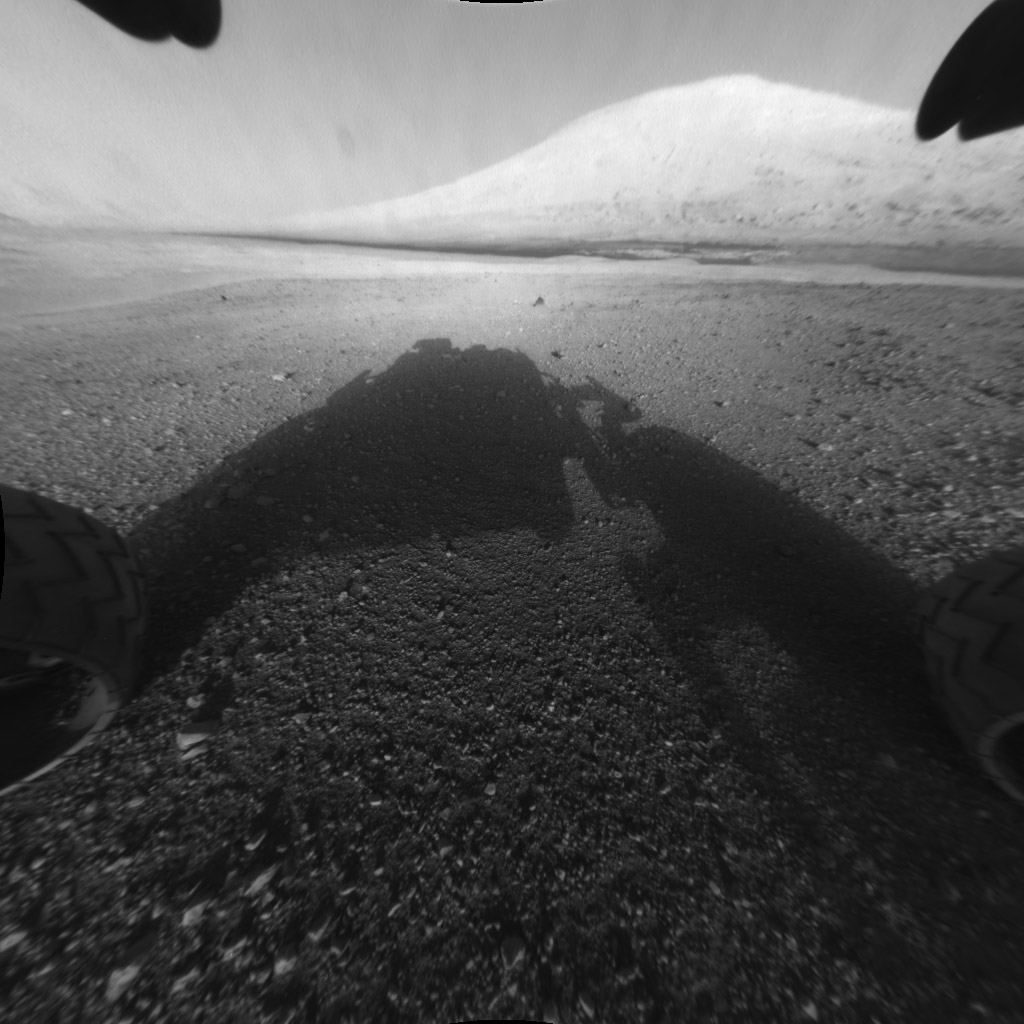
“We had timed the orbiters to fly over during the landing, but didn’t know for sure if their relay link would last long enough to get the initial pictures down,” Vasavada said. “Those first pictures were fairly ratty because the protective covers were still on the cameras and the thrusters had kicked up a lot of dust on the covers. We couldn’t really see it very well but we still jumped up and down nevertheless because these were pictures from Mars.”
Amazingly, one of the first pictures showed exactly what the rover had been sent to study.
“We had landed with the cameras basically facing directly at Mt. Sharp,” Vasavada said, shaking his head. “In the HazCam (hazard camera) image, right between the wheels, we had this gorgeous shot. There was the mountain. It was like a preview of the whole mission, right in front of us.”
An image captured by the Curiosity rover shortly after it landed on the Red Planet on August 5, 2015, showing the rover’s main science target, Mount Sharp. The rover’s shadow can be seen in the foreground and the dark band beyond are dunes. Credit; NASA/JPL-Caltech.
Tomorrow: Part 2 of “Roving Mars With Curiosity,” with ‘Living on Mars Time’ and ‘Discoveries’
“Incredible Stories From Space: A Behind-the-Scenes Look at the Missions Changing Our View of the Cosmos” is published by Page Street Publishing, a subsidiary of Macmillan.
Fiery blastoff of a United Launch Alliance (ULA) Atlas V rocket carrying the EchoStar XIX satellite from Space Launch Complex-41 on Cape Canaveral Air Force Station, Fl., at 2:13 p.m. EST on Dec. 18, 2016. Credit: Ken Kremer/kenkremer.com
Fiery blastoff of a United Launch Alliance (ULA) Atlas V rocket carrying the EchoStar XIX satellite from Space Launch Complex-41 on Cape Canaveral Air Force Station, Fl., at 2:13 p.m. EST on Dec. 18, 2016. Credit: Ken Kremer/kenkremer.com
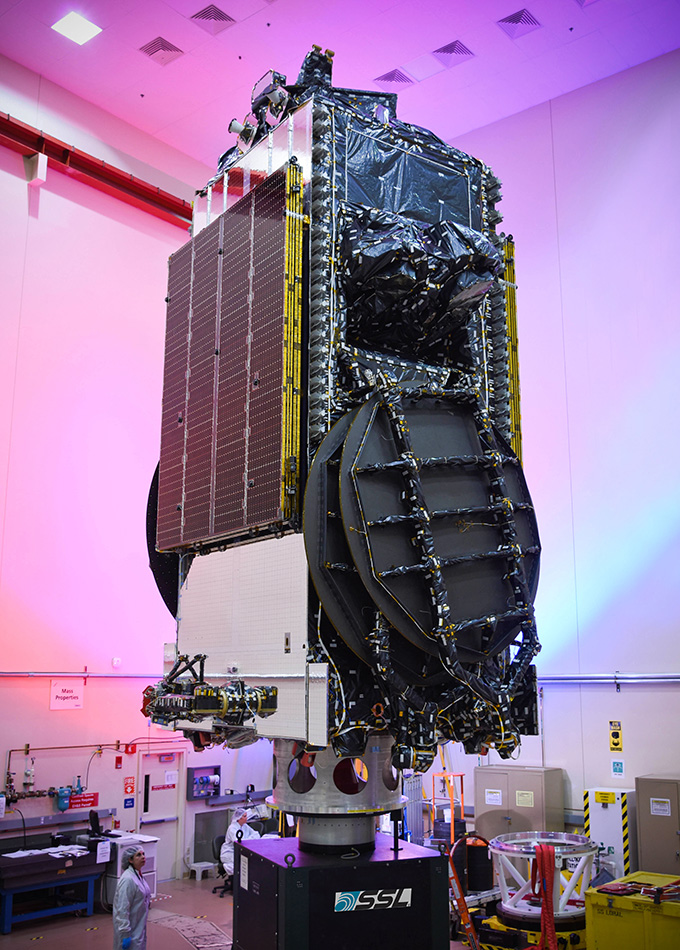
The 15,000 pound satellite will also delight American home and business subscribers users of HughesNet® – who should soon see dramatic improvements in speed and capability promised by satellite builder Space Systems Loral (SSL).
With the fiery blastoff of a United Launch Alliance (ULA) Atlas V rocket, EchoStar XIX – the world’s highest capacity broadband satellite – roared to space off Space Launch Complex-41 on Cape Canaveral Air Force Station, Fl., at 2:13 p.m. EST on Sunday, Dec. 18, 2016.
“EchoStar XIX will dramatically increase capacity for HughesNet® high-speed satellite Internet service to homes and businesses in North America,” according to ULA.
“EchoStar XIX will be the world’s highest capacity broadband satellite in orbit.”
Also known as Jupiter 2, it will deliver more speed, more data and more advanced features to consumers and small businesses from coast to coast, says EchoStar.
Liftoff on the sunny Florida afternoon was delayed some 45 minutes to deal with a technical anomaly that cropped up during the final moments of the countdown with launch originally slated for 1:27 p.m. EST.
Incoming bad weather threatened to delay the blastoff but held off until dark clouds and rains showers hit the Cape about half an hour after the eventual launch at 2:13 p.m.
EchoStar 19 is based on the powerful SSL 1300 platform as a multi-spot beam Ka-band satellite.
It is upgraded from the prior series version.
“Building from their experience on the highly successful EchoStar XVII broadband satellite, SSL and Hughes collaboratively engineered the specific design details of this payload for optimum performance.”
EchoStar 19 was delivered to a geosynchronous transfer orbit (GTO). It will be stationed at 97.1 degrees West longitude.
Fiery blastoff of a United Launch Alliance (ULA) Atlas V rocket carrying the EchoStar XIX satellite from Space Launch Complex-41 on Cape Canaveral Air Force Station, Fl., at 2:13 p.m. EST on Dec. 18, 2016. Credit: Ken Kremer/kenkremer.com
EchoStar 19 was ULA’s final mission of 2016, ending another year of 100% success rates stretching back to the company’s founding back in 2006, as a joint venture of Boeing and Lockheed Martin.
This is ULA’s 12th and last launch in 2016 and the 115th successful launch since December 2006.
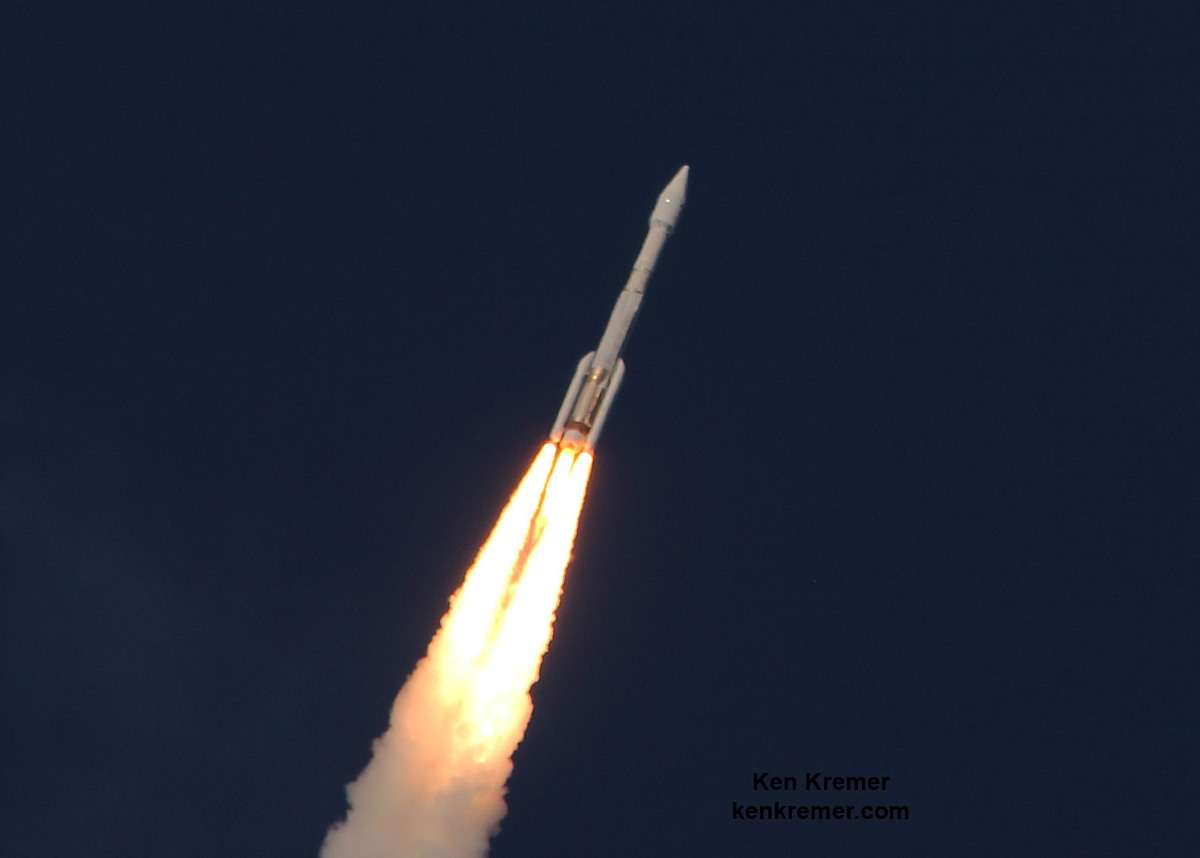
United Launch Alliance (ULA) Atlas V rocket streaks to orbit carrying EchoStar XIX satellite after lift off from Space Launch Complex-41 on Cape Canaveral Air Force Station, Fl., at 2:13 p.m. EST on Dec. 18, 2016. Credit: Ken Kremer/kenkremer.com
“ULA is honored to have been entrusted with the launch of the EchoStar XIX satellite,” said Gary Wentz, ULA vice president of Human and Commercial Systems, in a statement.
“We truly believe that our success is only made possible by the phenomenal teamwork of our employees, customers and industry partners.”
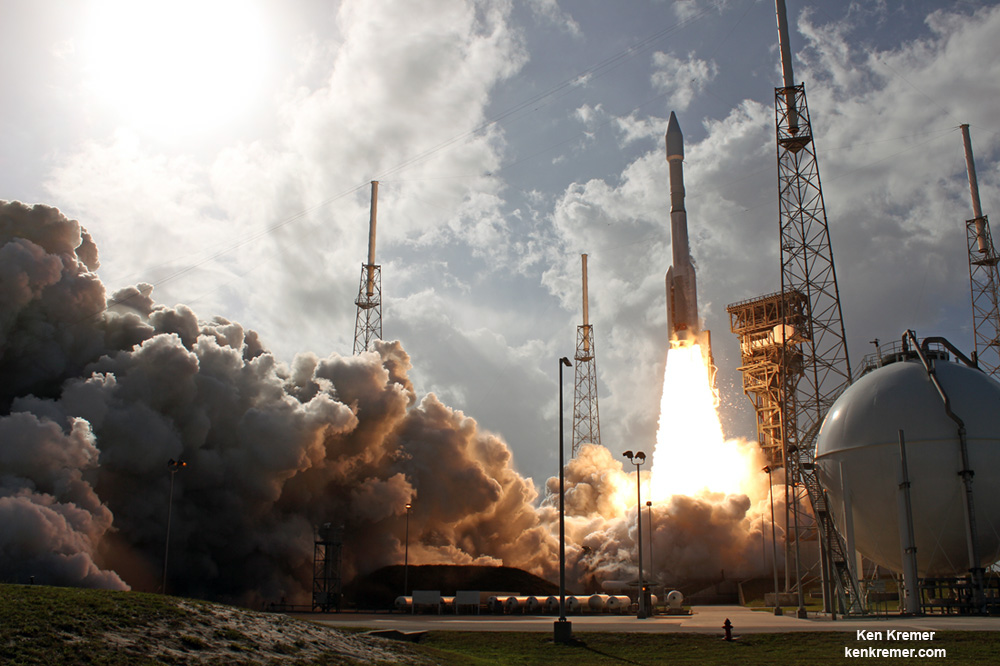
Ignition and liftoff of United Launch Alliance (ULA) Atlas V rocket delivering EchoStar 19 satellite to orbit from Space Launch Complex-41 on Cape Canaveral Air Force Station, Fl., at 2:13 p.m. EST on Dec. 18, 2016. Credit: Ken Kremer/kenkremer.com
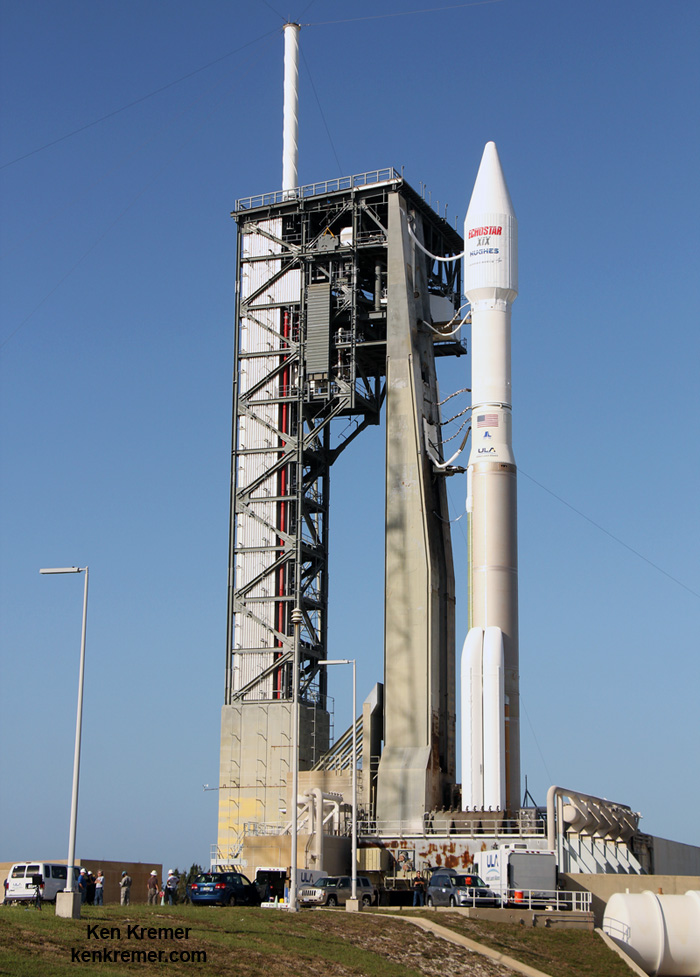
The 194-foot-tall commercial Atlas V booster launched in the 431 rocket configuration with approximately 2 million pounds of first stage thrust. This is the 3rd launch of the 431 configuration – all delivered commercial communications satellites to orbit.
Three solid rocket motors are attached to the Atlas booster to augment the first stage powered by the dual nozzle RD AMROSS RD-180 engine.
The satellite is housed inside a 4-meter diameter extra extended payload fairing (XEPF). The Centaur upper stage was powered by the Aerojet Rocketdyne RL10C engine.
“As we celebrate 10 years, ULA continues to be the nation’s premier launch provider because of our unmatched reliability and mission success,” Wentz elaborated.
“The Atlas V continues to provide the optimum performance to precisely deliver a range of missions. As we move into our second decade, we will maintain our ongoing focus on mission success, one launch at a time even as we transform the space industry, making space more accessible, affordable and commercialized.”
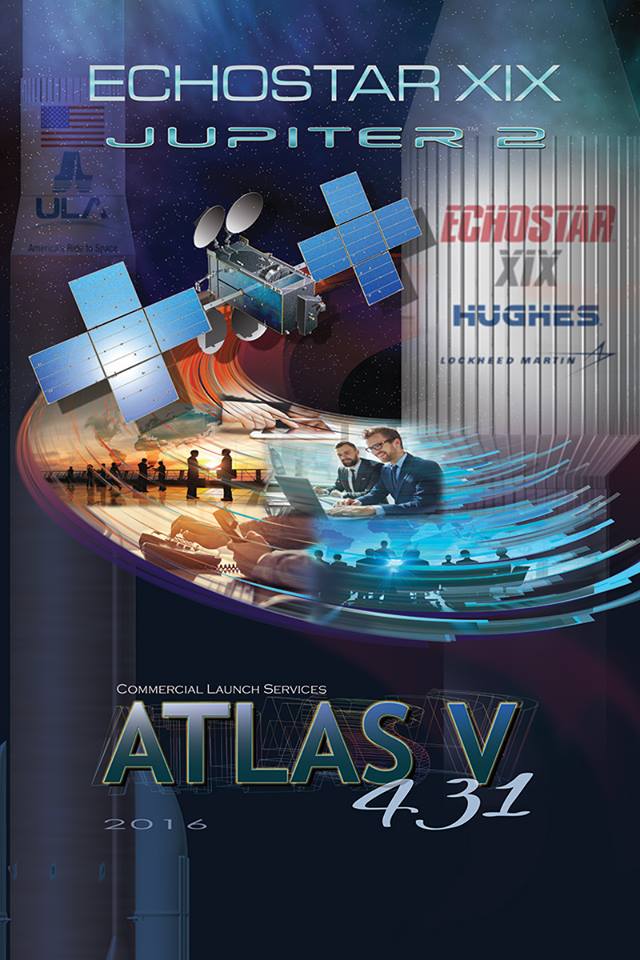
Artwork for ULA Atlas V launch of EchoStar 19 high speed Internet satellite on Dec. 18, 2016 from Canaveral Air Force Station, Florida. Credit: ULA
“Congratulations to ULA and the entire integrated team who ensured the success of our last launch capping off what has been a very busy year,” said Col. Walt Jackim, 45th Space Wing vice commander and mission Launch Decision Authority.
“This mission once again clearly demonstrates the successful collaboration we have with our mission partners as we continue to shape the future of America’s space operations and showcase why the 45th Space Wing is the ‘World’s Premiere Gateway to Space.'”
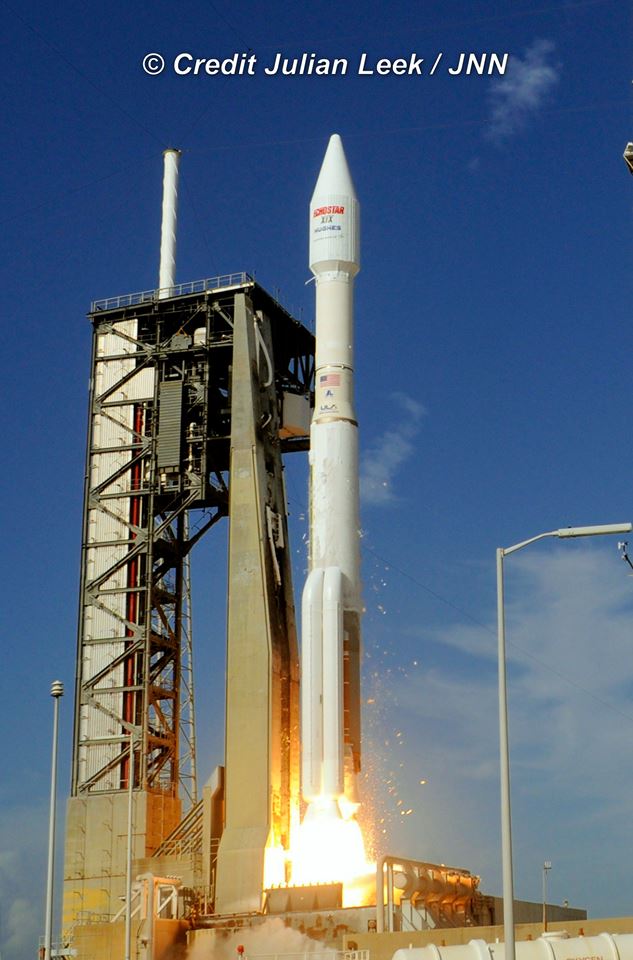
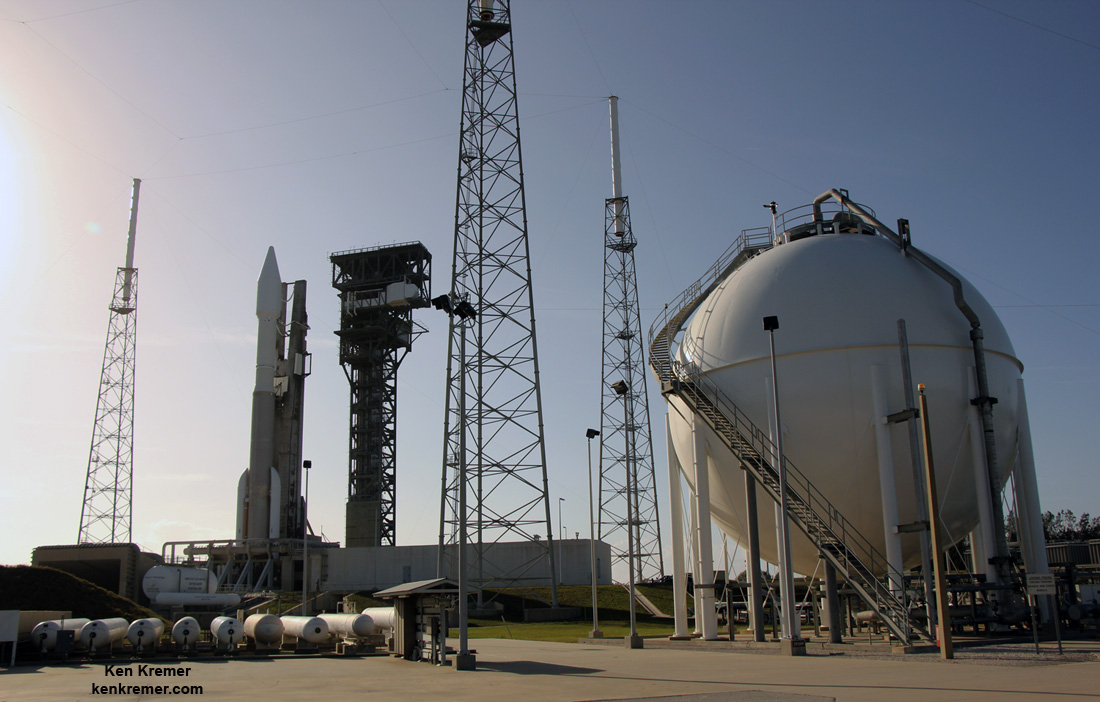
A ULA Atlas V rocket carrying the EchoStar 19 high speed internet satellite is poised for blastoff from Space Launch Complex-41 at Cape Canaveral Air Force Station in Florida on Dec. 18, 2016. Credit: Ken Kremer/kenkremer.com
Stay tuned here for Ken’s continuing Earth and Planetary science and human spaceflight news.
ULA Atlas V rocket carrying the EchoStar 19 high speed internet satellite is poised for blastoff from Space Launch Complex-41 at Cape Canaveral Air Force Station in Florida on Dec. 18, 2016. Credit: Ken Kremer/kenkremer.com
A ULA Atlas V rocket carrying the EchoStar 19 high speed internet satellite is poised for blastoff from Space Launch Complex-41 at Cape Canaveral Air Force Station in Florida on Dec. 18, 2016. Credit: Ken Kremer/kenkremer.com
A ULA Atlas V rocket carrying the EchoStar 19 high speed internet satellite is poised for blastoff from Space Launch Complex-41 at Cape Canaveral Air Force Station in Florida on Dec. 18, 2016. Credit: Ken Kremer/kenkremer.com
CAPE CANAVERAL AIR FORCE STATION, FL – The highest capacity satellite delivering high speed internet to homes and businesses in North America is scheduled for an early afternoon blastoff on a mighty ULA Atlas V on Sunday, Dec. 18, from the Florida Space Coast.
The lunchtime liftoff should thrill spectators since the venerable United Launch Alliance Atlas V booster carrying EchoStar 19 to orbit is equipped with a trio of solid rocket boosters making for a highly visible plume trailing behind all the way to geosynchronous orbit – weather permitting of course.
“EchoStar XIX will be the world’s highest capacity broadband satellite in orbit, dramatically increasing capacity for HughesNet® high-speed satellite Internet service to homes and businesses in North America,” according to ULA.
Also known as Jupiter 2, it will deliver more speed, more data and more advanced features to consumers and small businesses from coast to coast, says EchoStar.
EchoStar 19 satellite being processed
The ULA Atlas V was rolled out to the launch pad this morning ahead of tomorrows launch of the EchoStar XIX mission for Hughes from Space Launch Complex (SLC)-41 at Cape Canaveral Air Force Station, Florida, on Sunday, Dec. 18, 2016.
The launch window opens at 1:27 p.m. EST.
The launch window extends for two hours from 1:27 to 3:37 p.m. EST.
You can watch the Atlas launch live via a ULA webcast. The live launch broadcast will begin about 20 minutes before the planned liftoff at 1:07 p.m. EST here:
Artwork for ULA Atlas V launch of EchoStar 19 high speed Internet satellite on Dec. 18, 2016 from Canaveral Air Force Station, Florida. Credit: ULA
Because of the added solids, the soar to space should be spectacular for locals and tourists gathering from around the world to view the launch now slated for just a day away.
And since the liftoff is taking place on a weekend at lunchtime, that makes it perfectly convenient for a family outing in the sunshine state amidst this Christmas holiday season – which is currently sunny!!
The weather forecast for Sunday, Dec. 18, calls for a 70 percent chance of acceptable weather conditions at launch time.
The primary concerns are for thick clouds and cumlulus clouds.
ULA Atlas V rocket carrying the EchoStar 19 high speed internet satellite is poised for blastoff from Space Launch Complex-41 at Cape Canaveral Air Force Station in Florida on Dec. 18, 2016. Credit: Ken Kremer/kenkremer.com
EchoStar 19 will be delivered to a geosynchronous transfer orbit (GTO) atop the United Launch Alliance Atlas V booster.
It will be stationed at 97.1 degrees West longitude.
EchoStar 19 was built by Space Systems Loral (SSL) and is based on the powerful SSL 1300 platform as a multi-spot beam Ka-band satellite.
It is upgraded from the prior series version.
“Building from their experience on the highly successful EchoStar XVII broadband satellite, SSL and Hughes collaboratively engineered the specific design details of this payload for optimum performance.”
The 194-foot-tall commercial Atlas V booster will launch in the 431 rocket configuration with three solid rocket motors attached to augment the first stage thrust of approximately 2 million pounds.
Up close look at the payload fairing housing EchoStar 19 internet sat atop ULA Atlas V rocket set for launch from pad 41 at Cape Canaveral Air Force Station, Fl. Credit: Lane Hermann
Stay tuned here for Ken’s continuing Earth and Planetary science and human spaceflight news.
Learn more about ULA Atlas V EchoStar 19 comsat launch, GOES-R launch, Heroes and Legends at KSCVC, OSIRIS-REx, InSight Mars lander, ULA, SpaceX and Orbital ATK missions, Juno at Jupiter, SpaceX AMOS-6 & CRS-9 rocket launch, ISS, ULA Atlas and Delta rockets, Orbital ATK Cygnus, Boeing, Space Taxis, Mars rovers, Orion, SLS, Antares, NASA missions and more at Ken’s upcoming outreach events:
Dec. 16-18: “ULA Atlas V EchoStar 19 comsat launch,GOES-R weather satellite launch, OSIRIS-Rex, SpaceX and Orbital ATK missions to the ISS, Juno at Jupiter, ULA Delta 4 Heavy spy satellite, SLS, Orion, Commercial crew, Curiosity explores Mars, Pluto and more,” Kennedy Space Center Quality Inn, Titusville, FL, evenings
Artwork for ULA Atlas V launch of EchoStar 19 high speed Internet satellite on Dec. 18, 2016 from Canaveral Air Force Station, Florida. Credit: ULA
Welcome back to Constellation Friday! Today, in honor of the late and great Tammy Plotner, we will be dealing with the “big dog” itself – the Canis Major constellation!
In the 2nd century CE, Greek-Egyptian astronomer Claudius Ptolemaeus (aka. Ptolemy) compiled a list of all the then-known 48 constellations. This treatise, known as the Almagest, would be used by medieval European and Islamic scholars for over a thousand years to come, effectively becoming astrological and astronomical canon until the early Modern Age.
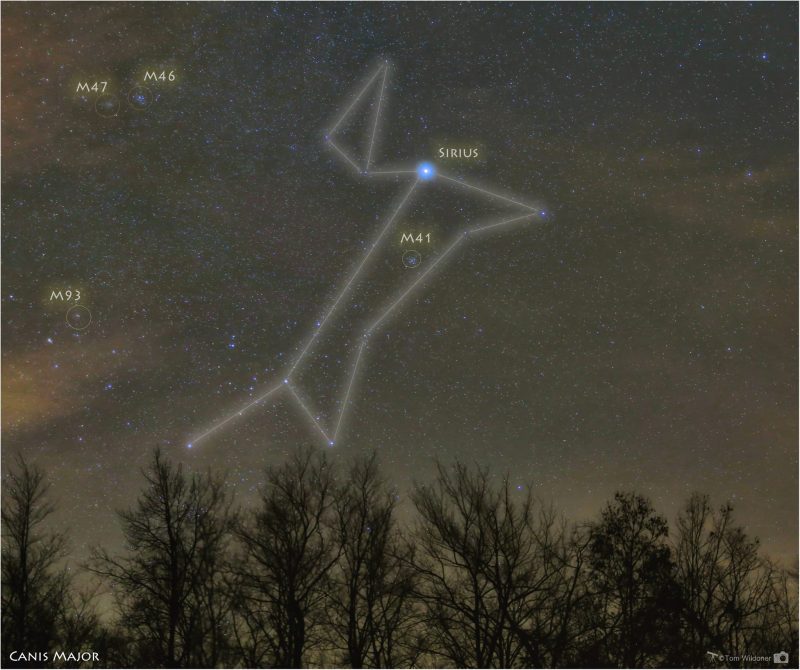
One of these constellations included in Ptolemy’s collection was Canis Major, an asterism located in the southern celestial hemisphere. As one of two constellations representing “the dogs” (which are associated with “the hunter” Orion) this constellation contains many notable stars and Deep Sky Objects. Today, it is one of the 88 constellations recognized by the IAU, and is bordered by Monoceros, Lepus, Columba and Puppis.
Name and Meaning:
The constellation of Canis Major literally translates to “large dog” in Latin. The first recorded mentions of any of the stars associated with this asterism are traced back to Ancient Mesopotamia, where the Babylonians recorded its existence in their Three Star Each tablets (ca. 1100 BCE). In this account, Sirus (KAK.SI.DI) was seen as the arrow aimed towards Orion, while Canis Major and part of Puppis were seen as a bow.
Artist’s impression of a white dwarf star in orbit around Sirius (a white supergiant). Credit: NASA, ESA and G. Bacon (STScI)
To the ancient Greeks, Canis Major represented a dog following the great hunter Orion. Named Laelaps, or the hound of Prociris in some accounts, this dog was so swift that Zeus elevated it to the heavens. Its Alpha star, Sirius, is the brightest object in the sky (besides the Sun, the Moon and nearest planets). The star’s name means “glowing” or “scorching” in Greek, since the summer heat occurred just after Sirius’ helical rising.
The Ancient Greeks referred to such times in the summer as “dog days”, as only dogs would be mad enough to go out in the heat. This association is what led to Sirius coming to be known as the “Dog Star”. Depending on the faintness of stars considered, Canis Major resembles a dog facing either above or below the ecliptic. When facing below, since Sirius was considered a dog in its own right, early Greek mythology sometimes considered it to be two headed.
Together with the area of the sky that is deserted (now considered as the new and extremely faint constellations Camelopardalis and Lynx), and the other features of the area in the Zodiac sign of Gemini (i.e. the Milky Way, and the constellations Gemini, Orion, Auriga, and Canis Minor), this may be the origin of the myth of the cattle of Geryon, which forms one of The Twelve Lab ours of Heracles.
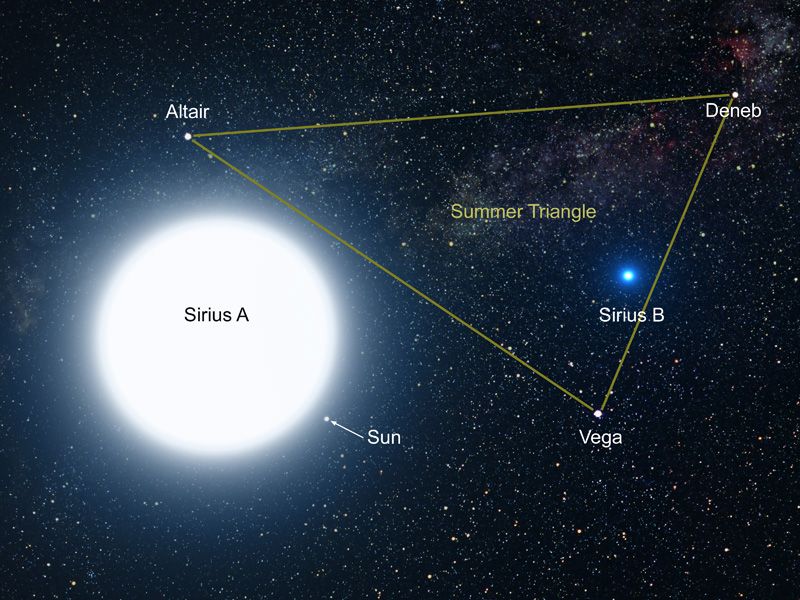
Artist’s impression of Sirius and the “Summer Triangle”. Credit: G. Bacon (STScI)/ESA/NASA
Sirius has been an object of wonder and veneration to all ancient peoples throughout human history. In fact, the Arabic word Al Shi’ra resembles the Greek, Roman, and Egyptian names suggesting a common origin in Sanskrit, in which the name Surya (the Sun God) simply means the “shining one.” In the ancient Vedas this star was known as the Chieftain’s star; and in other Hindu writings, it is referred to as Sukra – the Rain God, or Rain Star.
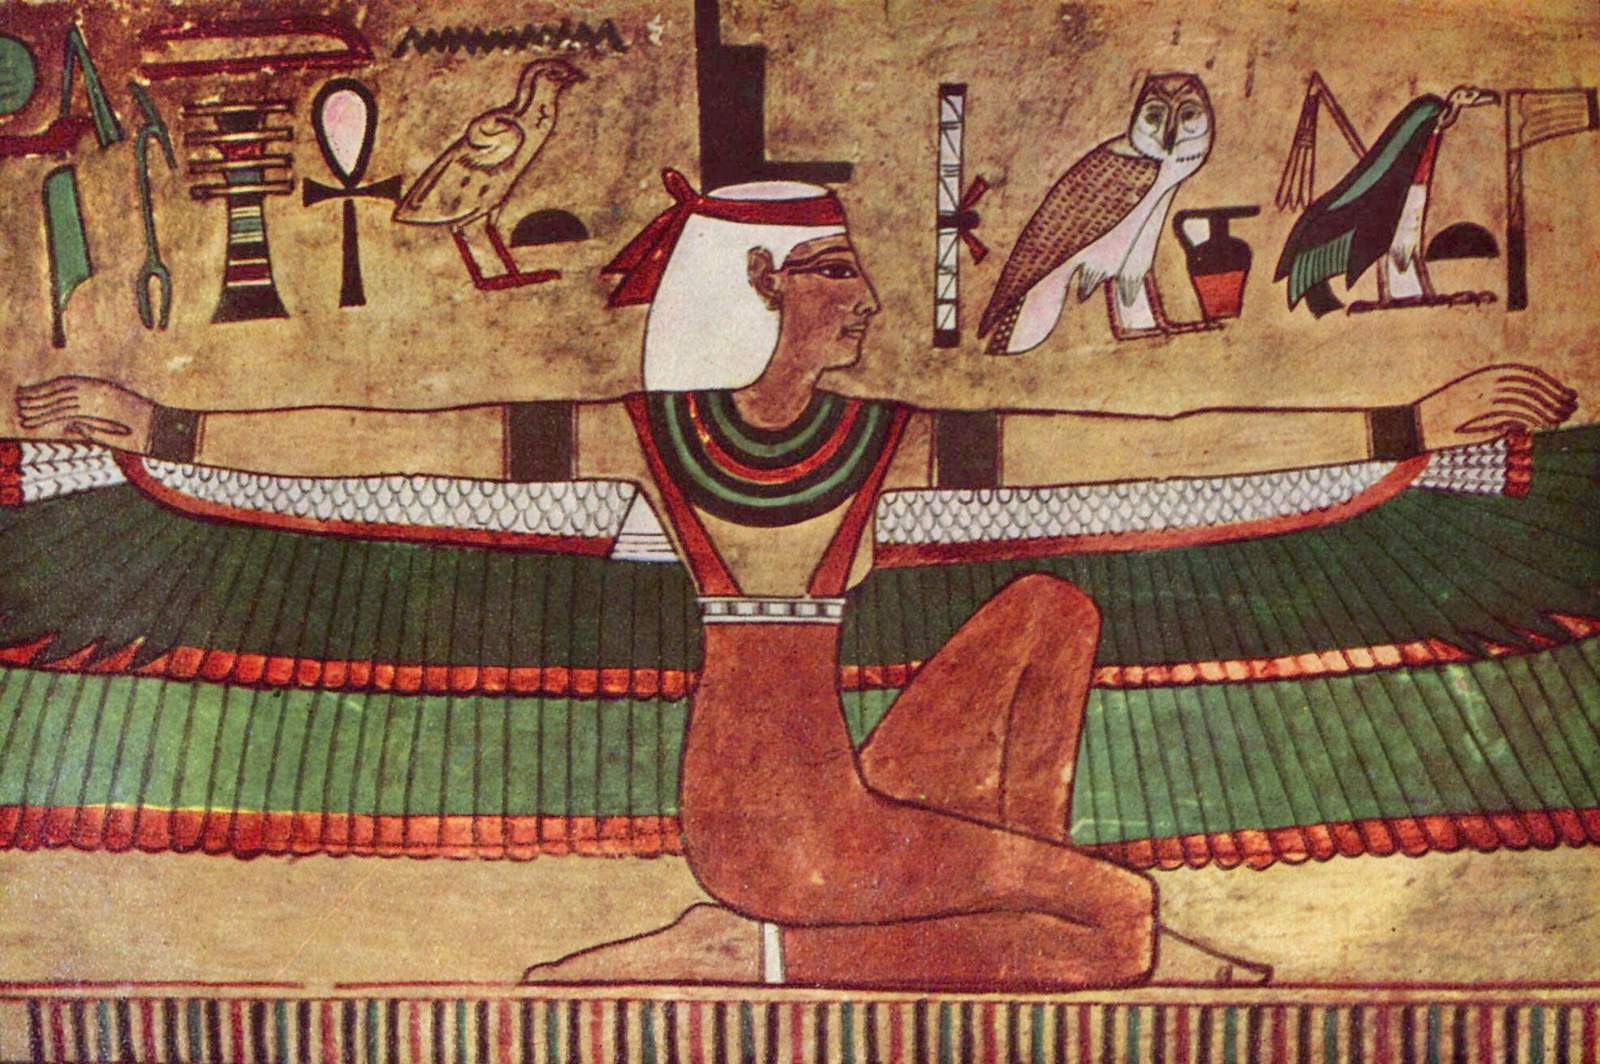
Sirius was revered as the Nile Star, or Star of Isis, by the ancient Egyptians. Its annual appearance just before dawn at the Summer Solstice heralded the flooding of the Nile, upon which Egyptian agriculture depended. This helical rising is referred to in many temple inscriptions, where the star is known as the Divine Sepat, identified as the soul of Isis.
To the Chinese, the stars of Canis Major were associated with several different asterisms – including the Military Market, the Wild Cockerel, and the Bow and Arrow. All of these lay in the Vermilion Bird region of the zodiac, on of four symbols of the Chinese constellations, which is associated with the South and Summer. In this tradition, Sirius was known Tianlang (which means “Celestial Wolf”) and denoted invasion and plunder.
This constellation and its most prominent stars were also featured in the astrological traditions of the Maori people of New Zealand, the Aborigines of Australia, and the Polynesians of the South Pacific.
Isis depicted with outstretched wings in an ancient wall painting (ca. 1360 BCE). Credit: Wikipedia Commons/Ägyptischer Maler
History of Observation:
This constellation was one of the original 48 that Ptolemy included in his 2nd century BCE work the Amalgest. It would remain a part of the astrological traditions of Europe and the Near East for millennia. The Romans would later add Canis Minor, appearing as Orion’s second dog, using stars to the north-west of Canis Major.
In medieval Arab astronomy, the constellation became Al Kalb al Akbar, (“the Greater Dog”), which was transcribed as Alcheleb Alachbar by European astronomers by the 17th century. In 1862, Alvan Graham Clark, Jr. made an interesting discovery while testing an 18″ refractor telescope at the Dearborn Observatory at Northwestern University in Illinois.
In the course of observing Sirius, he discovered that the bright star had a faint companion – a white dwarf later named Sirius B (sometimes called “the Pup”). These observations confirmed what Friedrich Bessel proposed in 1844, based on measurements of Sirius A’s wobble. In 1922, the International Astronomical Union would include Canis Major as one of the 88 recognized constellations.
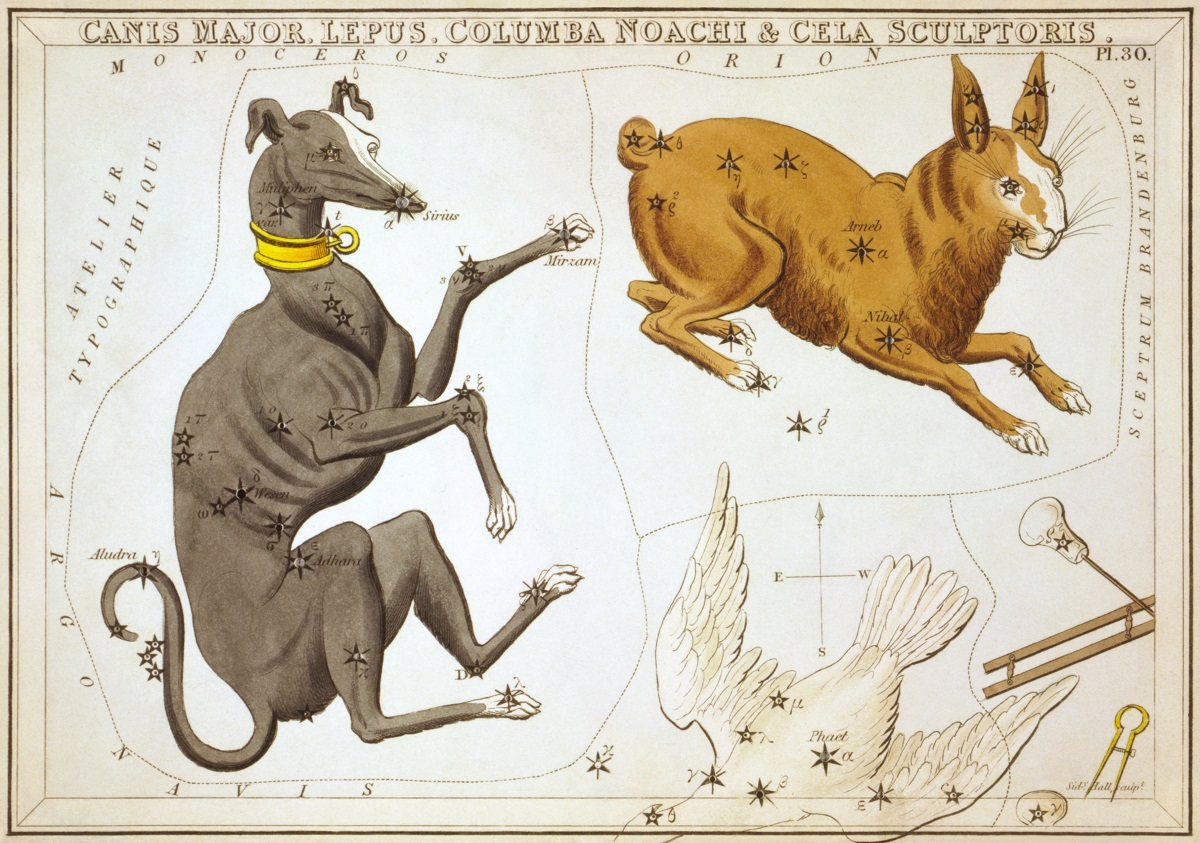
Canis Major as depicted in Urania’s Mirror, a set of constellation cards published in London c.1825. Credit: Library of Congress
Notable Features:
Canis Major has several notable stars, the brightest being Sirius A. It’s luminosity in the night sky is due to its proximity (8.6 light years from Earth), and the fact that it is a magnitude -1.6 star. Because of this, it produces so much light that it often appears to be flashing in vibrant colors, an effect caused by the interaction of its light with our atmosphere.
Then there’s Beta Canis Majoris, a variable magnitude blue-white giant star whose traditional name (Murzim) means the “The Heralder”. It is a Beta Cephei variable star and is currently in the final stages of using its hydrogen gas for fuel. It will eventually exhaust this supply and begin using helium for fuel instead. Beta Canis Majoris is located near the far end of the Local Bubble – a cavity in the local Interstellar medium though which the Sun is traveling.
Next up is Eta Canis Majoris, known by its traditional name as Aludra (in Arabic, “al-aora”, meaning “the virgin”). This star shines brightly in the skies in spite of its distance from Earth (approx. 2,000 light years from Earth) due to it being many times brighter (absolute magnitude) than the Sun. A blue supergiant, Aludra has only been around a fraction of the time of our Sun, yet is already in the last stages of its life.
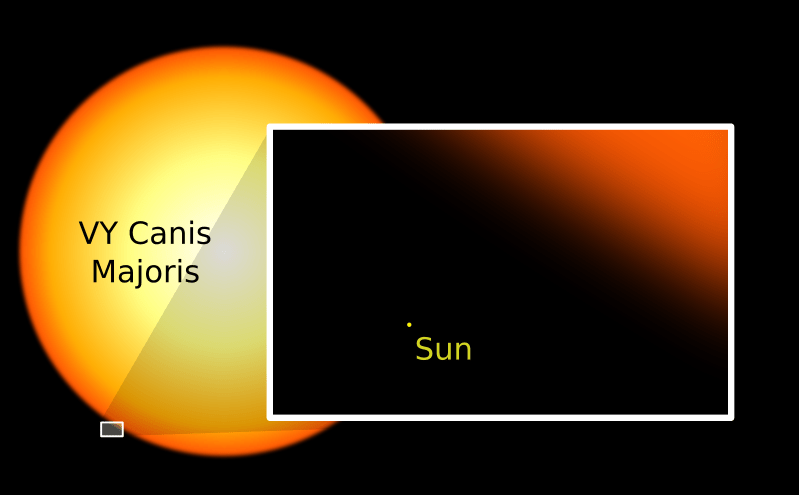
Another “major” star in this constellation is VY Canis Majoris (VY CMa), a red hypergiant star located in the constellation Canis Major. In addition to being one of the largest known stars, it is also one of the most luminous ever observed. It is located about 3,900 light years (~1.2 kiloparsecs) away from Earth and is estimated to have 1,420 solar radii.
Size comparison between the Sun and VY Canis Majoris, which once held the title of the largest known star in the Universe. Credit: Wikipedia Commons/Oona Räisänen
Canis Major is also home to several Deep Sky Objects, the most notable being Messier 41 (NGC 2287). Containing about 100 stars, this impressive star cluster contains several red giant stars. The brightest of these is spectral type K3, and located near M41’s center. The cluster is estimated to be between 190 and 240 million years old, and its is believed to be 25 to 26 light years in diameter.
Then there’s the galactic star cluster NGC 2362. First seen by Giovanni Hodierna in 1654 and rediscovered William Herschel in 1783, this magnificent star cluster may be less than 5 million years old and show shows signs of nebulosity – the remains of the gas cloud from which it formed. What makes it even more special is the presence of Tau Canis Major.
Easily distinguished as the brightest star in the cluster, Tau is a luminous supergiant of spectral type O8. With a visual magnitude of 4.39, it is 280,000 times more luminous than Sol. Tau CMa is also brighter component of a spectroscopic binary and studies of NGC 2362 suggest that it will survive longer than the Pleiades cluster (which will break up before Tau does), but not as long as the Hyades cluster.
Then there’s NGC 2354, a magnitude 6.5 star cluster. While it will likely appear as a small, hazy patch to binoculars, NGC 2354 is actually a rich galactic cluster containing around 60 metal-poor members. As aperture and magnification increase, the cluster shows two delightful circle-like structures of stars.
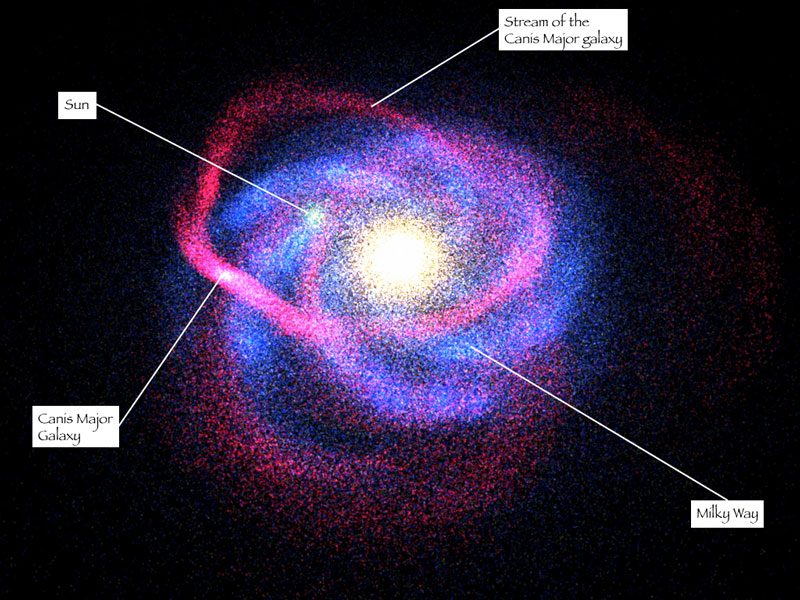
The Canis Major Dwarf Galaxy – currently recognized as being the closet neighbor to the Milky Way. Credit: APOD
For large telescopes and GoTo telescopes, there are several objects worth studying, like the Canis Major Dwarf Galaxy (RA 7 12 30 Dec -27 40 00). An irregular galaxy that is now thought to be the closest neighboring galaxy to our part of the Milky Way, it is located about 25,000 light-years away from our Solar System and 42,000 light-years from the Galactic Center.
It has a roughly elliptical shape and is thought to contain as many stars as the Sagittarius Dwarf Elliptical Galaxy, which was discovered in 2003 and thought to be the closest galaxy at the time. Although closer to the Earth than the center of the galaxy itself, it was difficult to detect because it is located behind the plane of the Milky Way, where concentrations of stars, gas and dust are densest.
Globular clusters thought to be associated with the Canis Major Dwarf galaxy include NGC 1851, NGC 1904, NGC 2298 and NGC 2808, all of which are likely to be a remnant of the galaxy’s globular cluster system before its accretion (or swallowing) into the Milky Way. NGC 1261 is another nearby cluster, but its velocity is different enough from that of the others to make its relation to the system unclear.
Finding Canis Major:
Finding Canis Major is quite easy, thanks to the presence of Sirius – the brightest star to grace the night sky. All you need to do is find Orion’s belt, discern the lower left edge of constellation (the star Kappa Orionis, or Saiph), and look south-west a few degrees. There, shining in all it glory, will be the “Dog Star”, with all the other stars stemming outwards from it.
The location of the Canis Major constellation in the southern sky. Credit: IAU
Unfortunately, Sirius A’s luminosity means that the means that poor “Pup” hardly stands a chance of being seen. At magnitude 8.5 it could easily be caught in binoculars if it were on its own. To find it, you’ll need a mid-to-large telescope with a high power eyepiece and good viewing conditions – a stable evening (not night) when Sirius is as high in the sky as possible. It will still be quite faint, so spotting it will take time and patience.
Between Sirius at the northern tip, and Adhara at the south, you can also spot M41 residing almost about halfway. Using binoculars or telescopes, all one need do is aim about 4 degrees south of Sirius – about one standard field of view for binoculars, about one field of view for the average telescope finderscope, and about 6 fields of view for the average wide field, low power eyepiece.
Thousands of years later, Canis Major remains an important part of our astronomical heritage. Thanks largely to Sirius, for burning so brightly, it has always been seen as a significant cosmological marker. But as our understanding of the cosmos has improved (not to mention our instruments) we have come to find just how many impressive stars and stellar objects are located in this region of space.
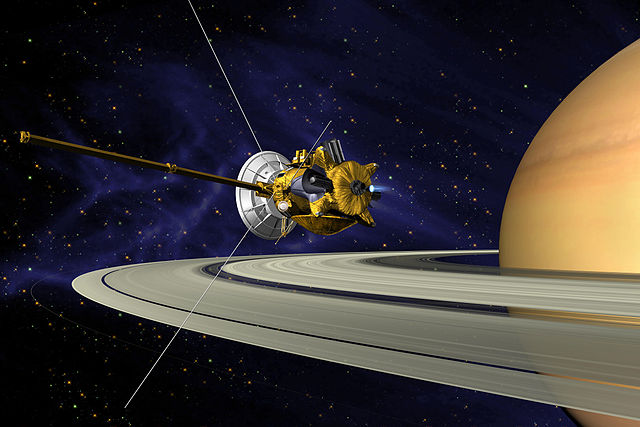
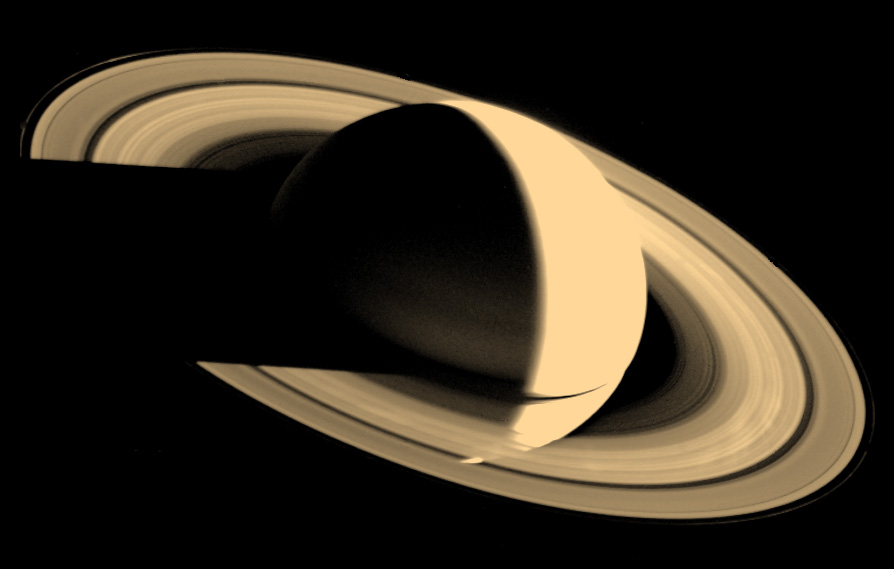
An artist's illustration of Cassini entering orbit around Saturn. Credit: NASA/JPL.
When Cassini Project Scientist Linda Spilker thinks about her spacecraft, as it is out there gliding amidst the moons and rings of Saturn, there are times when she envisions it as a dancer or ice skater, spinning and turning to look at all the different targets.
“I picture Cassini as a she,” Spilker said, admitting to moments of anthropomorphizing, “because all good sailing ships are a she. She has these beautiful gold thermal blankets, and I see them as her golden flowing hair. I think she’s very joyful and curious and is definitely an explorer. That’s my view of what Cassini looks like.”
“There is a personality there,” Spilker said of the Cassini spacecraft, “and I think it is a reflection of the Cassini team. We take good care of her and watch over her, making sure everything goes right. And if she curls up in the middle of the night and says ‘Help!’ we all come in and want to fix her and get her running again.”
But during its 13-year mission, the Cassini spacecraft has had few anomalies and difficulties. As the Cassini team gears up towards the end of the mission in September 2017, they look back with amazement, gratitude and a sense of accomplishment.
“Everything about the spacecraft is rock solid,” said Cassini Project Manager Earl Maize. “There were really no compromises in the hardware whatsoever. All the design lessons learned from Galileo, Voyager and Magellan went into Cassini.”
Plus, the spacecraft engineering and science teams have been absolutely meticulous in managing the mission, Maize said.
“If we find an idiosyncrasy that looks like it might trend into an issue, we work around it. We have cranky reaction wheels, and we have nursed them. Plus the spacecraft has been very good at diagnosing itself and the team is very good at working through the issues. We’ve had very few difficulties in flight,” Maize said, grinning, looking towards the wooden table in front of us, and giving it a few knocks. “It looks good for us to finish up the mission strong.”
The 37 NASA scientists and engineers I interviewed for over a dozen different missions all had stories to tell and they all had their favorites. Maize said the main story of the Cassini is its durability and endurance. Launched in 1997, the spacecraft arrived at Saturn in 2004. Over the years, Cassini’s findings have revolutionized our understanding of the entire Saturn system, providing intriguing insights on Saturn itself as well as revealing secrets held by moons such as Enceladus and Titan.
“The main story is the longevity,” Maize said. “Voyager will always have us beat, because Cassini is an orbiter and it has certain sets of consumables – for example, the propellant — that will run out. But the longevity of the mission is a tribute to the developers. We had some amazing system engineers whose history of working on previous missions will likely never be repeated.”
Like many of those engineers, early in her career as a planetary scientist, Spilker worked on the Voyager mission.
Saturn captured by Voyager. Image credit: NASA/JPL
“After the Voyager flybys of Saturn in 1980 and 1981, we realized we couldn’t see through the atmosphere of Titan because we didn’t have the right filters,” Spilker said, as we chatted in her office at JPL. “So people started planning in the early 1980’s for a mission that would go back to Saturn, and to look at Titan.”
Wes Huntress, longtime JPL scientist and Director of NASA’s Solar System Exploration Division, was in charge of developing this new mission, and in 1988 he asked Spilker to be his deputy.
“This project ultimately became Cassini,” Spilker said. “It didn’t have a name yet and wasn’t funded at that time, but I’ve been with it ever since. Talk about longevity!”
Spilker added that the entire mission has been a “wonderful experience,” and that she has been fascinated by Saturn ever since she got a telescope when she was in 3rd grade.
Maize said one of the most memorable moments for him came early in the mission: orbit insertion at Saturn.
This view looks toward the sunlit side of the rings from about 17 degrees above the ringplane and was taken with the Cassini spacecraft wide-angle camera on Aug. 12, 2014. Credit: NASA/JPL-Caltech/Space Science Institute.
“That was the must-do event,” he said. “We had a 45-minute burn and we were either a flyby mission or we were in business. I was feeling pretty good about the burn, but what was amazing about it was that if the burn was completed properly, we were going to be able to get some amazing images as the spacecraft came up over the ring plane of the planet. I was sitting with Ed Weiler the next morning at about 4:30 a.m., looking at those images and it was just amazing. I’ll never forget it. It was probably the hallmark moment for me.”
At that time, no spacecraft had ever been that close to Saturn’s rings before. Now, as the mission enters the beginning of the final phase of the mission –as it prepares to plunge into the gas giant in 2017 to protect any potential life on any of Saturn’s moons from contamination from the spacecraft — it will come even closer to the rings, diving close and through Saturn’s rings a total of 20 times.
“It’s taken years of planning, but now that we’re finally here, the whole Cassini team is excited to begin studying the data that come from these ring-grazing orbits,” said Spilker. “This is a remarkable time in what’s already been a thrilling journey.”
Cassini image of ice geysers on Enceladus (NASA/JPL/SSI)
What will Cassini’s legacy be? Spilker offered a unique perspective.
“The biggest legacy will be how it has helped us realize all the different possibilities of where life might be found, even within our own solar system,” she said. “We’ve found that you don’t necessarily need to have a planet in the sweet spot from a star, where you could have liquid water on the surface. That might change the way we look at exoplanets. Yes, let’s find those earths or super-earths in that sweet spot, but when our instruments improve, let’s look for those giant planets that might have moons that might have life. That has broadened our places to look. From Cassini, I think we’ve learned that maybe there’s a lot more possibility for life than we had ever imagined.”
“Incredible Stories From Space” takes readers behind the scenes of the unmanned missions that are transforming our understanding of the solar system and beyond. Weaving together one-on-one interviews along with the extraordinary sagas of the spacecraft themselves, this book chronicles the struggles and triumphs of nine current space missions and captures the true spirit of exploration and discovery. Look for more “stories” and an excerpt from the book as the release date of Dec. 20 approaches.