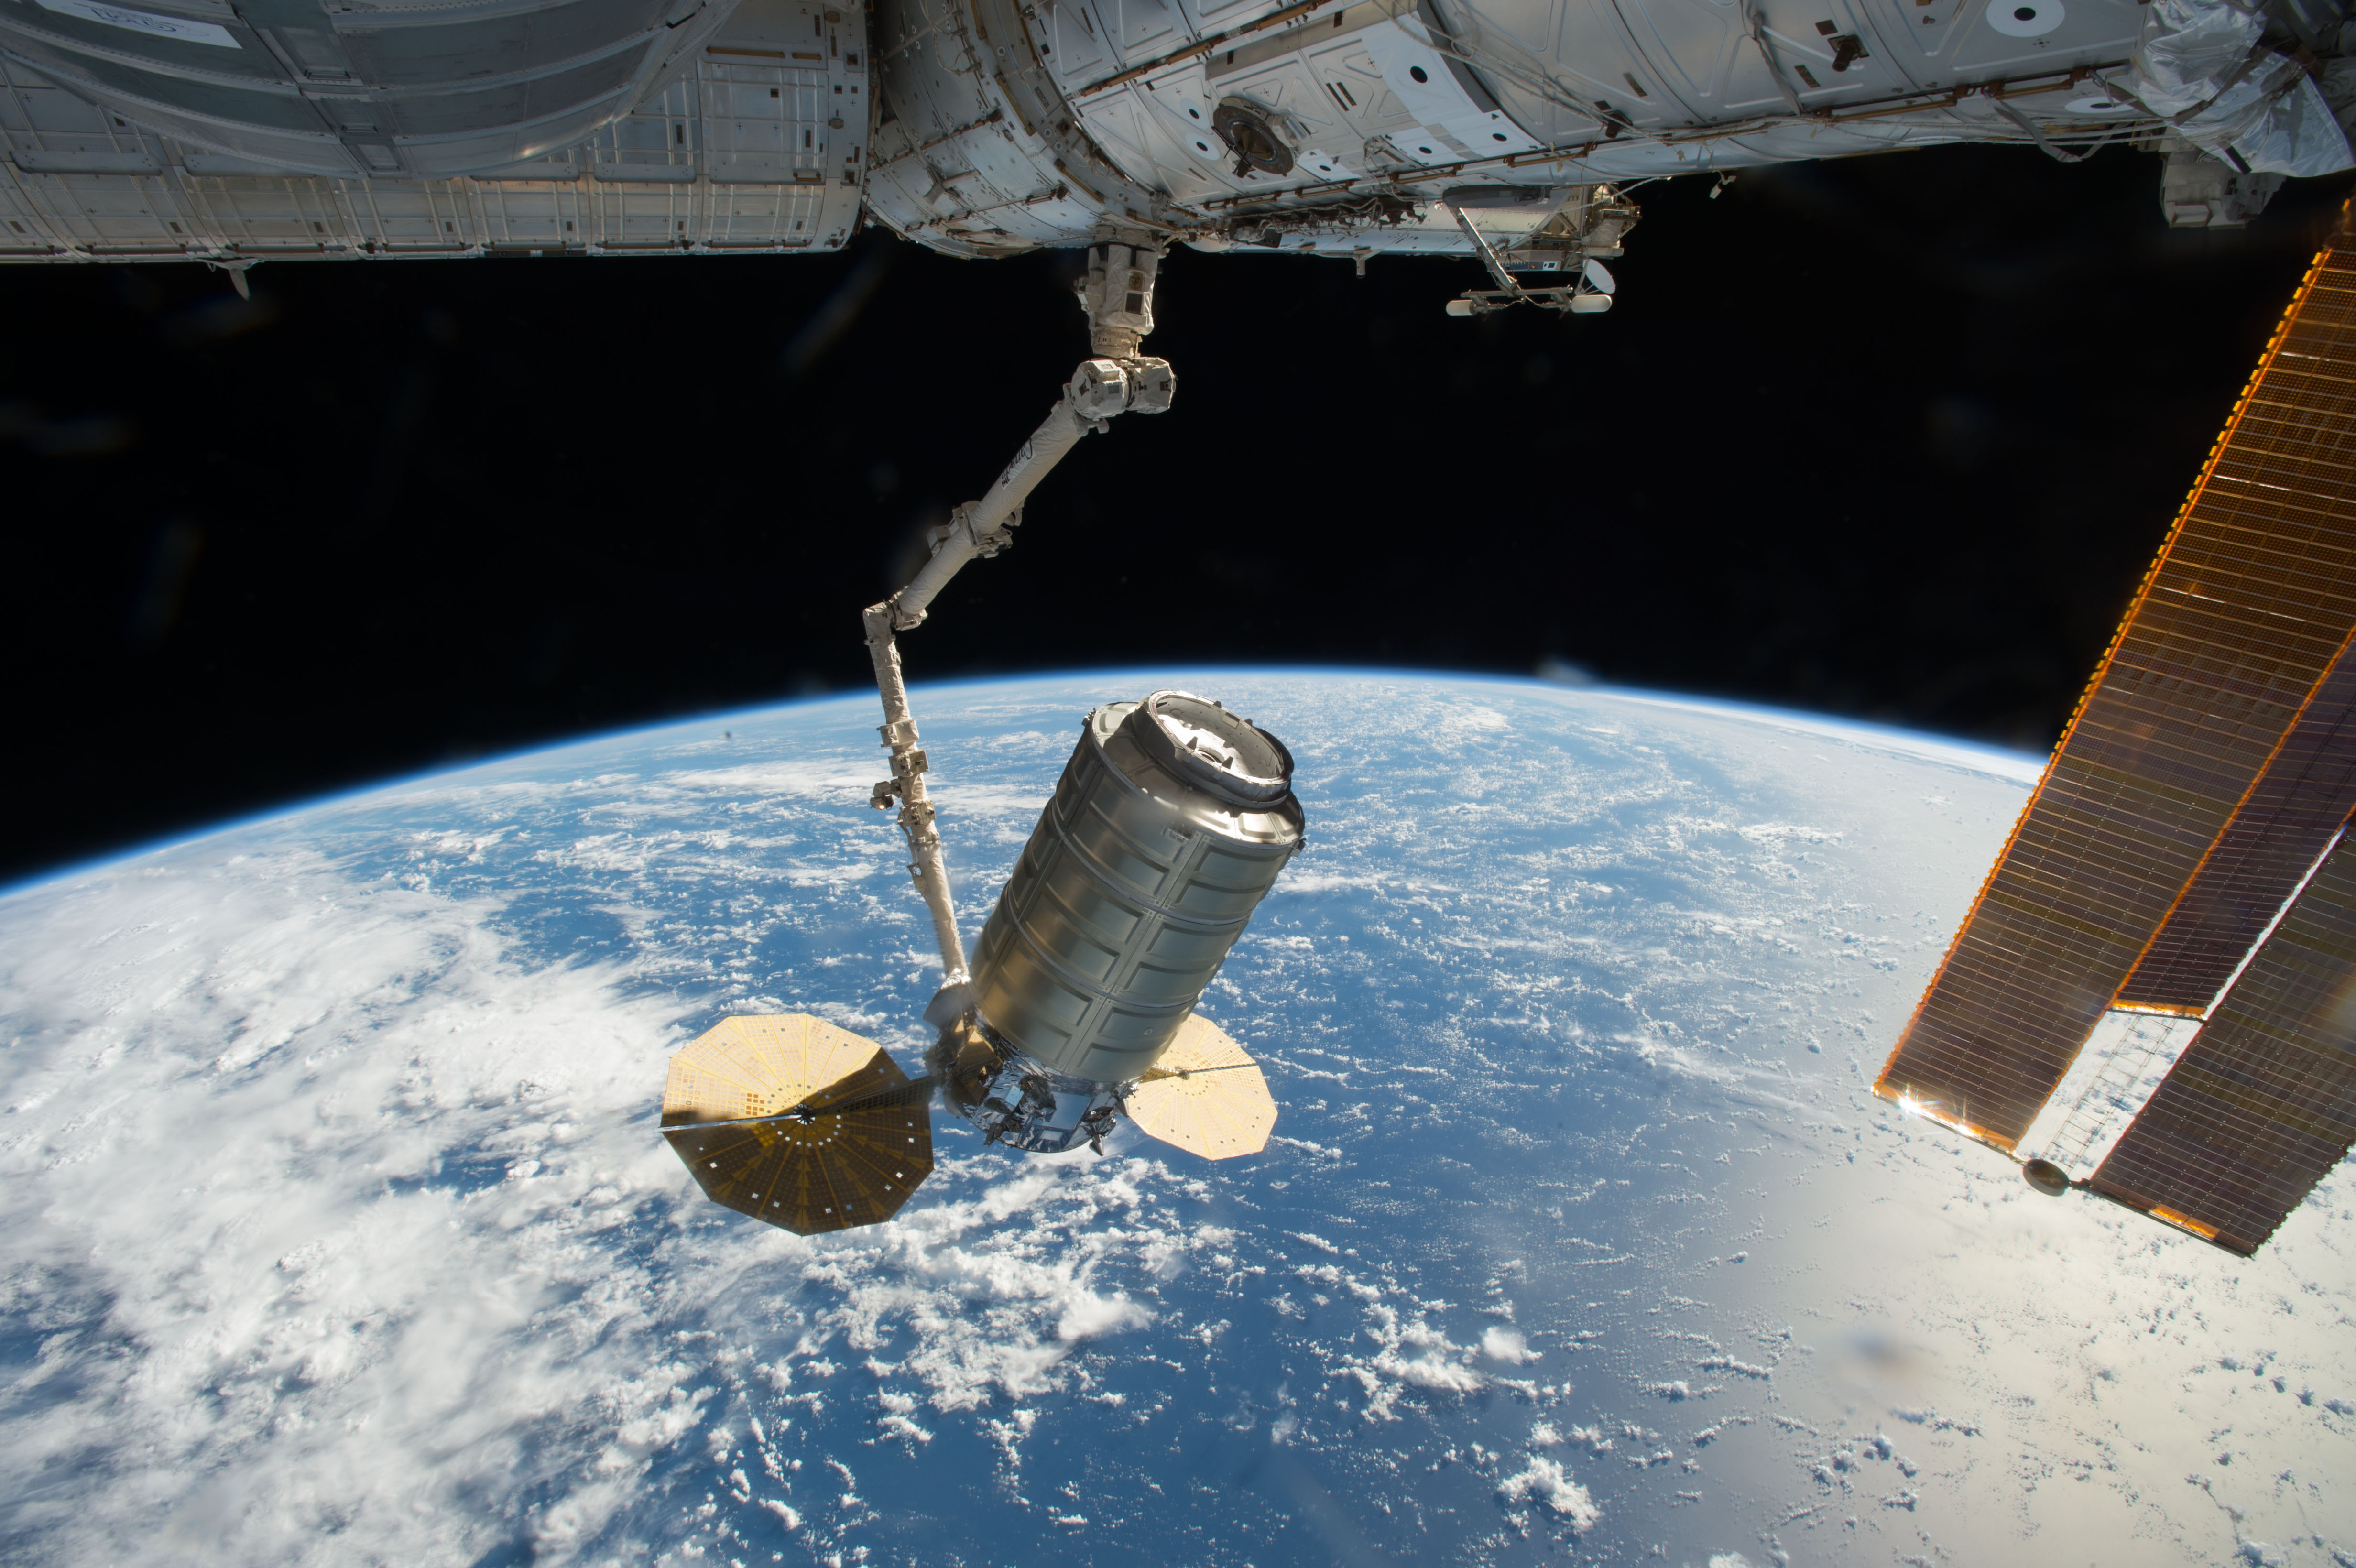
Orbital ATK's Cygnus cargo spacecraft is captured using the Canadarm2 robotic arm on the International Space Station. Credit: NASA
Back in October, the Cygnus CRS OA-5 mission (aka. the Orbital Sciences CRS Flight 5) rendezvoused with the International Space Station. As part of Orbital ATK craft’s sixth Commercial Resupply mission to the ISS, the unmanned spacecraft spent the past month berthed with the station, delivering 2,268 kg (5,000 pounds) of cargo and experiments and taking on 1,120 kilograms (2,469 pounds) of trash.
As of this Monday, November 21st, the spacecraft – named the “S.S. Alan Poindexter” in honor of the deceased Space Shuttle commander who died in 2012 – separated from the station’s Unity Module, and will spend the next week performing standalone operations. These have included the much-anticipated Spacecraft Fire Experiment 2 (aka. Saffire-II), which is managed by NASA’s Glenn Research Center.
This experiment, which began just five hours after the shuttle detached from the station (and after it conducted an orbit-raising maneuver), involved the Cygnus controllers deliberately starting a fire inside the spacecraft’s pressurized cabin. The purpose of this was to investigate how fuel combustion works and fires grow in a microgravity environment.
The Spacecraft Fire Experiment (aka. Saffire) is an attempt by NASA scientists to see how fire behaves in microgravity environments. Credit: NASA
How fire behaves in space is one of the least understood hazards facing crewed exploration. Until now, research has been limited, and for obvious reasons. Starting a controlled fire in a microgravity environment, especially when you don’t even know how it will behave, is an extremely risky venture. All previous tests that were carried out were severely restricted in size, and yielded very little information.
In contrast, the uncrewed portion of the Cygnus mission offers NASA scientists a rare opportunity to conduct a microgravity fire test aboard a spacecraft. Not only are they hoping to address how fires can ignite, but also how large they can grow in microgravity, how they may consume materials the spacecraft is built from, and eventually die.
As Jitendra Joshi, the technology integration lead for NASA’s Advanced Exploration Systems division, said in an interview with Spaceflight Now, such tests are critical for developing fire countermeasures:
“One of the least understood risks in space is how fire propagates (and) starts. How do you control the fire? How do you detect the fire? All these things. You can’t call 911 like on Earth to come help you.”
In addition to being pressurized, the inside of the Cygnus spacecraft also contained samples of material that are commonly found aboard the ISS. NASA was also sure to include materials that would be included in future tests of the Orion capsule, since such tests are of extreme importance to their “Journey to Mars” and other long-range, long-duration missions.
This was the second experiment conducted as part of the Saffire program, which is managed by NASA’s Advanced Exploration Systems Division, part of the Glenn Research Center. It follows on the heels of the highly successful Saffire-I experiment, which took place in July of 2016. In that experiment, samples of a cotton-fiberglass blend were ignited inside an enclosure aboard a Cygnus vehicle, which consisted of a flow duct and avionics bay.
The samples themselves measured 0.4 meter wide by 1 m long, and were ignited by a hot wire inside an enclosure measuring half a meter wide, 1 meter deep and 1.3 meter long. Prior to this experiment, the largest fire experiment that had ever been conducted in space was about the size of an index card.
The Saffire-II experiment (the second of three proposed fire tests) began just after 18:15 Eastern Time (23:15 UTC ) on November 21st, as the first of nine samples was ignited aboard the craft. This time around, the samples included a cotton-fiberglass blend, Nomex (a flame resistant material used commonly aboard spacecraft), and the same acrylic glass that is used for spacecraft windows.
The nine samples burned for a total of two hours before dying out, and yielded much useful information. As Gary Ruff, Saffire’s project manager, said in a previous NASA press release:
“A spacecraft fire is one of the greatest crew safety concerns for NASA and the international space exploration community. Saffire is all about gaining a better understanding of how fire behaves in space so NASA can develop better materials, technologies and procedures to reduce crew risk and increase space flight safety.”
The third and final experiment for the Spacecraft Fire Experiment series (Saffire-III) is scheduled to take place during the OA-7 mission, which is scheduled to take place in March of 2017. With all three experiments complete, NASA hopes to have accumulated enough data to help guide the selection and construction of future spacecraft, subsystems and instruments.
They also hope that these experiments will help mission planners come up with operational protocols designed to address fires during future crewed missions. These will be especially handy during missions where astronauts don’t have the option of exiting to a docked spacecraft and returning to Earth (as they do aboard the ISS).
The Cygnus craft is now moving on to deploy the four LEMUR CubeSats, which will happen on Friday, November 25th. These CubeSats are part of a growing community of satellites that provide global ship tracking and weather monitoring services.
Following this, Cygnus will remain in orbit for two more days before conducting two burns that will cause it to deorbit and burn up in out atmosphere – which will take place on Sunday, November 27th.
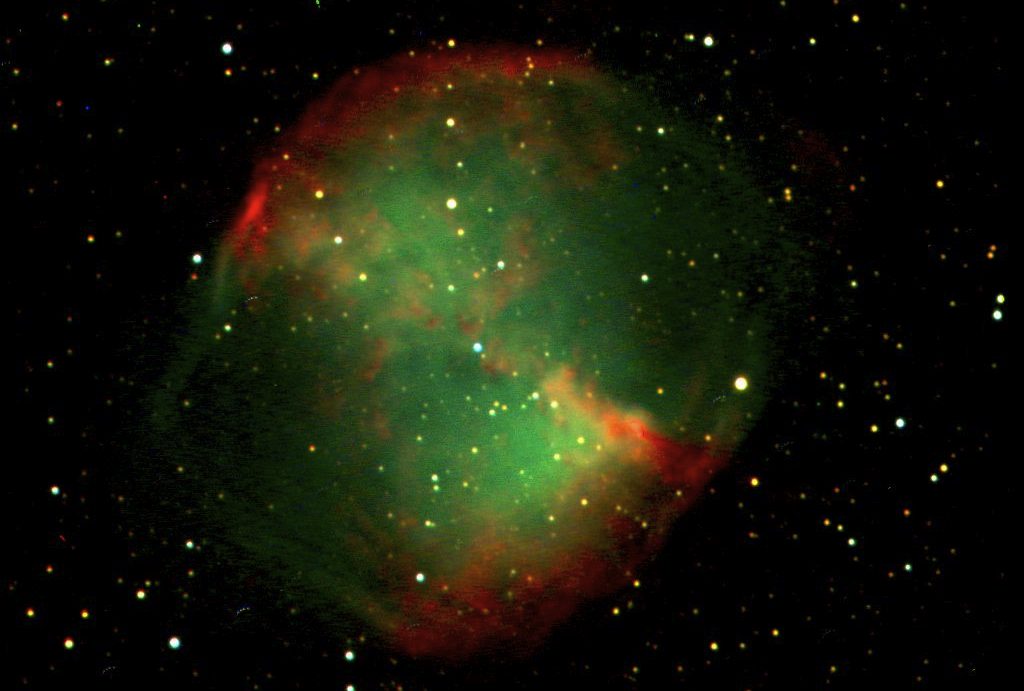
Image of the Messier 27 planetary nebula, taken by NASA's Spitzer Space Telescope. Credit: NASA/JPL-Caltech/J. Hora (Harvard-Smithsonian CfA)
Welcome back to Messier Monday! In our ongoing tribute to the great Tammy Plotner, we take a look at the famous and easily-spotted Dumbbell Nebula. Enjoy!
Back in the 18th century, famed French astronomer Charles Messier noted the presence of several “nebulous objects” in the night sky. Having originally mistaken them for comets, he began compiling a list of them so that others would not make the same mistake he did. In time, this list would come to include 100 of the most fabulous objects in the night sky.
Known today as the Messier Catalog, this work has come to be viewed as one of the most important milestones in the study of Deep Space Objects. One of these is the famed Dumbbell Nebula – also known as Messier 27, the Apple Core Nebula, and NGC 6853. Because it of its brightness, it is easily viewed with binoculars and amateur telescopes, and was the first planetary Nebula to be discovered by Charles Messier.
Description:
This bright planetary nebula is located in the direction of the Vulpecula constellation, at a distance of about 1,360 light years from Earth. Located within the equatorial plane, this nebula is essentially a dying star that has been ejecting a shell of hot gas into space for roughly 48,000 years.
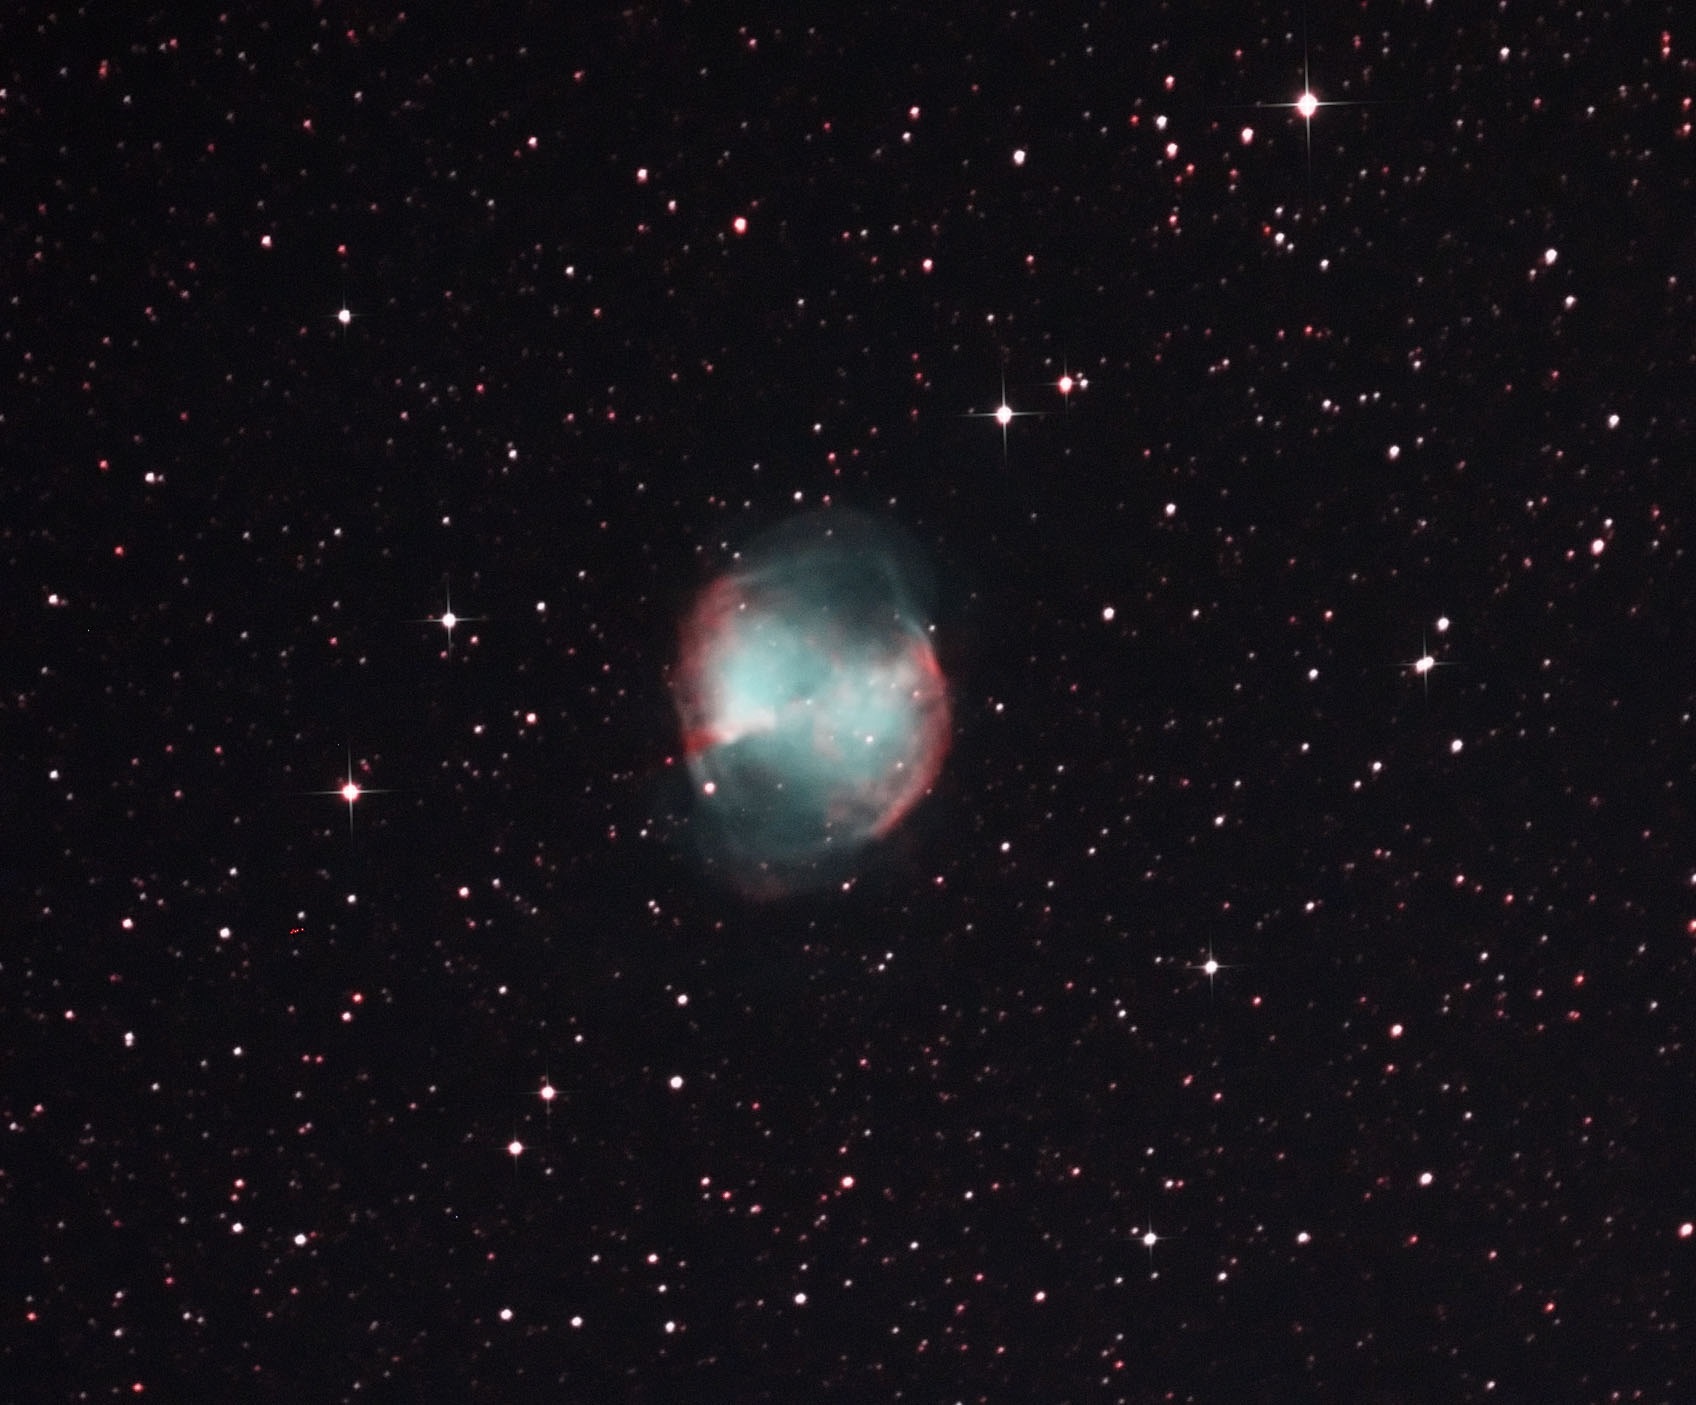
Picture of M27 processed and combined using IRAF and MaxIm DL. Credit: Wikipedia Commons/Mohamad Abbas
The star responsible is an extremely hot blueish subdwarf star, which emits primarily highly energetic radiation in the non-visible part of the electromagnetic spectrum. This energy is absorbed by exciting the nebula’s gas, and then re-emitted by the nebula. Messier 27 particular green glow (hence the nickname “Apple Core Nebula”) is due to the presence of doubly-ionized oxygen in its center, which emits green light at 5007 Angstroms.
For many years I quested to understand the distant and mysterious M27, but no one could answer my questions. I researched it, and learned that it was made up of doubly ionized oxygen. I had hoped that perhaps there was a spectral reason to what I viewed year after year – but still no answer.
Like all amateurs, I became the victim of “aperture fever” and I continued to study M27 with a 12″ telescope, never realizing the answer was right there – I just hadn’t powered up enough. Several years later while studying at the Observatory, I was viewing through a friend’s identical 12″ telescope and, as chance would have it, he was using about twice the magnification that I normally used on the “Dumbbell.”
Imagine my total astonishment as I realized for the very first time that the faint central star had an even fainter companion that made it seem to wink! At smaller apertures or low power, this was not revealed. Still, the eye could “see” a movement within the nebula – the central, radiating star and its companion.
Image from a ground-based telescope at Westview Observatory in Cridersville, OH. Credit: Wikipedia Commons/Charlemagne920
“As the gas at the inner edge begins to ionize, the pressure throughout the nebula is equalized by a shock which moves outward through the neutral gas. Later, when about 1/10 of the nebular mass is ionized, a second shock is released from the ionized front, and this shock moves through the neutral shell reaching the outer edge. The density of the HI gas just behind the shock is quite large and the outward gas velocity increases within until it reaches a maximum of 40-80 km per second just behind the shock front. The projected appearance of the nebula during this stage has a double ring structure similar to many observed planetaries.”
But, movement or no movement, Messier 27 is known as one of the top “polluters” of the interstellar medium. As Joseph L. Hora ( et al.) of the Harvard-Smithsonian Center for Astrophysics said in his 2008 study “Planetary Nebulae: Exposing the Top Polluters of the ISM“:
“The high mass loss rates of stars in their asymptotic giant branch (AGB) stage of evolution is one of the most important pathways for mass return from stars to the ISM. In the planetary nebulae (PNe) phase, the ejected material is illuminated and can be altered by the UV radiation from the central star. PNe therefore play a significant role in the ISM recycling process and in changing the environment around them…
“A key link in the recycling of material to the Interstellar Medium (ISM) is the phase of stellar evolution from Asymptotic Giant Branch (AGB) to white dwarf star. When stars are on the AGB, they begin to lose mass at a prodigious rate. The stars on the AGB are relatively cool, and their atmospheres are a fertile environment for the formation of dust and molecules. The material can include molecular hydrogen (H2), silicates, and carbon-rich dust. The star is fouling its immediate neighborhood with these noxious emissions. The star is burning clean hydrogen fuel, but unlike a “green” hydrogen vehicle that outputs nothing except water, the star produces ejecta of various types, some of which have properties similar to that of soot from a gas-burning automobile. A significant fraction of the material returned to the ISM goes through the AGB – PNe pathway, making these stars one of the major sources of pollution of the ISM.
“However, these stars are not done with their stellar ejecta yet. Before the slow, massive AGB wind can escape, the star begins a rapid evolution where it contracts and its surface temperature increases. The star starts ejecting a less massive but high velocity wind that crashes into the existing circumstellar material, which can create a shock and a higher density shell. As the stellar temperature increases, the UV flux increases and it ionizes the gas surrounding the central star, and can excite emission from molecules, heat the dust, and even begin to break apart the molecules and dust grains. The objects are then visible as planetary nebulae, exposing their long history of spewing material into the ISM, and further processing the ejecta. There are even reports that the central stars of some PNe may be engaging in nucleosynthesis for purposes of self-enrichment, which can be traced by monitoring the elemental abundances in the nebulae. Clearly, we must assess and understand the processes going on in these objects in order to understand their impact on the ISM, and their influence on future generations of stars.”
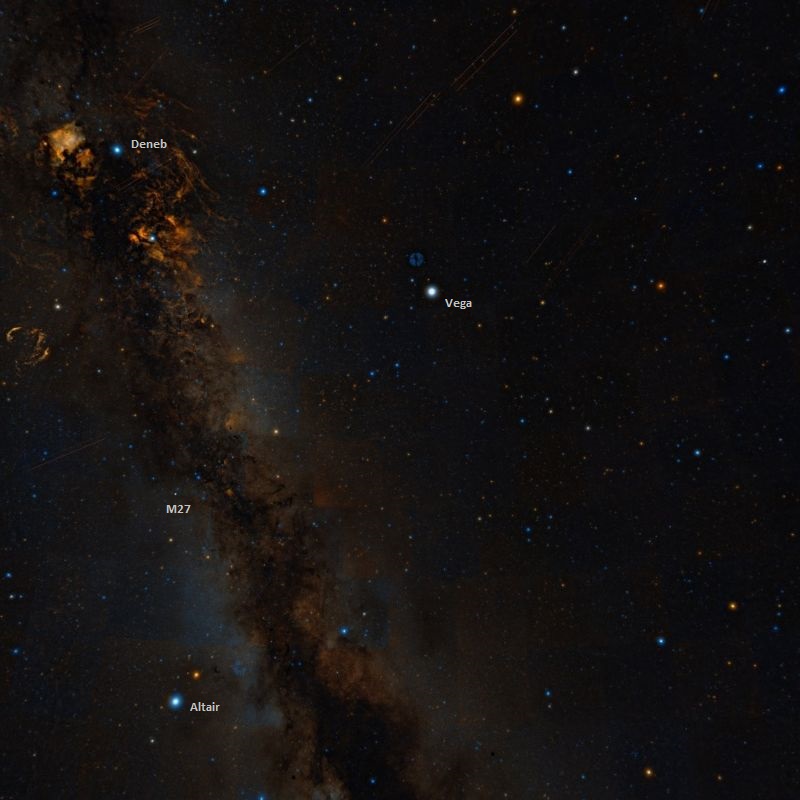
Messier 27 and the Summer Triangle. Credit: Wikisky
History of Observation:
So, chances are on July 12th, 1764, when Charles Messier discovered this new and fascinating class of objects, he didn’t really have a clue as to how important his observation would be. From his notes of that night, he reports:
“I have worked on the research of the nebulae, and I have discovered one in the constellation Vulpecula, between the two forepaws, and very near the star of fifth magnitude, the fourteenth of that constellation, according to the catalog of Flamsteed: One sees it well in an ordinary refractor of three feet and a half. I have examined it with a Gregorian telescope which magnified 104 times: it appears in an oval shape; it doesn’t contain any star; its diameter is about 4 minutes of arc. I have compared that nebula with the neighboring star which I have mentioned above [14 Vul]; its right ascension has been concluded at 297d 21′ 41″, and its declination 22d 4′ 0″ north.”
Of course, Sir William Herschel’s own curiosity would get the better of him and although he would never publish his own findings on an object previously cataloged by Messier, he did keep his own private notes. Here is an excerpt from just one of his many observations:
“1782, Sept. 30. My sister discovered this nebula this evening in sweeping for comets; on comparing its place with Messier’s nebulae we find it is his 27. It is very curious with a compound piece; the shape of it though oval as M. [Messier] calls it, is rather divided in two; it is situated among a number of small [faint] stars, but with this compound piece no star is visible in it. I can only make it bear 278. It vanishes with higher powers on account of its feeble light. With 278 the division between the two patches is stronger, because the intermediate faint light vanishes more.”
So where did Messier 27 get its famous moniker? From Sir John Herschel, who wrote: “A most extraordinary object; very bright; an unresolved nebula, shaped something like an hour-glass, filled into an oval outline with a much less dense nebulosity. The central mass may be compared to a vertebra or a dumb-bell. The southern head is denser than the northern. One or two stars seen in it.”
It would be several years, and several more historical astronomers, before the true nature of Messier 27 would even be hinted at. At one level, they understood it to be a nebula – but it wasn’t until 1864 when William Huggins came along and began to decode the mystery:
“It is obvious that the nebulae 37 H IV (NGC 3242), Struve 6 (NGC 6572), 73 H IV (NGC 6826), 1 H IV (NGC 7009), 57 M, 18 H. IV (NGC 7662) and 27 M. can no longer be regarded as aggregations of suns after the order to which our own sun and the fixed stars belong. We have with these objects to do no longer with a special modification only of our own type of suns, but find ourselves in the presence of objects possessing a distinct and peculiar plan of structure. In place of an incandescent solid or liquid body transmitting light of all refrangibilities through an atmosphere which intercepts by absorption a certain number of them, such as our sun appears to be, we must probably regard these objects, or at least their photo-surfaces, as enormous masses of luminous gas or vapour. For it is alone from matter in the gaseous state that light consisting of certain definite refrangibilities only, as is the case with the light of these nebulae, is known to be emitted.”
Whether or not you enjoy M27 as one of the most superb planetary nebula in the night sky (or as a science object) you will 100% agree with the words of of Burnham: “The observer who spends a few moments in quiet contemplation of this nebula will be made aware of direct contact with cosmic things; even the radiation reaching us from the celestial depths is of a type unknown on Earth…”
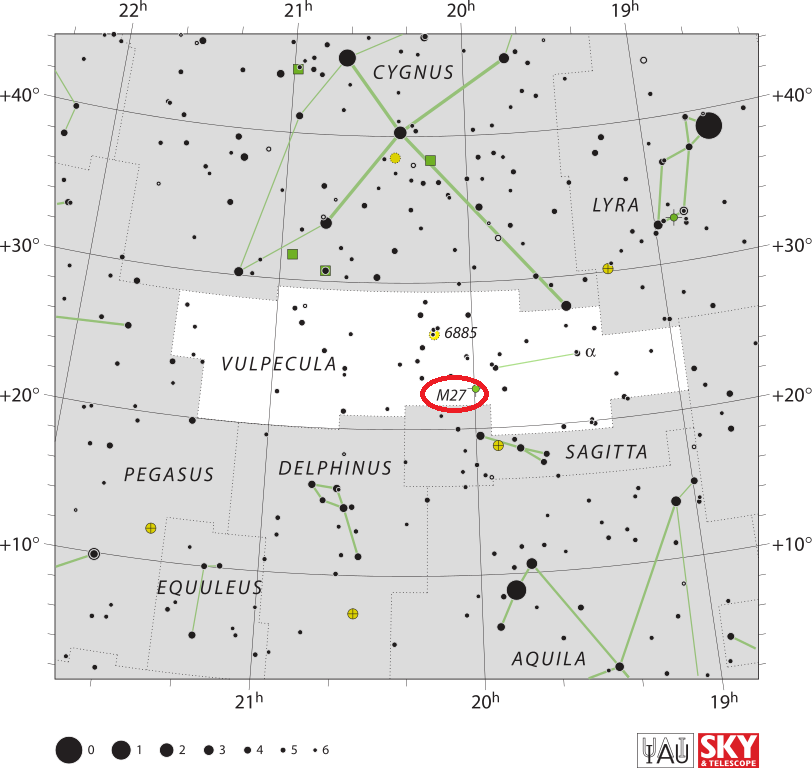
Locating Messier 27:
When you first begin, Messier 27 will seem like such an elusive target – but with a few simple sky “tricks”, it won’t be long until you’ll be finding this spectacular planetary nebula under just about any sky conditions. The hardest part is simply sorting out all the stars in the area to know the right ones to aim at!
The way I found easiest to teach others was to start BIG. The cruciform patterns of the Cygnus and Aquila constellations are easy to recognize and can be seen from even urban locations. Once you’ve identified these two constellations, you’re going smaller by locating Lyra and the tiny kite-shape of Delphinus.
Now you’ve circled the area and the hunt for Vulpecula the Fox begins! What’s that you say? You can’t distinguish Vulpecula’s primary stars from the rest of the field? You’re right. They don’t stand out like they should, and being tempted to simply aim halfway between Albeireo (Beta Cygni) and Alpha Delphini is too much of a span to be accurate. So what are we going to do? Here’s where some patience comes into play.
If you give yourself time, you’ll begin to notice the stars of Sagitta are ever so slightly brighter than the rest of the field stars around it, and it won’t be long until you pick out that arrow pattern. In your mind, measure the distance between Delta and Gamma (the 8 and Y shape on a starfinder map) and then just aim your binoculars or finderscope exactly that same distance due north of Gamma.
The location of M27 in the constellation Vulpecula. Credit: IAU/Sky & Telescope magazine (Roger Sinnott & Rick Fienberg)
You’ll find M27 every time! In average binoculars it will appear as a fuzzy, out of focus large star in a stellar field. In the finderscope, it may not appear at all… But in a telescope? Be prepared to be blown away! And here are the quick facts on the Dumbbell Nebula to help get you started:
Object Name: Messier 27 Alternative Designations: M27, NGC 6853, The Dumbbell Nebula Object Type: Planetary Nebula Constellation: Vulpecula Right Ascension: 19 : 59.6 (h:m) Declination: +22 : 43 (deg:m) Distance: 1.25 (kly) Visual Brightness: 7.4 (mag) Apparent Dimension: 8.0×5.7 (arc min)
When Elon Musk announced plans to send humans to Mars, he conveniently left out one important aspect. How are we supposed to survive on a place this hostile to life? Seriously, Mars sucks, and it’s going to take some impressive techniques and technologies to make it on the Red Planet.
We usually record Astronomy Cast as a live Google+ Hangout on Air every Friday at 1:30 pm Pacific / 4:30 pm Eastern. You can watch here on Universe Today or from the Astronomy Cast Google+ page.
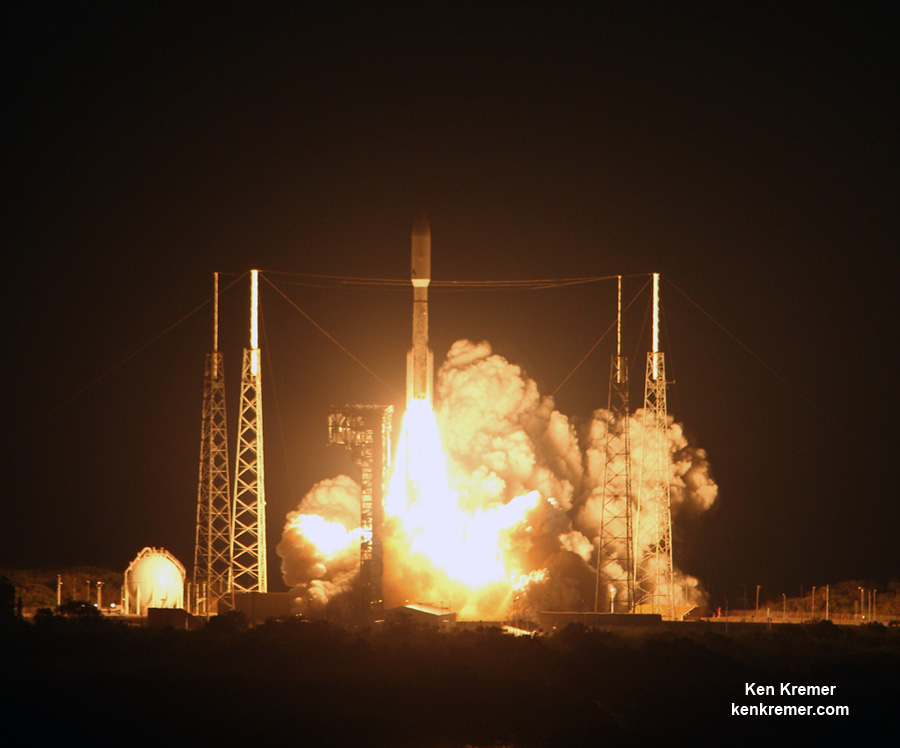
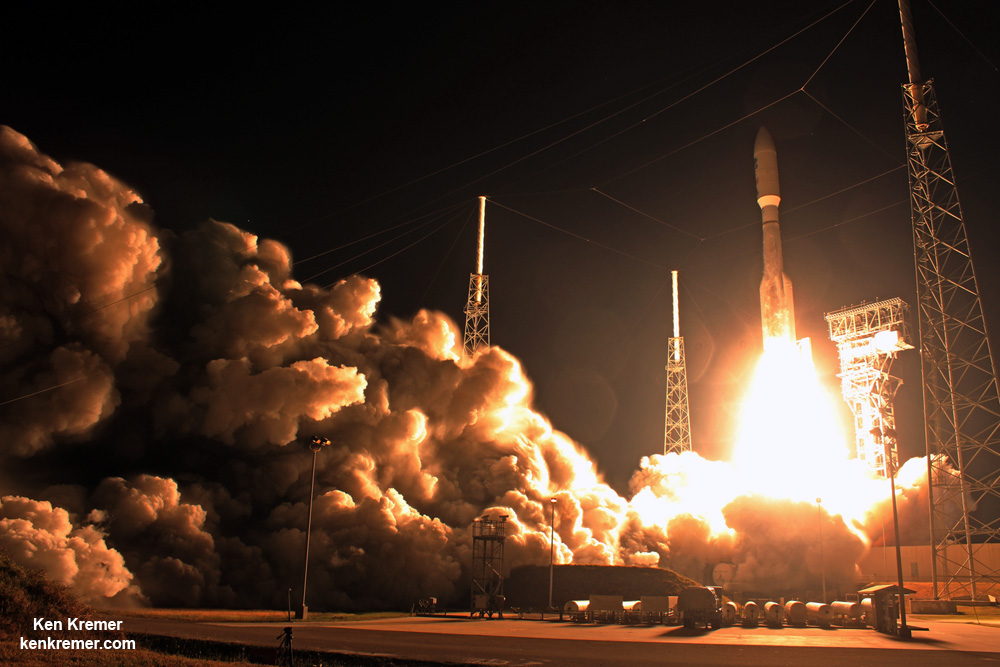
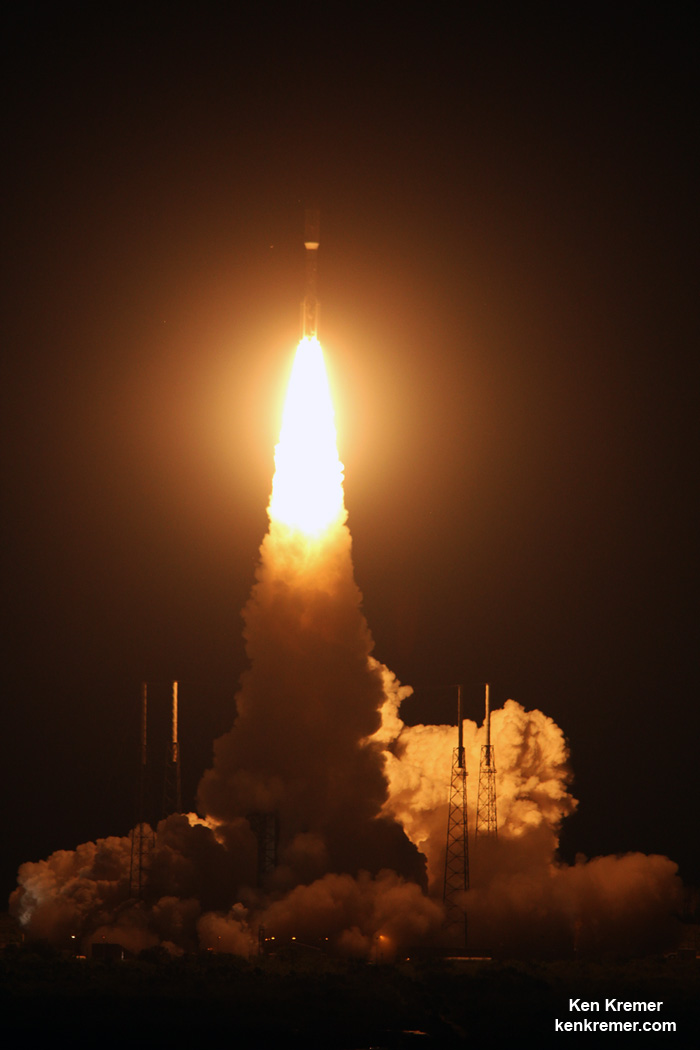
Blastoff of revolutionary NASA/NOAA GOES-R (Geostationary Operational Environmental Satellite - R Series) on a ULA Atlas V from Space Launch Complex 41 (SLC-41) on Cape Canaveral Air Force Station, Florida on Nov. 19, 2016 - as seen from the VAB roof. GOES-R will soon deliver a quantum leap in America’s weather forecasting capabilities. Credit: Ken Kremer/kenkremer.com
Blastoff of revolutionary NASA/NOAA GOES-R (Geostationary Operational Environmental Satellite – R Series) on a ULA Atlas V from Space Launch Complex 41 (SLC-41) on Cape Canaveral Air Force Station, Florida on Nov. 19, 2016 – as seen from the VAB roof. GOES-R will soon deliver a quantum leap in America’s weather forecasting capabilities. Credit: Ken Kremer/kenkremer.com
Liftoff of the highly advanced Geostationary Operational Environmental Satellite-R (GOES-R) weather observatory bolted atop a ULA Atlas V rocket came at 6:42 p.m. EST on Saturday, Nov. 19, 2016 from Space Launch Complex 41 (SLC-41) on Cape Canaveral Air Force Station, Florida.
The launch was delayed for an hour until the very end of the launch window to deal with unexpected technical and Eastern range issues, that only added more drama and changed the sunset launch into a night launch for the hordes of spectators who gathered here from around the world – appropriate since this probe will touch the lives of humans world wide.
“It’s a dramatic leap in capability – like moving from black and white TV to HDTV,” explained Greg Mandt, the NOAA GOES-R program manager during a prelaunch media briefing in the cleanroom processing facility at Astrotech.
“This is a very exciting time,” explained Greg Mandt, the NOAA GOES-R program manager during the Astrotech cleanroom briefing.
“This is the culmination of about 15 years of intense work for the great team of NOAA and NASA and our contractors Lockheed Martin and Harris.”
“We are bringing the nation a new capability. The GOES program has been around for about 40 years and most every American sees it every night on the weather broadcasts when they see go to the satellite imagery. And what’s really exciting is that for the first time in that 40 years we are really end to end replacing the entire GOES system. The weather community is really excited about what we are bringing.”
GOES-R will bring about a “quantum leap” in weather forecasting capabilities that will soon lead to more accurate and timely forecasts, watches and warnings for the Earth’s Western Hemisphere when it becomes fully operational in about a year.
But the first images are expected within weeks! And both researchers and weather forecasters can’t wait to see, analyze and put to practical use the sophisticated new images and data that will improve forecasts and save lives during extreme weather events that are occurring with increasing frequency.
Blastoff of revolutionary NASA/NOAA GOES-R (Geostationary Operational Environmental Satellite – R Series) on ULA Atlas V from Space Launch Complex 41 (SLC-41) on Cape Canaveral Air Force Station, Florida on Nov. 19, 2016. GOES-R will deliver a quantum leap in America’s weather forecasting capabilities. Credit: Ken Kremer/kenkremer.com
GOES-R will be renamed GOES-16 after it reaches its final orbit 22,000 above Earth about two weeks from now.
Over the next year, teams of engineers and scientists will check out and validate the state of the art suite of six science instruments that also includes the first operational lightning mapper in geostationary orbit – dubbed the Geostationary Lightning Mapper (GLM).
“The launch of GOES-R represents a major step forward in terms of our ability to provide more timely and accurate information that is critical for life-saving weather forecasts and warnings,” said Thomas Zurbuchen, associate administrator for NASA’s Science Mission Directorate in Washington.
“It also continues a decades-long partnership between NASA and NOAA to successfully build and launch geostationary environmental satellites.”
GOES-R, which stands for Geostationary Operational Environmental Satellite – R Series – is a new and advanced transformational weather satellite that will vastly enhance the quality, speed and accuracy of weather forecasting available to forecasters for Earth’s Western Hemisphere.
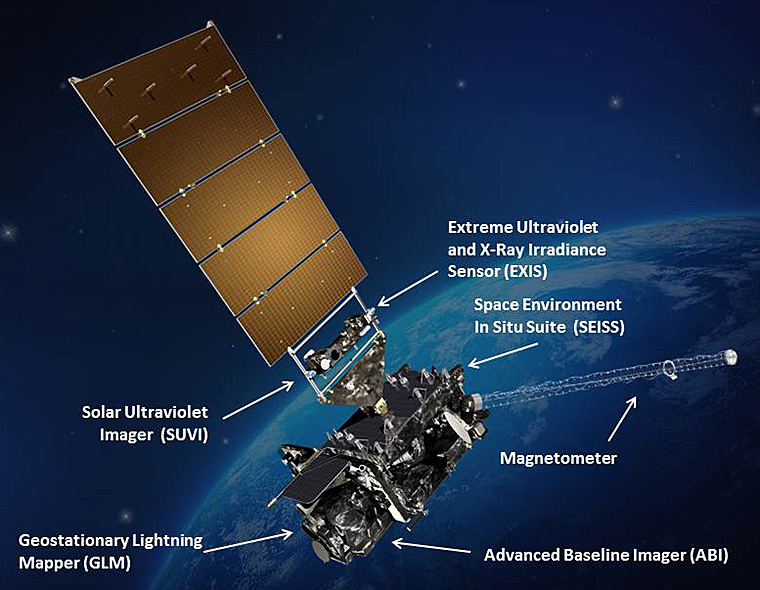
The science suite includes the Advanced Baseline Imager (ABI), Geostationary Lightning Mapper (GLM), Solar Ultraviolet Imager (SUVI), Extreme Ultraviolet and X-Ray Irradiance Sensors (EXIS), Space Environment In-Situ Suite (SEISS), and the Magnetometer (MAG).
ABI is the primary instrument and will collect 3 times more spectral data with 4 times greater resolution and scans 5 times faster than ever before – via the primary Advanced Baseline Imager (ABI) instrument – compared to the current GOES satellites.
So instead of seeing weather as it was, viewers will see weather as it is.
Whereas the current GOES-NOP imagers scan the full hemispheric disk in 26 minutes, the new GOES-ABI can simultaneously scan the Western Hemisphere every 15 minutes, the Continental U.S. every 5 minutes and areas of severe weather every 30-60 seconds.
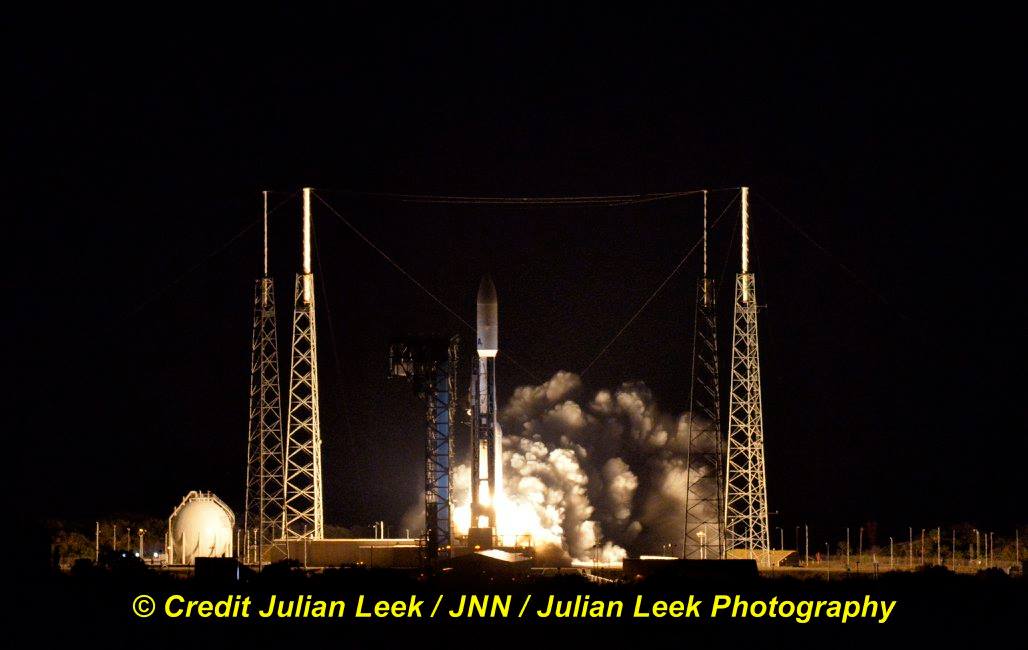
Launch of NASA/NOAA GOES-R weather observatory on ULA Atlas V on Nov. 19, 2016 from pad 41 on Cape Canaveral Air Force Station, Florida. Credit: Julian Leek
“The next generation of weather satellites is finally here,” said NOAA Administrator Kathryn Sullivan.
“GOES-R will strengthen NOAA’s ability to issue life-saving forecasts and warnings and make the United States an even stronger, more resilient weather-ready nation.”
Blastoff of revolutionary NASA/NOAA GOES-R (Geostationary Operational Environmental Satellite – R Series) on a ULA Atlas V from Space Launch Complex 41 (SLC-41) on Cape Canaveral Air Force Station, Florida on Nov. 19, 2016 – as seen from the VAB roof. GOES-R will soon deliver a quantum leap in America’s weather forecasting capabilities. Credit: Ken Kremer/kenkremer.com
It is designed to last for a 15 year orbital lifetime.
The 11,000 pound satellite was built by prime contractor Lockheed Martin and is the first of a quartet of four identical satellites – comprising GOES-R, S, T, and U – at an overall cost of about $11 Billion. This will keep the GOES satellite system operational through 2036.
Today’s launch was the 10th of the year for ULA and the 113th straight successful launch since the company was formed in December 2006.
GOES-R launched on the Atlas V 541 configuration vehicle, augmented by four solid rocket boosters on the first stage. The payload fairing is 5 meters (16.4 feet) in diameter. The first stage is powered by the RD AMROSS RD-180 engine. And the Centaur upper stage is powered by a single-engine Aerojet Rocketdyne RL10C engine.
This was only the fourth Atlas V launch employing the 541 configuration.
Stay tuned here for Ken’s continuing Earth and Planetary science and human spaceflight news.
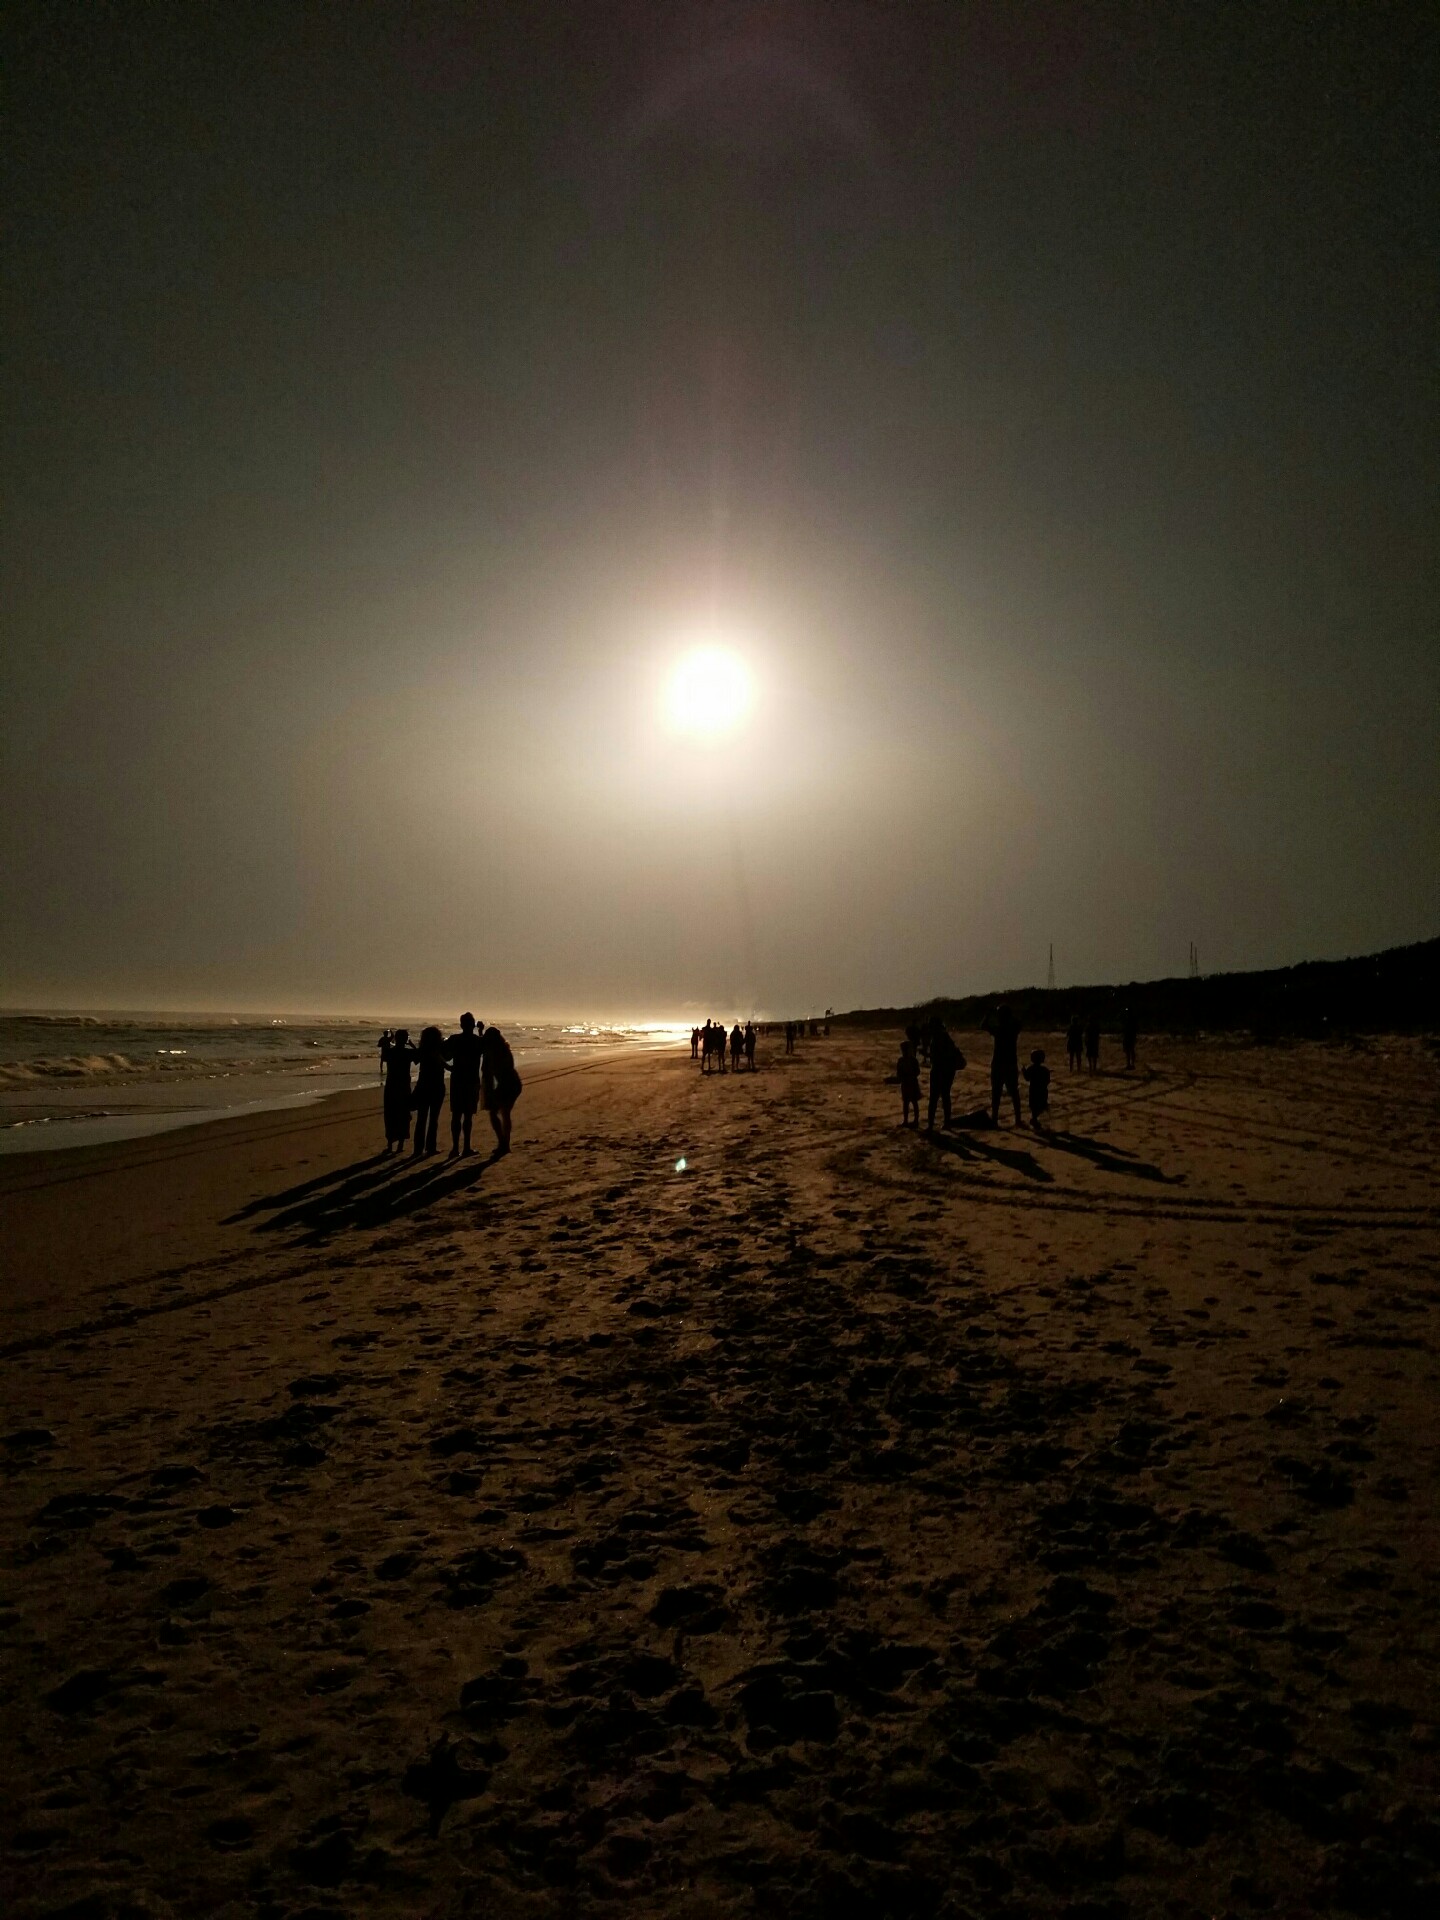
The NASA/NOAA GOES-R (Geostationary Operational Environmental Satellite – R Series) is poised for launch on a ULA Atlas V from Cape Canaveral, Florida on Nov. 19, 2016. GOES-R will be America’s most advanced weather satellite. Credit: Ken Kremer/kenkremer.comLaunch of NASA/NOAA GOES-R weather observatory on ULA Atlas V on Nov. 19, 2016 from pad 41 on Cape Canaveral Air Force Station, Florida, as seen from Playalinda beach. Credit: Jillian Laudick
………….
Learn more about GOES-R weather satellite, Heroes and Legends at KSCVC, OSIRIS-REx, InSight Mars lander, ULA, SpaceX and Orbital ATK missions, Juno at Jupiter, SpaceX AMOS-6 & CRS-9 rocket launch, ISS, ULA Atlas and Delta rockets, Orbital ATK Cygnus, Boeing, Space Taxis, Mars rovers, Orion, SLS, Antares, NASA missions and more at Ken’s upcoming outreach events:
Nov 19-20: “GOES-R weather satellite launch, OSIRIS-Rex, SpaceX and Orbital ATK missions to the ISS, Juno at Jupiter, ULA Delta 4 Heavy spy satellite, SLS, Orion, Commercial crew, Curiosity explores Mars, Pluto and more,” Kennedy Space Center Quality Inn, Titusville, FL, evenings
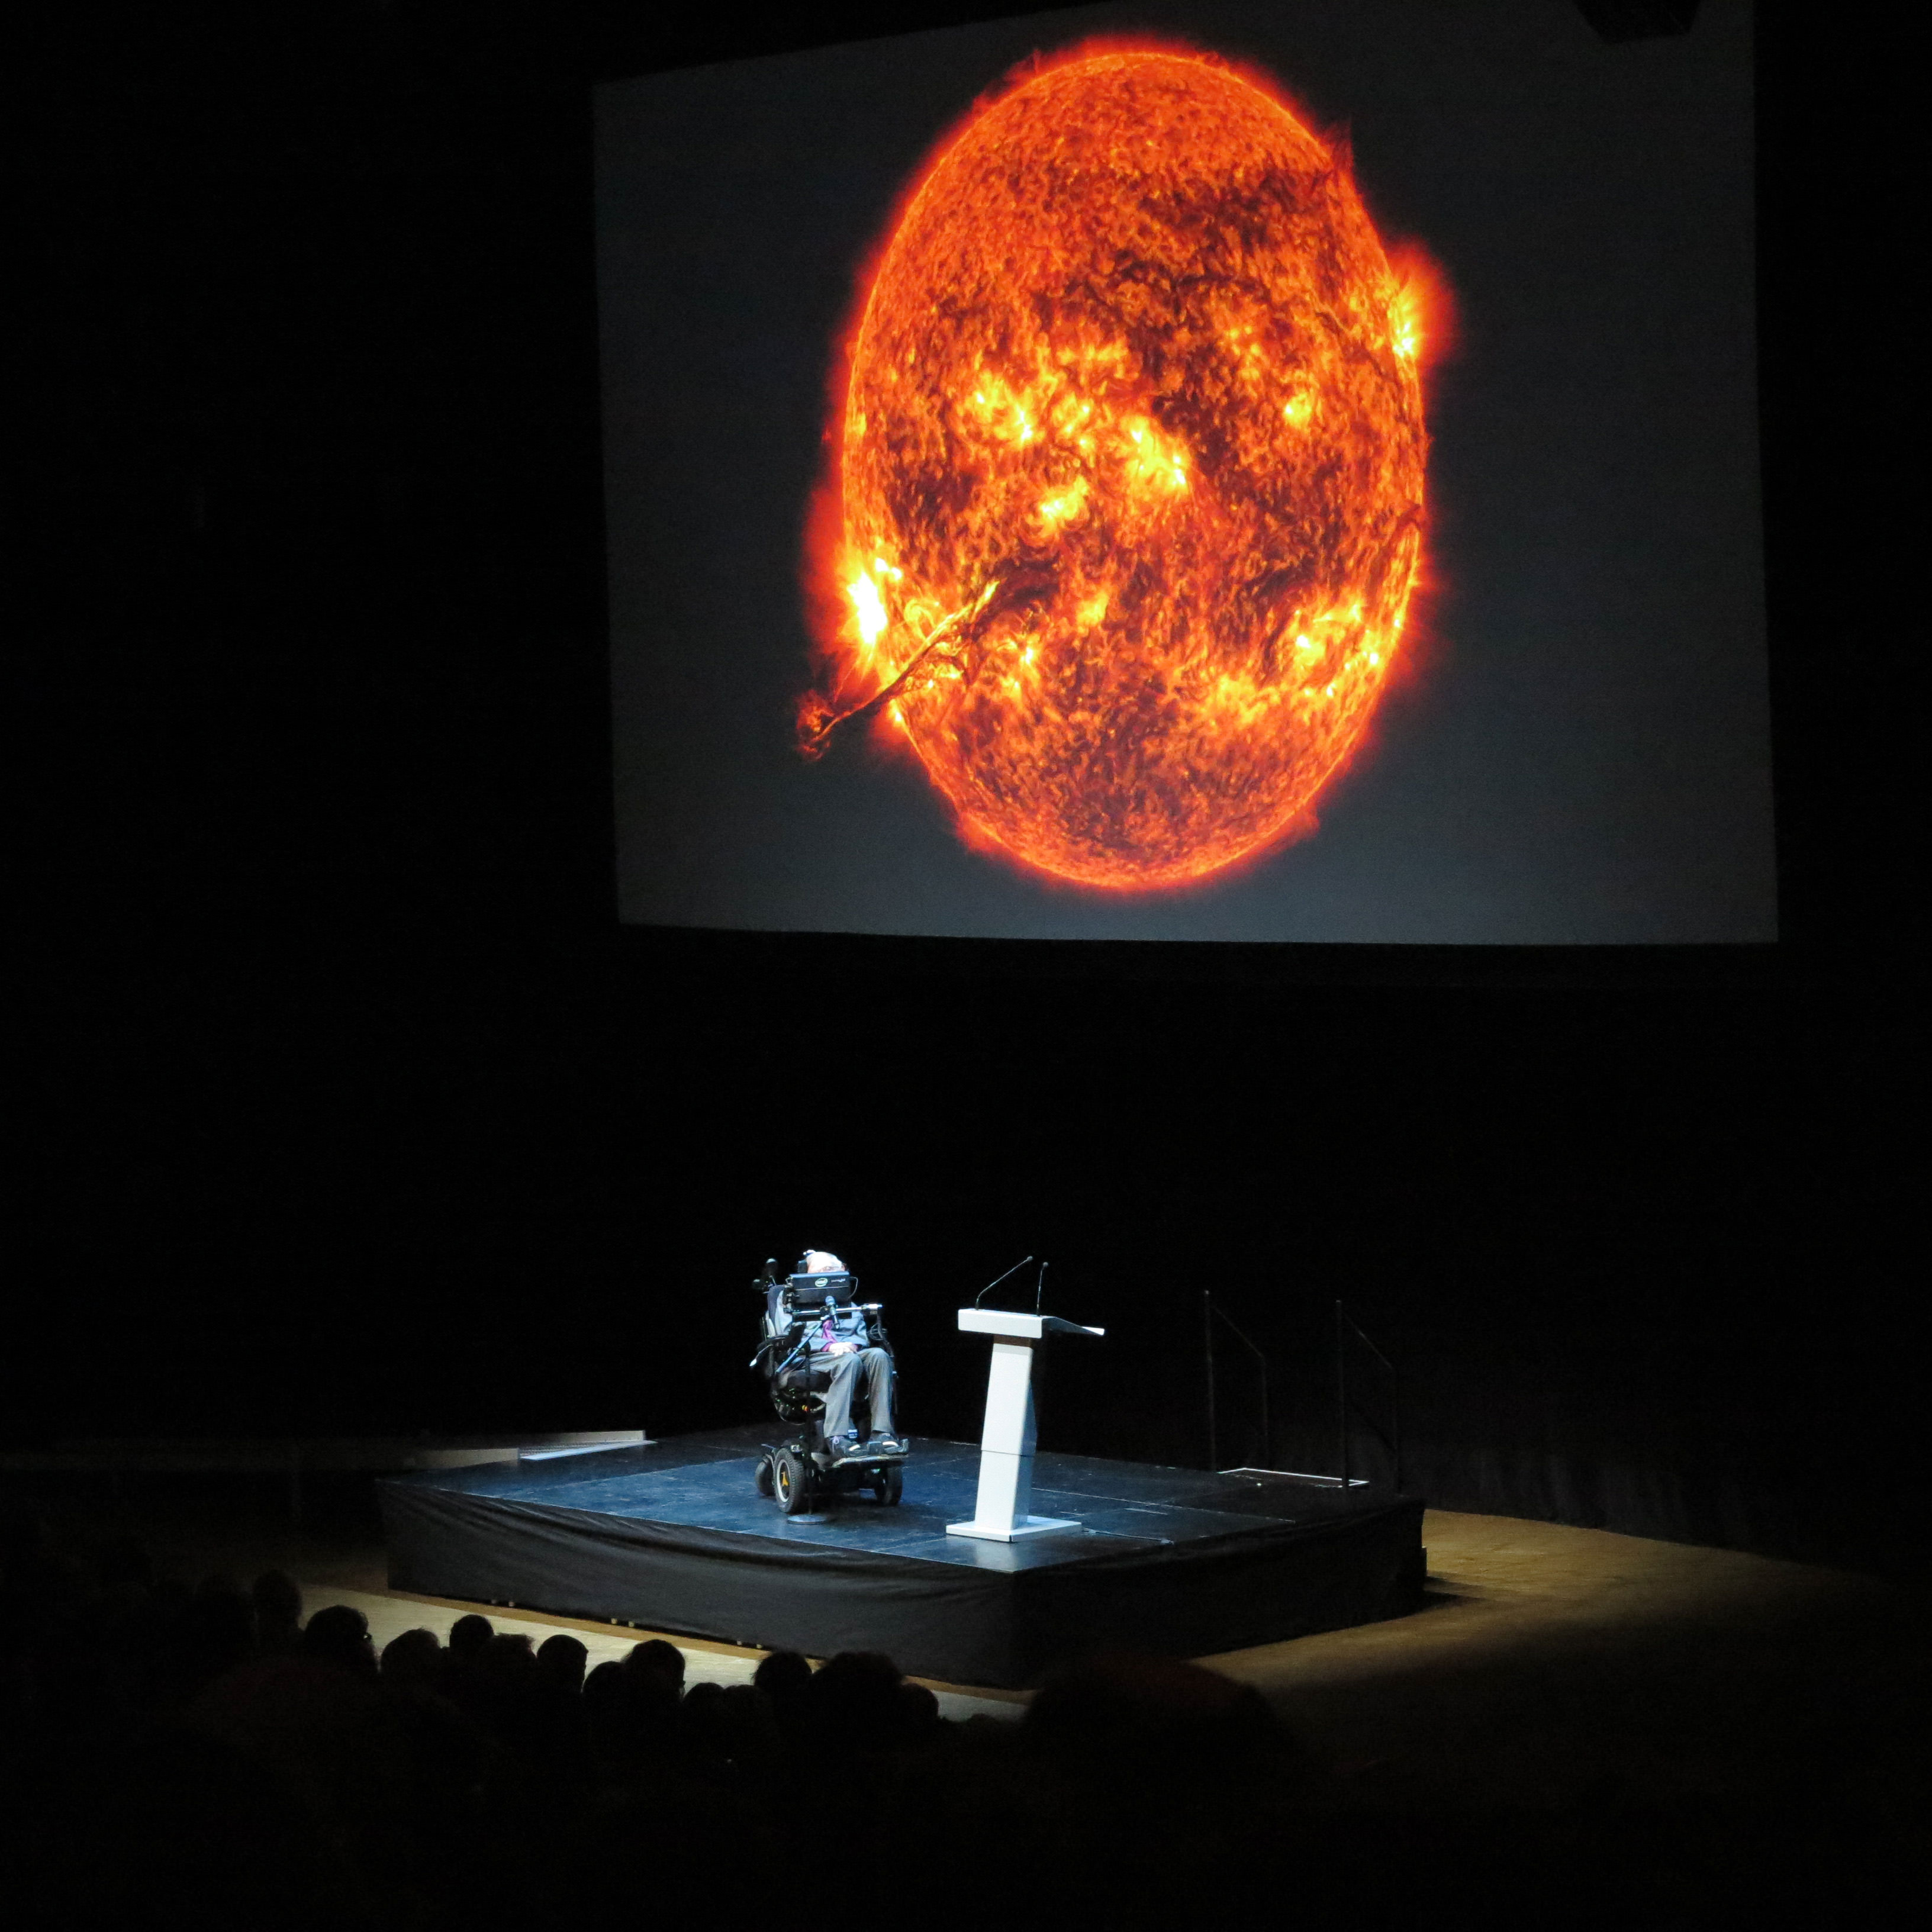
Stephen Hawking recently issued some more dire warnings for humanity, saying that we have 1000 years to find a new planet. Credit: Public Domain/photo by Alexandar Vujadinovic
It has been argued that the greatest reason our species should explore space and colonize other planets is so that a cataclysmic fate won’t be able to claim all of humanity. That is the driving force behind Elon Musk’s plan to colonize Mars. And it has certainly been the driving point behind Stephen Hawking’s belief that humanity should become an interplanetary-species.
And according to Hawking, becoming interplanetary is something of a time-sensitive issue. During a recent speech presented at the Oxford Union Society (Oxford University’s prestigious debating society) Hawking laid it out plainly for the audience. Humanity has 1000 years to locate and colonize new planets, he claimed, or we will likely go extinct.
For almost 200 years, the Oxford Union Society has been a forum for intellectual debate. In the past, it has also hosted such speakers as the Dalai Lama, Stephen Fry, Morgan Freeman, Richard Dawkins, and Buzz Aldrin. On this occasion, Hawking addressed a crowd of students and professors about space exploration and humanity’s future – two subjects he’s well versed in!
Stephen Hawking is a major proponent for colonizing other worlds, mainly to ensure humanity does not go extinct. Credit: educatinghumanity.com
As Hawking made clear, humanity faces a number of existential threats, many of which are going to become a serious problem during the 21 century century. These include, but are not limited to, the threat of Climate Change, nuclear holocaust, terrorism, and the rise of artificial intelligence. The solution, Hawking argued, is to get into space and establish colonies as soon as possible.
As he was quoted as saying by the Christian Science Monitor, this will need to take place within the next 1000 years:
“Although the chance of a disaster to planet Earth in a given year may be quite low, it adds up over time, and becomes a near certainty in the next 1,000 or 10,000 years. By that time we should have spread out into space, and to other stars, so a disaster on Earth would not mean the end of the human race.”
This was not the first time Hawking has expressed concerns about the future. In January of 2015, Hawking joined Elon Musk and many other AI experts to pen the “Research Priorities for Robust and Beneficial Artificial Intelligence” – aka. the “Open Letter on Artificial Intelligence”. In this letter, he and the other signatories raised concerns about the short-term and long-term implications of AI, and urged that steps be taken to address them.
President Barack Obama talks with Stephen Hawking in the Blue Room of the White House before a ceremony presenting him and 15 others the Presidential Medal of Freedom on August 12th, 2009. Credit: whitehouse.gov/Pete Souza
In addition, back in January of 2016, Hawking warned that humanity’s technological progress has the power to outstrip us. This occurred during his speech at the 2016 Leith Lectures, where Hawking spoke about black holes and why they are fascinating. During the Q&A period that followed, Hawking turned to the much more dour subject of whether or not humanity has a future. As he said at the time:
“We face a number of threats to our survival, from nuclear war, catastrophic global warming, and genetically engineered viruses. The number is likely to increase in the future, with the development of new technologies, and new ways things can go wrong. However, we will not establish self-sustaining colonies in space for at least the next hundred years, so we have to be very careful in this period. Most of the threats we face come from the progress we have made in science and technology. We are not going to stop making progress, or reverse it, so we have to recognize the dangers and control them. I am an optimist, and I believe we can.”
Similarly, Hawking indicated back in 2010 that humanity’s survival beyond the next century would require that we become a space-faring race. In an interview with Big Think, Hawking claimed the odds of humanity making it to the 22nd century was bad enough for a single-planet species, let alone the 31st:
“I believe that the long-term future of the human race must be in space. It will be difficult enough to avoid disaster on planet Earth in the next hundred years, let alone the next thousand, or million. The human race shouldn’t have all its eggs in one basket, or on one planet. Let’s hope we can avoid dropping the basket until we have spread the load.”
Hawking has repeatedly advocated space exploration and colonization as a way of ensuring humanity’s survival. Credit: NASA/MSFC
But before anyone gets all gloomy, it should be noted that between our plans to colonize Mars, and the success of the Kepler mission, we have found hundreds of planets that could serve as potential homes for humanity. But as Hawking has stated in the past, we will need at least 100 years to develop all the necessary technologies to build colonies on even the closest of these planets (Mars).
Beyond our survival as a species, Professor Hawking also advocates space travel as a way of improving humanity’s understanding of itself. This was made evident in a direct quote that the Union live-tweeted during the speech, in which he said: “We must continue exploring space in order to improve our knowledge of humanity. We must go beyond our humble planet.”
And as he has done so often before, Hawking ended his speech on an optimistic note. According to the Independent, he wrapped up his Oxford lecture with the following words of advice:
“Remember to look up at the stars and not down at your feet. Try to make sense of what you see, wonder about what makes the universe exist. Be curious. However difficult life may seem, there is always something you can do and succeed at. It matters that you don’t just give up.”
It seems we have our work cut out for us. Extra-terrestrial and/or extra-solar colonies by 3016… or bust!
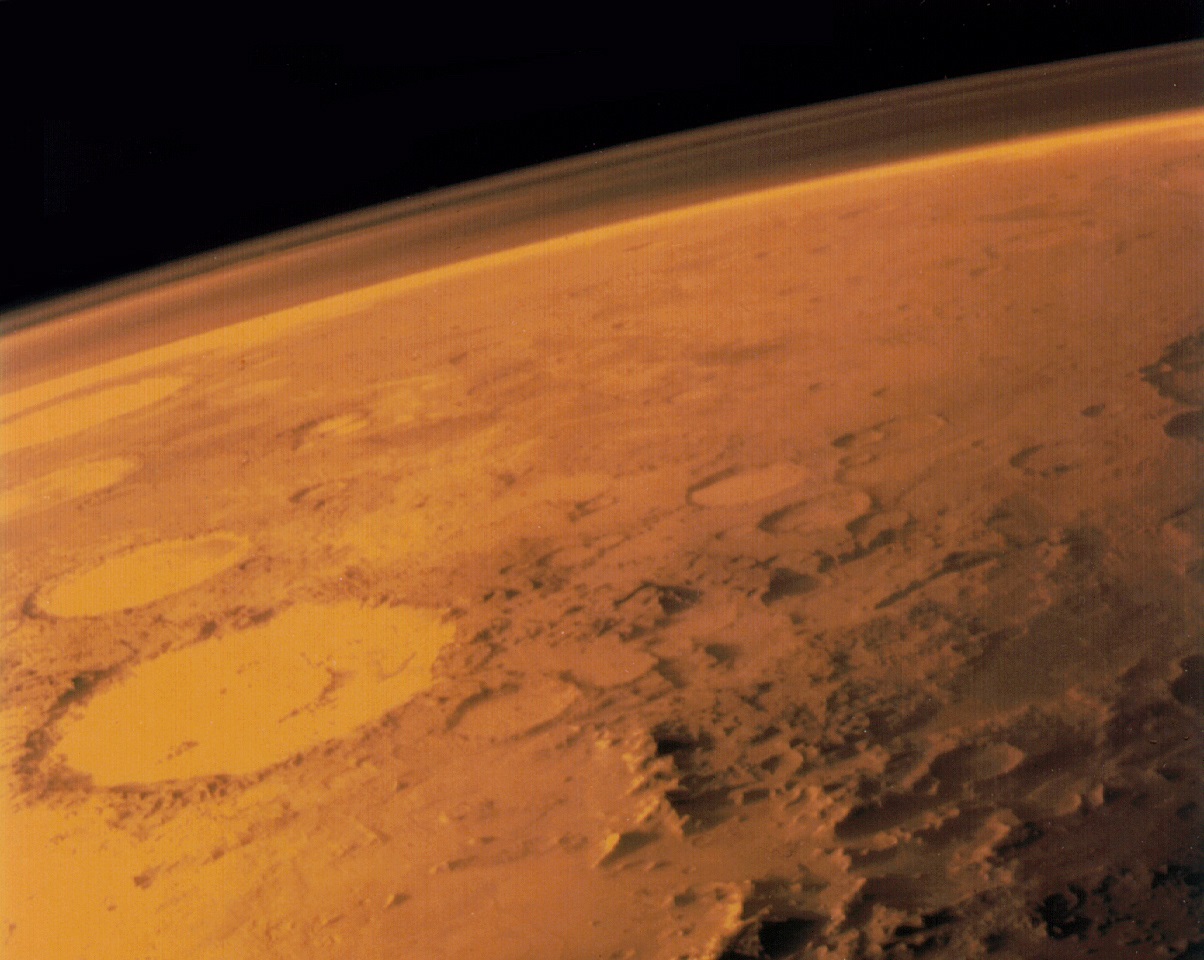
Image taken by the Viking 1 orbiter in June 1976, showing Mars thin atmosphere and dusty, red surface. Credits: NASA/Viking 1
Human exploration of Mars has been ramping up in the past few decades. In addition to the eight active missions on or around the Red Planet, seven more robotic landers, rovers and orbiters are scheduled to be deployed there by the end of the decade. And by the 2030s and after, several space agencies are planning to mount crewed missions to the surface as well.
On top of that, there are even plenty of volunteers who are prepared to make a one-way journey to Mars, and people advocating that we turn it into a second home. All of these proposals have focused attention on the peculiar hazards that come with sending human beings to Mars. Aside from its cold, dry environment, lack of air, and huge sandstorms, there’s also the matter of its radiation.
Causes:
Mars has no protective magnetosphere, as Earth does. Scientists believe that at one time, Mars also experienced convection currents in its core, creating a dynamo effect that powered a planetary magnetic field. However, roughly 4.2 billions year ago – either due to a massive impact from a large object, or rapid cooling in its core – this dynamo effect ceased.
Artist’s rendering of a solar storm hitting Mars and stripping ions from the planet’s upper atmosphere. Credits: NASA/GSFC
As a result, over the course of the next 500 million years, Mars atmosphere was slowly stripped away by solar wind. Between the loss of its magnetic field and its atmosphere, the surface of Mars is exposed to much higher levels of radiation than Earth. And in addition to regular exposure to cosmic rays and solar wind, it receives occasional lethal blasts that occur with strong solar flares.
Investigations:
NASA’s 2001 Mars Odyssey spacecraft was equipped with a special instrument called the Martian Radiation Experiment (or MARIE), which was designed to measure the radiation environment around Mars. Since Mars has such a thin atmosphere, radiation detected by Mars Odyssey would be roughly the same as on the surface.
Over the course of about 18 months, the Mars Odyssey probe detected ongoing radiation levels which are 2.5 times higher than what astronauts experience on the International Space Station – 22 millirads per day, which works out to 8000 millirads (8 rads) per year. The spacecraft also detected 2 solar proton events, where radiation levels peaked at about 2,000 millirads in a day, and a few other events that got up to about 100 millirads.
For comparison, human beings in developed nations are exposed to (on average) 0.62 rads per year. And while studies have shown that the human body can withstand a dose of up to 200 rads without permanent damage, prolonged exposure to the kinds of levels detected on Mars could lead to all kinds of health problems – like acute radiation sickness, increased risk of cancer, genetic damage, and even death.
Diagram showing the amount of cosmic radiation the surface of Mars is exposed to. Credit: NASA
And given that exposure to any amount of radiation carries with it some degree of risk, NASA and other space agencies maintain a strict policy of ALARA (As-Low-As-Reasonable-Achievable) when planning missions.
Possible Solutions:
Human explorers to Mars will definitely need to deal with the increased radiation levels on the surface. What’s more, any attempts to colonize the Red Planet will also require measures to ensure that exposure to radiation is minimized. Already, several solutions – both short term and long- have been proposed to address this problem.
For example, NASA maintains multiple satellites that study the Sun, the space environment throughout the Solar System, and monitor for galactic cosmic rays (GCRs), in the hopes of gaining a better understanding of solar and cosmic radiation. They’ve also been looking for ways to develop better shielding for astronauts and electronics.
In 2014, NASA launched the Reducing Galactic Cosmic Rays Challenge, an incentive-based competition that awarded a total of $12,000 to ideas on how to reduce astronauts’ exposure to galactic cosmic rays. After the initial challenge in April of 2014, a follow-up challenge took place in July that awarded a prize of $30,000 for ideas involving active and passive protection.
When it comes to long-term stays and colonization, several more ideas have been floated in the past. For instance, as Robert Zubrin and David Baker explained in their proposal for a low-cast “Mars Direct” mission, habitats built directly into the ground would be naturally shielded against radiation. Zubrin expanded on this in his 1996 bookThe Case for Mars: The Plan to Settle the Red Planet and Why We Must.
Proposals have also been made to build habitats above-ground using inflatable modules encased in ceramics created using Martian soil. Similar to what has been proposed by both NASA and the ESA for a settlement on the Moon, this plan would rely heavily on robots using 3D printing technique known as “sintering“, where sand is turned into a molten material using x-rays.
MarsOne, the non-profit organization dedicated to colonizing Mars in the coming decades, also has proposals for how to shield Martian settlers. Addressing the issue of radiation, the organization has proposed building shielding into the mission’s spacecraft, transit vehicle, and habitation module. In the event of a solar flare, where this protection is insufficient, they advocate creating a dedicated radiation shelter (located in a hollow water tank) inside their Mars Transit Habitat.
But perhaps the most radical proposal for reducing Mars’ exposure to harmful radiation involves jump-starting the planet’s core to restore its magnetosphere. To do this, we would need to liquefy the planet’s outer core so that it can convect around the inner core once again. The planet’s own rotation would begin to create a dynamo effect, and a magnetic field would be generated.
Artist impression of a Mars settlement with cutaway view. Credit: NASA Ames Research Center
According to Sam Factor, a graduate student with the Department of Astronomy at the University of Texas, there are two ways to do this. The first would be to detonate a series of thermonuclear warheads near the planet’s core, while the second involves running an electric current through the planet, producing resistance at the core which would heat it up.
In addition, a 2008 study conducted by researchers from the National Institute for Fusion Science (NIFS) in Japan addressed the possibility of creating an artificial magnetic field around Earth. After considering continuous measurements that indicated a 10% drop in intensity in the past 150 years, they went on to advocate how a series of planet-encircling superconducting rings could compensate for future losses.
With some adjustments, such a system could be adapted for Mars, creating an artificial magnetic field that could help shield the surface from some of the harmful radiation it regularly receives. In the event that terraformers attempt to create an atmosphere for Mars, this system could also ensure that it is protected from solar wind.
Lastly, a study in 2007 by researchers from the Institute for Mineralogy and Petrology in Switzerland and the Faculty of Earth and Life Sciences at Vrije University in Amsterdam managed to replicate what Mars’ core looks like. Using a diamond chamber, the team was able to replicate pressure conditions on iron-sulfur and iron-nickel-sulfur systems that correspond to the center of Mars.
What they found was that at the temperatures expected in the Martian core (~1500 K, or 1227 °C; 2240 °F), the inner core would be liquid, but some solidification would occur in the outer core. This is quite different from Earth’s core, where the solidification of the inner core releases heat that keeps the outer core molten, thus creating the dynamo effect that powers our magnetic field.
The absence of a solid inner core on Mars would mean that the once-liquid outer core must have had a different energy source. Naturally, that heat source has since failed, causing the outer core to solidify, thus arresting any dynamo effect. However, their research also showed that planetary cooling could lead to core solidification in the future, either due to iron-rich solids sinking towards the center or iron-sulfides crystallizing in the core.
In other words, Mars’ core might become solid someday, which would heat the outer core and turn it molten. Combined with the planet’s own rotation, this would generate the dynamo effect that would once again fire up the planet’s magnetic field. If this is true, then colonizing Mars and living there safely could be a simple matter of waiting for the core to crystallize.
There’s no way around it. At present, the radiation on the surface of Mars is pretty hazardous! Therefore, any crewed missions to the planet in the future will need to take into account radiation shielding and counter-measures. And any long-term stays there – at least for the foreseeable future – are going to have to be built into the ground, or hardened against solar and cosmic rays.
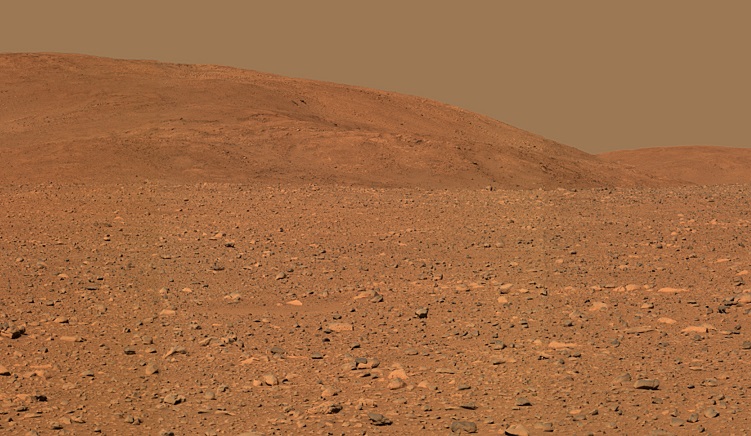
Approximate true-color rendering of the central part of the “Columbia Hills”, taken by NASA’s Mars Exploration Rover Spirit panoramic camera. Credit: NASA/JPL
But you know what they say about necessity being the mother of invention, right? And with such luminaries as Stephen Hawking saying that we need to start colonizing other worlds in order to survive as a species, and people like Elon Musk and Bas Lansdrop looking to make it happen, we’re sure to see some very inventive solutions in the coming generations!
If you want, learn more about the MARIE instrument on board NASA’s Mars Odyssey spacecraft, and the radiation risks humans will face trying to go to Mars.
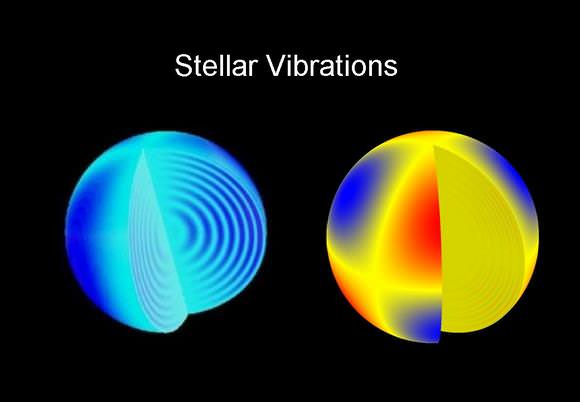
At one time, scientists believed that the Earth, the Moon, and all the other planets in our Solar System were perfect spheres. The same held true for the Sun, which they considered to be the heavenly orb that was the source of all our warmth and energy. But as time and research showed, the Sun is far from perfect. In addition to sunspots and solar flares, the Sun is not completely spherical.
For some time, astronomers believed this was the case with other stars as well. Owing to a number of factors, all stars previously studied by astronomers appeared to experience some bulging at the equator (i.e. oblateness). However, in a study published by a team of international astronomers, it now appears that a slowly rotating star located 5000 light years away is as close to spherical as we’ve ever seen!
Until now, observation of stars has been confined to only a few of the fastest-rotating nearby stars, and was only possible through interferometry. This technique, which is typically used by astronomers to obtain stellar size estimates, relies on multiple small telescopes obtaining electromagnetic readings on a star. This information is then combined to create a higher-resolution image that would be obtained by a large telescope.
Artist’s impression of a Sirius, an A-type Main Sequence White star. Credit: NASA, ESA and G. Bacon (STScI)
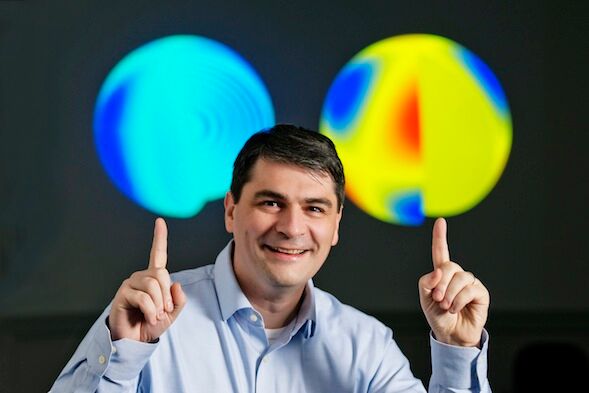
Laurent Gizon, a researcher with the Max Planck Institute, was the lead authjor on the paper. As he explained their research methodology to Universe Today via email:
“The new method that we propose in this paper to measure stellar shapes, asteroseismology, can be several orders of magnitude more precise than optical interferometry. It applies only to stars that oscillate in long-lived non-radial modes. The ultimate precision of the method is given by the precision on the measurement of the frequencies of the modes of oscillation. The longer the observation duration (four years in the case of Kepler), the better the precision on the mode frequencies. In the case of KIC 11145123 the most precise mode frequencies can be determined to one part in 10,000,000. Hence the astonishing precision of asteroseismology.”
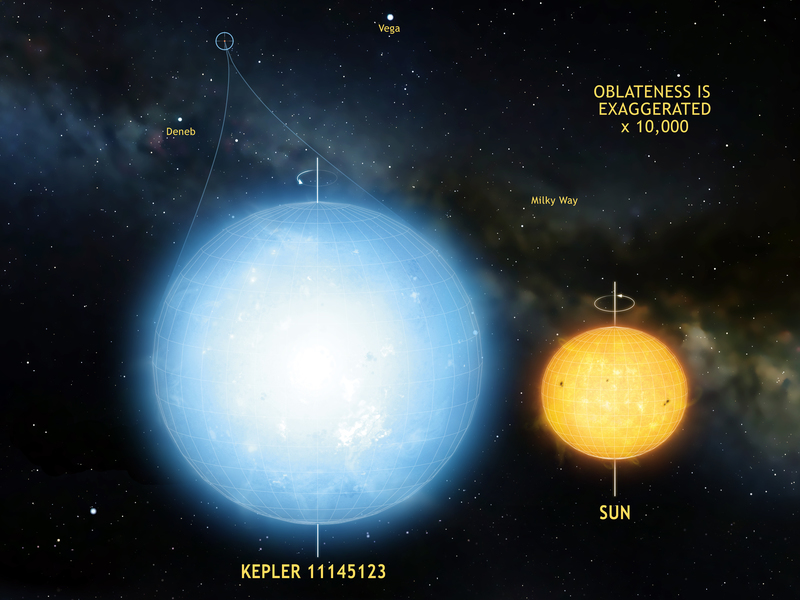
Located 5000 light years away from Earth, KIC 11145123 was considered a perfect candidate for this method. For one, Kepler 11145123 is a hot and luminous, over twice the size of our Sun, and rotates with a period of 100 days. Its oscillations are also long-lived, and correspond directly to fluctuations in its brightness. Using data obtained by NASA’s Kepler mission over a more than four year period, the team was able to get very accurate shape estimates.
The variations in brightness can be interpreted as vibrations, or oscillations within the stars, using a technique called asteroseismology. Credit: Kepler Astroseismology team.
“We compared the frequencies of the modes of oscillation that are more sensitive to the low-latitude regions of the star to the frequencies of the modes that are more sensitive to higher latitudes,” said Gizon. “This comparison showed that the difference in radius between the equator and the poles is only 3 km with a precision of 1 km. This makes Kepler 11145123 the roundest natural object ever measured, it is even more round than the Sun.”
For comparison, our Sun has a rotational period of about 25 days, and the difference between its polar and equatorial radii is about 10 km. And on Earth, which has a rotational period of less than a day (23 hours 56 minutes and 4.1 seconds), there is a difference of over 23 km (14.3 miles) between its polar and equator. The reason for this considerable difference is something of a mystery.
In the past, astronomers have found that the shape of a star can come down to multiple factors – such as their rotational velocity, magnetic fields, thermal asphericities, large-scale flows, strong stellar winds, or the gravitational influence of stellar companions or giant planets. Ergo, measuring the “asphericity” (i.e. the degree to which a star is NOT a sphere) can tell astronomers much about the star structures and its system of planets.
Ordinarily, rotational velocity has been seen to have a direct bearing on the stars asphericity – i.e. the faster it rotates, the more oblate it is. However, when looking at data obtained by the Kepler probe over a period of four years, they noticed that its oblateness was only a third of what they expected, given its rotational velocity.
Laurent Gizon, the lead researcher of the study, pictured with asteroseismic readings of Kepler 11145123. Credit: Max Planck Institute for Solar System Research, Germany.
As such, they were forced to conclude that something else was responsible for the star’s highly spherical shape. “”We propose that the presence of a magnetic field at low latitudes could make the star look more spherical to the stellar oscillations,” said Gizon. “It is known in solar physics that acoustic waves propagate faster in magnetic regions.”
Looking to the future, Gizon and his colleagues hope to examine other stars like Kepler 11145123. In our Galaxy alone, there are many stars who’s oscillations can be accurately measured by observing changes in their brightness. As such, the international team hopes to apply their asteroseismology method to other stars observed by Kepler, as well as upcoming missions like TESS and PLATO.
“Just like helioseismology can be used to study the Sun’s magnetic field, asteroseismology can be used to study magnetism on distant stars,” Gizon added. “This is the main message of this study.”
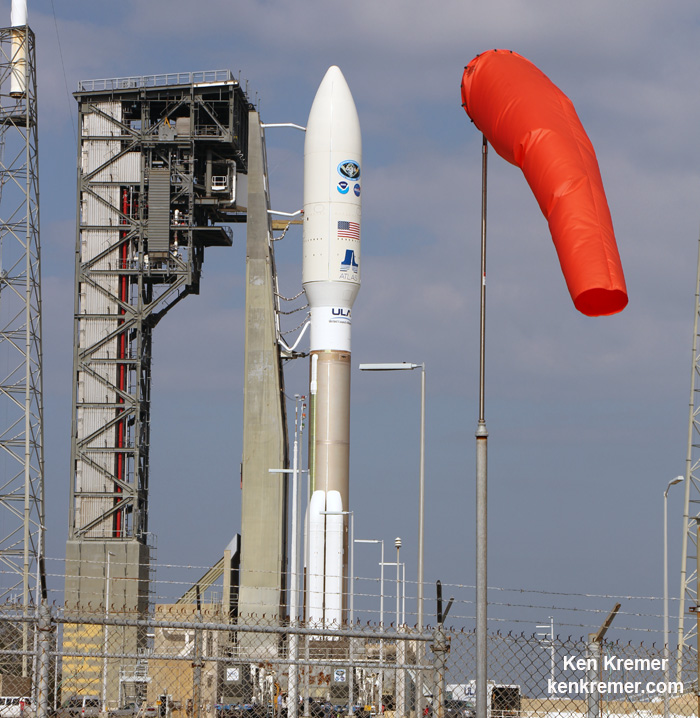
The NASA/NOAA GOES-R (Geostationary Operational Environmental Satellite - R Series) is poised for launch on a ULA Atlas V from Cape Canaveral, Florida on Nov. 19, 2016. GOES-R will be America’s most advanced weather satellite. Credit: Ken Kremer/kenkremer.com
The NASA/NOAA GOES-R (Geostationary Operational Environmental Satellite – R Series) is poised for launch on a ULA Atlas V from Cape Canaveral, Florida on Nov. 19, 2016. GOES-R will be America’s most advanced weather satellite. Credit: Ken Kremer/kenkremer.com
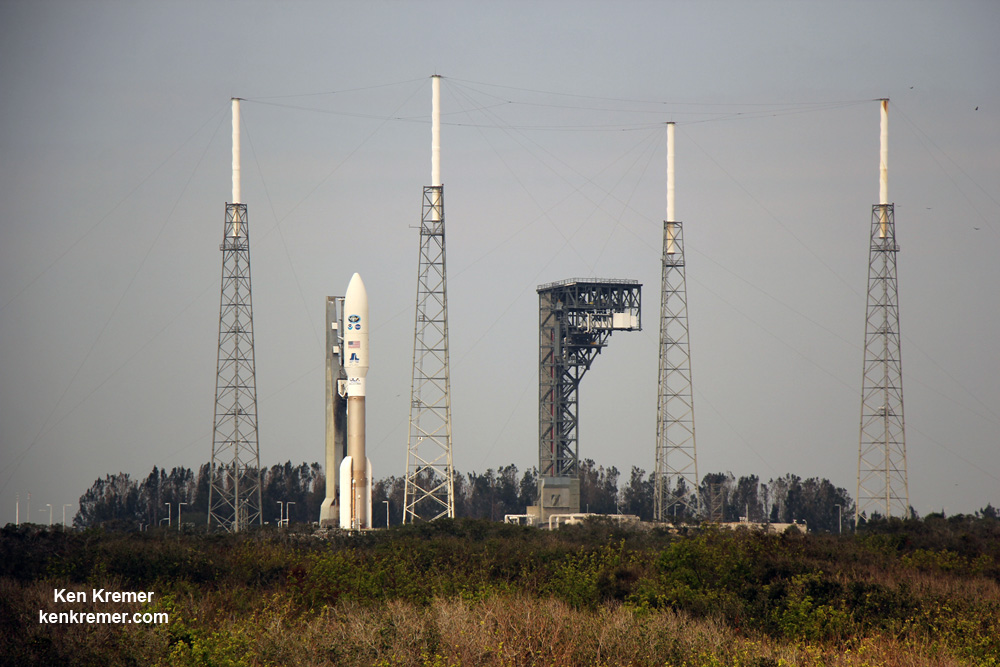
KENNEDY SPACE CENTER, FL – From both the technical and weather standpoint, the outlook is outstanding for Saturdays sunset blastoff of the NASA/NOAA GOES-R geostationary weather observation satellite that’s set to deliver a ‘quantum leap’ in weather forecasting on Nov. 19.
Everything is progressing as planned toward liftoff of the school bus sized GOES-R weather satellite atop a United Launch Alliance (ULA) Atlas V rocket on Saturday, Nov. 19 at 5:42 p.m. from Space Launch Complex 41 (SLC-41) on Cape Canaveral Air Force Station, just about 17 minutes after sunset.
“GOES-R offers a quantum leap above prior weather satellites, the greatest in 40 years,” said Steve Volz, assistant administrator, NOAA’s Satellite and Information Service, at the prelaunch news briefing at NASA’s Kennedy Space Center.
“GOES-R will be revolutionary with faster, more accurate forecasts and more lives saved.”
“It will take our capability for life saving forecasts to a new level and it will be a game changer.”
GOES-R, which stands for Geostationary Operational Environmental Satellite – R Series – is a new and advanced transformational weather satellite that will vastly enhance the quality, speed and accuracy of weather forecasting available to forecasters for Earth’s Western Hemisphere.
It will collect 3 times more spectral data with 4 times greater resolution and scans 5 times faster than ever before – via the primary Advanced Baseline Imager (ABI) instrument instrument – compared to the current GOES satellites.
So instead of seeing weather as it was, viewers will see weather as it is.
Whereas the current GOES-NOP imagers scan the full hemispheric disk in 26 minutes, the new GOES-ABI can simultaneously scan the Western Hemisphere every 15 minutes, the Continental U.S. every 5 minutes and areas of severe weather every 30-60 seconds.
The soar to space should be spectacular for locals and tourists gathering from around the world to view the launch now slated for less than 24 hours from now.
The launch window opens at 5:42 p.m.
The launch window extends for an hour from 5:42-6:42 p.m. EST.
Following a short delay, the Atlas V with GOES bolted on top was rolled out to pad 41 this morning, Friday, November. 18.
GOES-R is GO for launch.
NASA’s GOES-R launch coverage will be broadcast on NASA TV beginning at 4:45 p.m. EDT Nov. 19.
Coverage will conclude after spacecraft separation from the Centaur and the GOES-R solar arrays are deployed, which occurs approximately 3 ½ hours after launch. At that time the spacecraft initial state of health can be determined and will be confirmed on the air. There is no planned post-launch news conference.
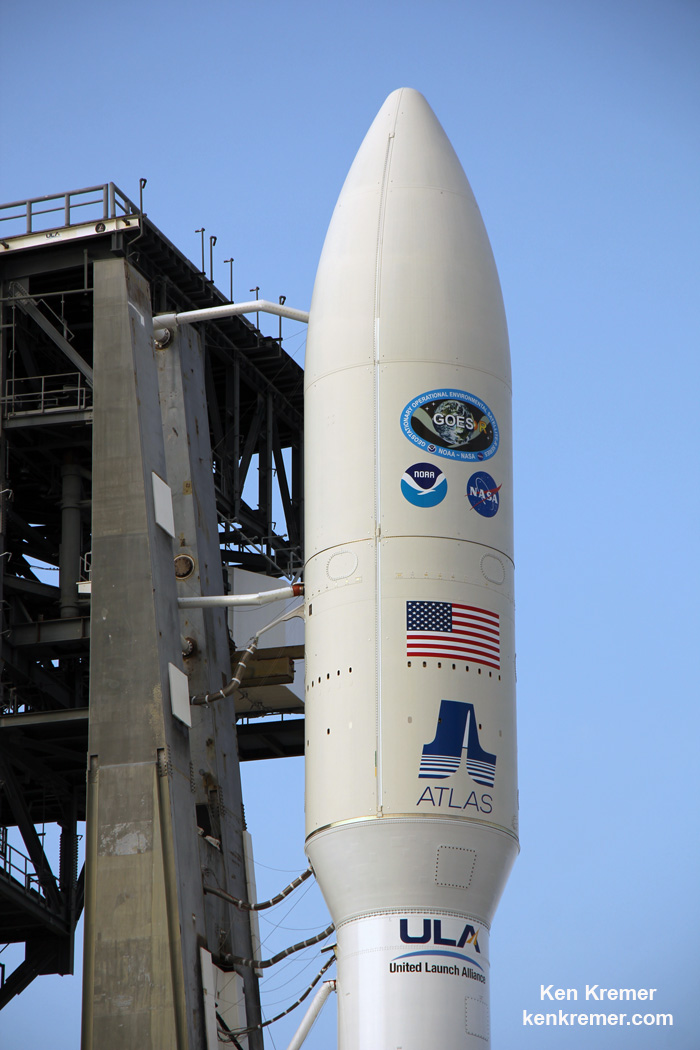
The NASA/NOAA GOES-R (Geostationary Operational Environmental Satellite – R Series) is encapsulated in the nose cone of a ULA Atlas V and rolls out for launch from Space Launch Complex-41 on Cape Canaveral Air Force Station, Florida on Nov. 19, 2016. GOES-R will be America’s most advanced weather satellite. Credit: Ken Kremer/kenkremer.com
The weather forecast shows a 90 percent chance of favorable weather conditions for Saturday’s sunset blastoff. The primary concern is for cumulous clouds.
In the event of a 24 hour delay, the weather forecast shows an 80 percent chance of favorable weather conditions on Sunday, Nov. 20.
The NASA/NOAA GOES-R (Geostationary Operational Environmental Satellite – R Series) is encapsulated in the nose cone of a ULA Atlas V set for launch from Space Launch Complex-41 on Cape Canaveral Air Force Station, Florida on Nov. 19, 2016. GOES-R will be America’s most advanced weather satellite. Credit: Ken Kremer/kenkremer.com
GOES-R is the first in a new series of American’s most powerful and most advanced next generation weather observation satellites. It is designed to last for a 15 year orbital lifetime.
The 11,000 pound satellite was built by prime contractor Lockheed Martin and is the first of a quartet of four identical satellites – comprising GOES-R, S, T, and U – at an overall cost of about $11 Billion. This will keep the GOES satellite system operational through 2036.
GOES-R will blastoff on a ULA Atlas V in the very powerful 541 configuration, augmented by four solid rocket boosters on the first stage. The payload fairing is 5 meters (16.4 feet) in diameter and the upper stage is powered by a single-engine Centaur.
It will be launched to a Geostationary orbit some 22,300 miles above Earth.
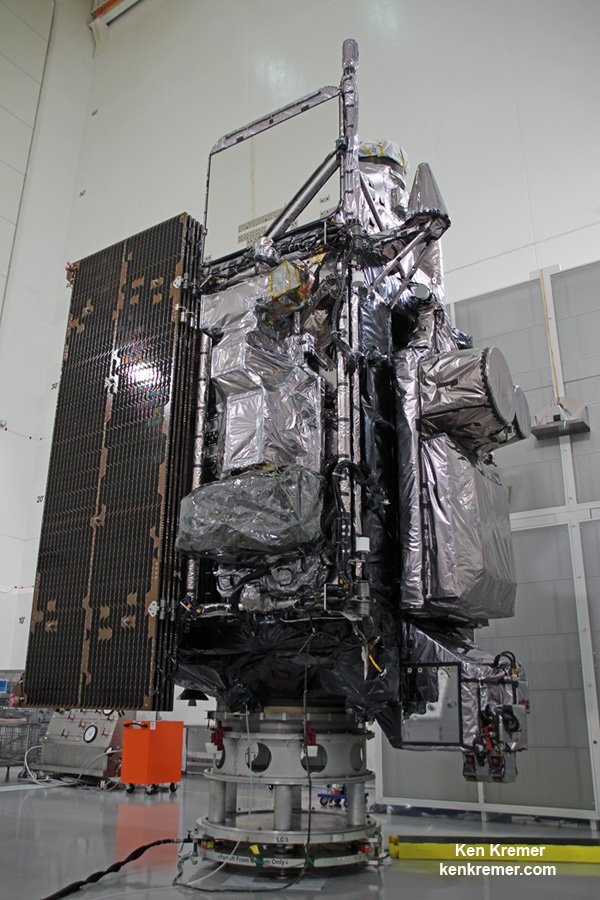
Side view of NASA/NOAA GOES-R next gen weather observation satellite showing solar panels and instruments inside Astrotech Space Operations cleanroom, in Titusville, FL. Launch is set for Nov. 19, 2016. Credit: Ken Kremer/kenkremer.com
The gigantic school bus sized satellite is equipped with a suite of six instruments or sensors that are the most advanced of their kind. They will be used for three types of observations: Earth sensing, solar imaging, and space environment measuring. They will point to the Earth, the Sun and the in-situ environment of the spacecraft.
The suite includes the Advanced Baseline Imager (ABI), Geostationary Lightning Mapper (GLM), Solar Ultraviolet Imager (SUVI), Extreme Ultraviolet and X-Ray Irradiance Sensors (EXIS), Space Environment In-Situ Suite (SEISS), and the Magnetometer (MAG).
Stay tuned here for Ken’s continuing Earth and Planetary science and human spaceflight news.
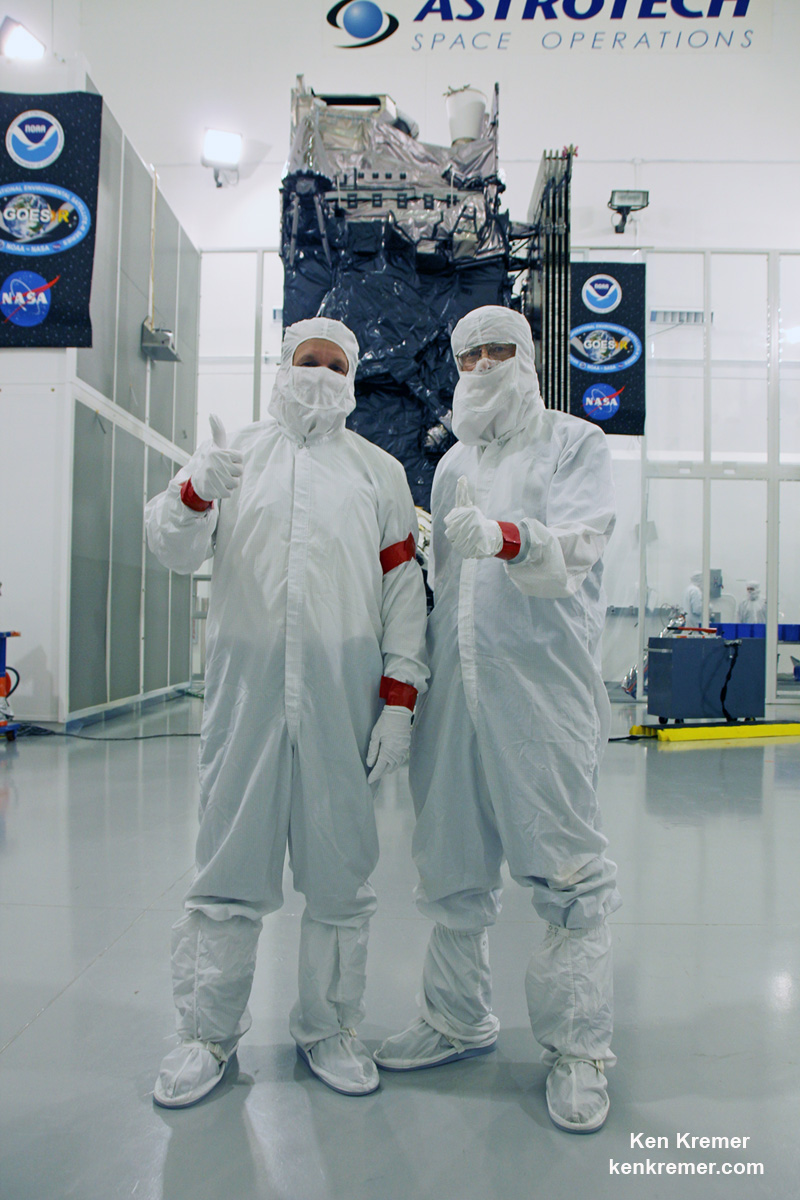
GOES-R weather observation satellite instrument suite. Credit: NASA/NOAATim Gasparinni, GOES-R program manager for Lockheed Martin, and Ken Kremer/University Today pose with GOES-R revolutionary weather satellite inside Astrotech Space Operations cleanroom, in Titusville, FL, and built by NASA/NOAA/Lockheed Martin/Harris. Credit: Ken Kremer/kenkremer.com
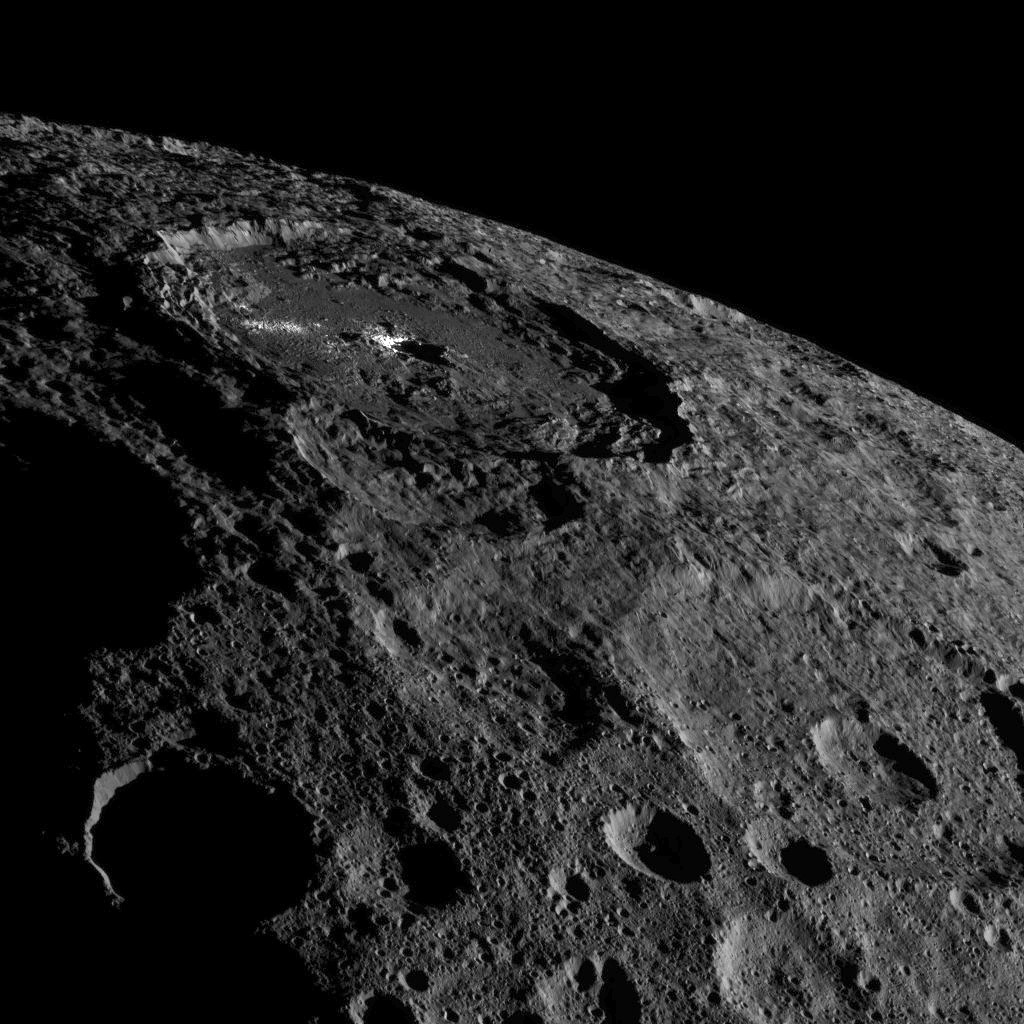
This image of the limb of dwarf planet Ceres shows a section of the northern hemisphere. Prominently featured is Occator Crater, home of Ceres' intriguing brightest areas. Credit: NASA/JPL-Caltech/UCLA/MPS/DLR/IDA
There’s one thing that could mean the end of the Dawn mission: if the hydrazine fuel for its maneuvering thruster system runs out. Now, engineers for the Dawn mission have figured out a way to save on this fuel while still sending Dawn to a new science orbit around the dwarf planet Ceres. They are effectively extending the mission while expanding on the science Dawn can do.
And in the meantime, Dawn’s cameras can take stunning new images, like the one above of Occator Crater on Ceres and its intriguing, mysterious bright regions.
“This image captures the wonder of soaring above this fascinating, unique world that Dawn is the first to explore,” said Marc Rayman, Dawn’s chief engineer and mission director at the Jet Propulsion Laboratory.
This image has the cameras on the Dawn spacecraft looking straight down at Occator Crater on Ceres, with its signature bright areas. Dawn scientists have found that the central bright spot, which harbors the brightest material on Ceres, contains a variety of salts. Credit: NASA/JPL-Caltech/UCLA/MPS/DLR/IDA
Dawn started making its way to a sixth science orbit earlier this month, raising its orbital height to over 4,500 miles (7,200 kilometers) from Ceres. For previous changes in its orbit, Dawn needed to make several changes in direction while it spiraled either higher or lower. But Dawn’s ever-ingenious engineers have figured out a way for the spacecraft to arrive at this next orbit while the ion engine thrusts in the same direction that Dawn is already going. This uses less hydrazine and xenon fuel than Dawn’s normal spiral maneuvers.
Previously, Dawn’s engineers have done things nothing short of miraculous, such as figuring out how to operate the spacecraft with only two reaction wheels (when at least three are needed, normally), they have developed new, emergency flight paths on short notice, and they keep figuring out ways to conserve the hydrazine. Earlier in the mission, they analyzed more than 50 different options to figure out how to reduce their fuel usage by a whopping 65 percent.
Occator Crater, with its central bright region and other reflective areas, provides evidence of recent geologic activity. The latest research suggests that the bright material in this crater is comprised of salts left behind after a briny liquid emerged from below, froze and then sublimated, meaning it turned from ice into vapor.
The impact that formed the crater millions of years ago unearthed material that blanketed the area outside the crater, and may have triggered the upwelling of salty liquid.
Another new image from Dawn scientists at the German Aerospace Center in Berlin shows how the dwarf planet’s colors would appear to the human eye. The color was calculated based on the way Ceres reflects different wavelengths of light.
This image of Ceres approximates how the dwarf planet’s colors would appear to the eye. Credit: NASA/JPL-Caltech/UCLA/MPS/DLR/IDA
Dawn scientists say that one goal of Dawn’s sixth science orbit is to refine previously collected measurements. The spacecraft’s gamma ray and neutron spectrometer, which has been investigating the composition of Ceres’ surface, will characterize the radiation from cosmic rays unrelated to Ceres. This will allow scientists to subtract “noise” from measurements of Ceres, making the information more precise.
This image of the limb of dwarf planet Ceres shows a section of the northern hemisphere. A shadowy portion of Occator Crater can be seen at the lower right — its bright “spot” areas are outside of the frame of view. Part of Kaikara Crater (45 miles, 72 kilometers in diameter) is visible at top left. Credit: NASA/JPL-Caltech/UCLA/MPS/DLR/IDA
The spacecraft has gathered tens of thousands of images and other information from Ceres since arriving in orbit on March 6, 2015. After spending more than eight months studying Ceres at an altitude of about 240 miles (385 kilometers), closer than the International Space Station is to Earth, Dawn headed for a higher vantage point in August. Then, in October, Dawn raised its orbit to about 920-mile (1,480 km) altitude, returning more images and other valuable data about Ceres.
Thanks to the ingenuity of Dawn’s engineers, we’ll have more time to study Ceres.
Oxo Crater and its surroundings are featured in this image of Ceres’ surface from NASA’s Dawn spacecraft. Dawn took this image on Oct. 18, 2016, from its second extended-mission science orbit (XMO2), at a distance of about 920 miles (1,480 kilometers) above the surface. The image resolution is about 460 feet (140 meters) per pixel. Credit: NASA/JPL-Caltech/UCLA/MPS/DLR/IDAThis view from NASA’s Dawn spacecraft features a lobe-shaped flow feature in Ghanan Crater on Ceres. The flow feature is a place where a crater rim has collapse and material has flowed across the surface. Several small craters are visible on top of the flow; the number of craters can help scientists estimate the feature’s age. Credit: NASA/JPL-Caltech/UCLA/MPS/DLR/IDA
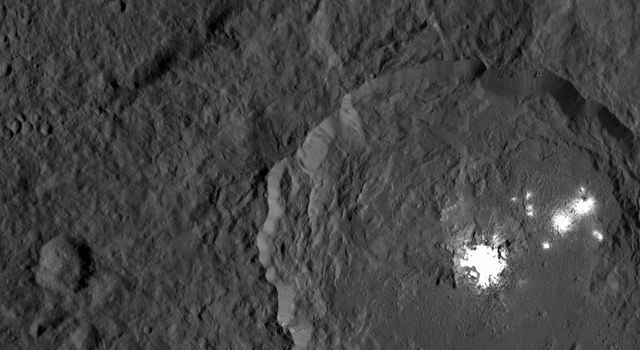
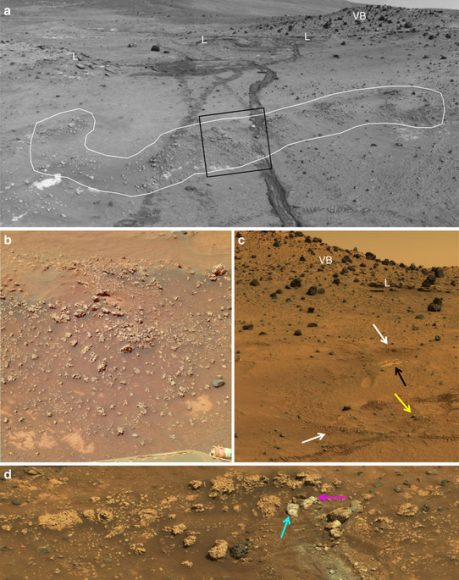
Rock formations near hot spring discharge channels at El Tatio, Chile, shown in this image, bear a striking resemblance to formations in the Gusev Crater on Mars. Image: Steven W. Ruff, Jack D. Farmer
A type of rock formation found on Mars may be some of the best evidence yet for life on that planet, according to a new study at Nature.com. The formations in question are in the Gusev Crater. When Spirit examined the spectra of the formations, scientists found that they closely match those of formations at El Tatio in Northern Chile.
The significance of that match? The El Tatio formations were produced by a combination of living and non-living processes.
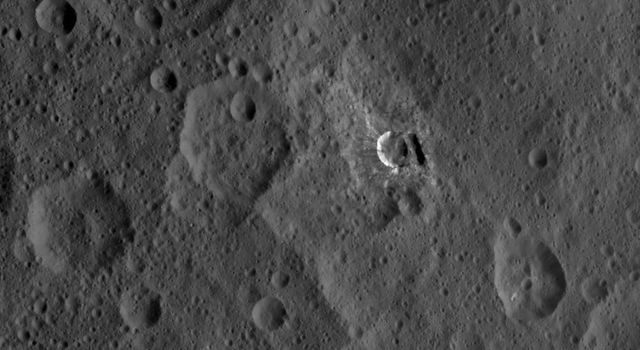
The Gusev Crater geo-located on a map of Mars. Image: Wikimedia Labs
The Gusev Crater is a large crater that formed 3 to 4 billion years ago. It’s an old crater lake bed, with sediments up to 3,000 feet thick. Gusev also has exposed rock formations which show evidence of layering. A system of water channels called Ma’adim Vallis flows into Gusev, which could account for the deep sediments.
When it comes to evidence for the existence of life on Mars, and on early Earth, researchers often focus on hydrothermal spring deposits. These deposits can capture and preserve the biosignatures of early life. You can’t find evidence of ancient life just anywhere because geologic processes erase it. This is why El Tatio has received so much attention.
It’s also why formations at Gusev have received attention. They appear to have a hydrothermal origin as well. Their relation to the rocks around them support their hydrothermal origin.
El Tatio in Chile is a hard-to-find combination of extremely high UV, low rainfall, high annual evaporation rate, and high elevation. This makes it an excellent analog for Mars.
The Mars-like conditions at El Tatio make it rather unique on Earth, and that uniqueness is reflected in the rock deposits and structures that it produces. The most unique ones may be the biomediated silica structures that resemble the structures in Gusev. This resemblance suggest that they have the same causes: hydrothermal vents and biofilms.
Silica structures at the Gusev Crater (left) closely resemble the silica structures at El Tatio (right.) Image: Steven W. Ruff, Jack D. Farmer
Biomediated Structures?
The rock structures at El Tatio are typically covered with very shallow water that supports bio-films and mats comprised of different diatoms and cyanobacteria. The size and shape of the structures varies, probably according to the variable depth, flow velocity, and flow direction of the water. The same variations are present at Gusev on Mars. This begs the question, “Could the structures at Gusev also have a biological cause?”
Microscopic images of structures at El Tatio. B, in the upper right, shows the biofilm community partly responsible for the formation of the structures. The surface biofilm community includes silica-encrusted microbial filaments and sheaths, and spindle-shaped diatoms (white arrows.) Image: Steven W. Ruff, Jack D. Farmer.
Luckily, we have a rover on Mars that can probe the Gusev formations more deeply. Spirit used its Miniature Thermal Emission Spectrometer (Mini-TES) to obtain spectra of the Gusev formations. These spectra confirmed the similarity to the terrestrial formations at El Tatio.
Spirit was helpful in other ways. The rover has one inoperable wheel, which drags across the Martian surface, disrupting and overturning rock structures. Spirit was intentionally driven across the Gusev formations, in order to overturn and expose fragments. Then, Spirit’s Microscopic Imager was trained on those fragments.
(A) shows the wheel marks left by Spirit. The darker ones on the right are from the inoperable wheel. (B) is a closeup of the box in (A). (C) shows some of the rover tracks and features in Gusev. (D) shows two whitish rocks, intentionally overturned by Spirit’s busted wheel. Image: NASA/JPL/Spirit PanCam.MM scale close-up images of the Martian rocks, on the left, show many similarities with the El Tatio rocks, right. Images: Steven W. Ruff, Jack D. Farmer, NASA/JPL.
Unfortunately, Spirit lacks the instrumentation to look deeply into the internal microscale features of the Martian rocks. If Spirit could do that, we would be much more certain that the Martian rocks were partly biogenic in origin. All of the surrounding factors suggest that they do, but that’s not enough to come to that conclusion.
This study presents more compelling evidence that there was indeed life on Mars at some point. But it’s not conclusive.