
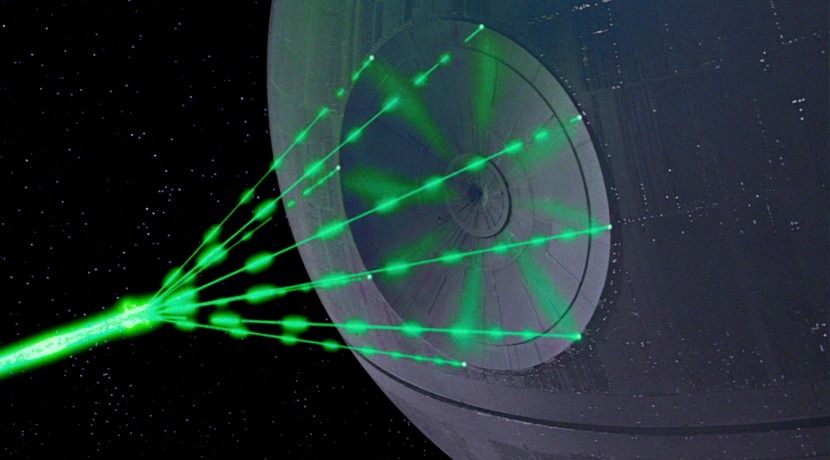
It was with great fanfare that Elon Musk announced SpaceX’s plans to colonize Mars with the Interplanetary Transport System.
I really wish they’d stuck to their original name, the BFR, the Big Fabulous Rocket, or something like that.
The problem is that Interplanetary Transport System is way too close a name to another really cool idea, the Interplanetary Transport Network, which gives you an almost energy free way to travel across the entire Solar System. Assuming you’re not in any kind of rush.
When you imagine rockets blasting off for distant destinations, you probably envision pointing your rocket at your destination, firing the thrusters until you get there. Maybe turning around and slowing down again to land on the alien world. It’s how you might drive your car, or fly a plane to get from here to there.
But if you’ve played any Kerbal Space Program, you know that’s not how it works in space. Instead, it’s all about orbits and velocity. In order to get off planet Earth, you have be travelling about 8 km/s or 28,000 km/h sideways.
So now, you’re orbiting the Earth, which is orbiting the Sun. If you want to get to Mars, you have raise your orbit so that it matches Mars. The absolute minimum energy needed to make that transfer is known as the Hohmann transfer orbit. To get to Mars, you need to fire your thrusters until you’re going about 11.3 km/s.
Then you escape the pull of Earth, follow a nice curved trajectory, and intercept the trajectory of Mars. Assuming you timed everything right, that means you intercept Mars and go into orbit, or land on its surface, or discover a portal to hell dug into a research station on Phobos.
If you want to expend more energy, go ahead, you’ll get there faster.
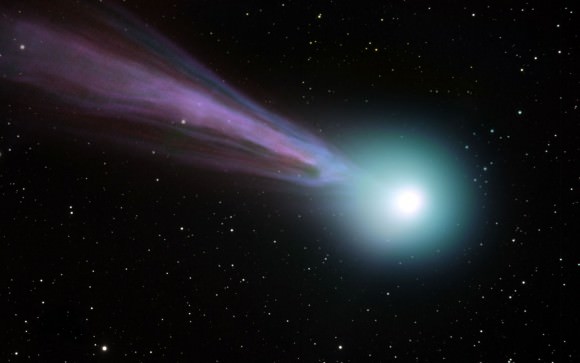
But it turns out there’s another way you can travel from planet to planet in the Solar System, using a fraction of the energy you would use with the traditional Hohmann transfer, and that’s using Lagrange points.
We did a whole article on Lagrange points, but here’s a quick refresher. The Lagrange points are places in the Solar System where the gravity between two objects balances out in five places. There are five Lagrange points relating to the Earth and the Sun, and there are five Lagrange points relating to the Earth and the Moon. And there are points between the Sun and Jupiter, etc.
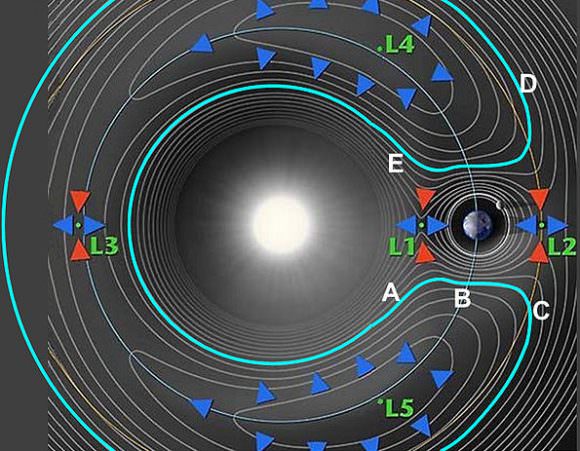
Three of these points are unstable. Imagine a boulder at the top of a mountain. It doesn’t take much energy to keep it in place, but it’s easy to knock it out of balance so it comes rolling down.
Now, imagine the whole Solar System with all these Lagrange points for all the objects gravitationally interacting with each other. As planets go around the Sun, these Lagrange points get close to each other and even overlap.
And if you time things right, you can ride along in one gravitationally balanced point, and the roll down the gravity hill into the grasp of a different planet. Hang out there for a little bit and then jump orbits to another planet.
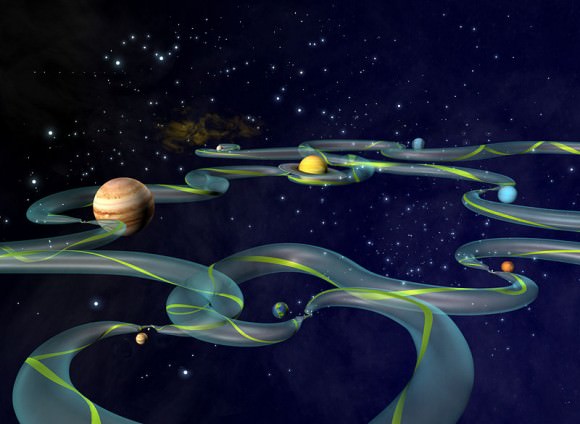
In fact, you can use this technique to traverse the entire Solar System, from Mercury to Pluto and beyond, relying only on the interacting gravity of all these worlds to provide you with the velocity you need to make the journey.
Welcome to the Interplanetary Transport Network, or Interplanetary Superhighway.
Unlike a normal highway, though, the actual shape and direction these pathways take changes all the time, depending on the current configuration of the Solar System.
If you think this sounds like science fiction, you’ll be glad to hear that space agencies have already used a version of this network to get some serious science done.
NASA greatly extended the mission of the International Sun/Earth Explorer 3, using these low energy transfers, it was able to perform its primary mission and then investigate a couple of comets.
The Japanese Hiten spacecraft was supposed to travel to the Moon, but its rocket failed to get enough velocity to put it into the right orbit. Researchers at NASA’s Jet Propulsion Laboratory calculated a trajectory that used the Lagrange points to help it move slowly and get to the Moon any way.
NASA’s Genesis Mission used the technique to capture particles from the solar wind and bring them back to the Earth.
There have been other missions to use the technique, and missions have been proposed that might exploit this technique to fully explore all the moons of Jupiter or Saturn, for example. Traveling from moon to moon when the gravity points line up.
It all sounds too good to be true, so here’s the downside. It’s slow. Really, painfully slow.
Like it can take years and even decades to move from world to world.
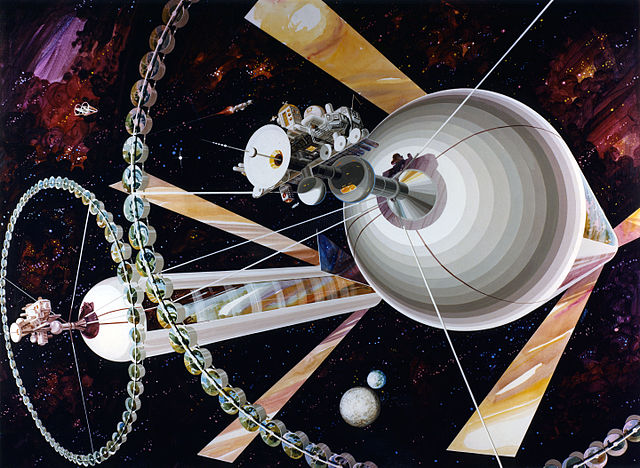
Imagine in the far future, there are space stations positioned at the major Lagrange points around the planets in the Solar System. Maybe they’re giant rotating space stations, like in 2001, or maybe they’re hollowed out asteroids or comets which have been maneuvered into place.

They hang out at the Lagrange points using minimal fuel for station keeping. If you want to travel from one planet to another, you dock your spacecraft at the space station, refuel, and then wait for one of these low-energy trajectories to open up.
Then you just kick away from the Lagrange point, fall into the gravity well of your destination, and you’re on your way.
In the far future, we could have space stations at all the Lagrange points, and slow ferries that move from world to world along low energy trajectories, bringing cargo from world to world. Or taking passengers who can’t afford the high velocity Hohmann transfer technique.
You could imagine the space stations equipped with powerful lasers that fill your ship’s solar sails with the photons it needs to take you to the next destination. But then, I’m a sailor, so maybe I’m overly romanticizing it.
Here’s another, even more mind-bending concept. Astronomers have observed these networks open up between interacting galaxies. Want to transfer from the Milky Way to Andromeda? Just get your spacecraft to the galactic Lagrange point in a few billion years as they pass through each other. With very little energy, you’ll be able to join the cool kids in Andromeda.
I love this idea that colonizing and traveling across the Solar System doesn’t actually need to take enormous amounts of energy. If you’re patient, you can just ride the gravitational currents from world to world. This might be one of the greatest gifts the Solar System has made available to us.
![Century Magazine photographer Dickenson Alley) of Tesla sitting in his Colorado Springs laboratory with his "magnifying transmitter" generating millions of volts. The 7-metre (23 ft) long arcs were not part of the normal operation, but only produced for effect by rapidly cycling the power switch.[117]](https://www.universetoday.com/wp-content/uploads/2010/12/tesla_primary.jpg)


