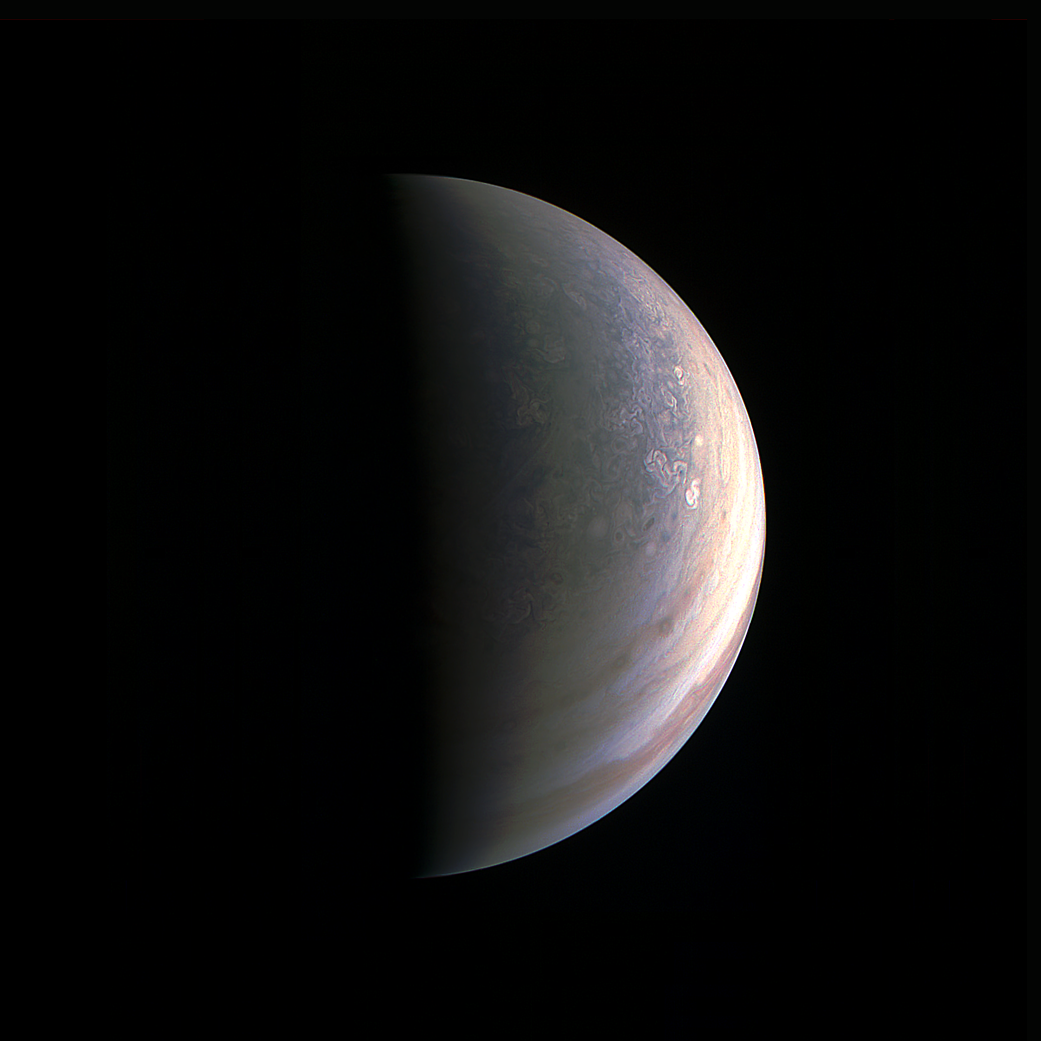
JunoCam captured this image of Jupiter's north pole region from a distance of 78,000 km (48,000 miles) above the planet.
Juno is sending data from Jupiter back to us, courtesy of the Deep Space Network, and the first images are meeting our hyped-up expectations. On August 27, the Juno spacecraft came within about 4,200 km. (2,500 miles) of Jupiter’s cloud tops. All of Juno’s instruments were active, and along with some high-quality images in visual and infrared, Juno also captured the sound that Jupiter produces.
Juno has captured the first images of Jupiter’s north pole. Beyond their interest as pure, unprecedented eye candy, the images of the pole reveal things never before seen. They show storm activity and weather patterns that are seen nowhere else in our solar system. Even on the other gas giants.
“…like nothing we have seen or imagined before.”
“First glimpse of Jupiter’s north pole, and it looks like nothing we have seen or imagined before,” said Scott Bolton, principal investigator of Juno from the Southwest Research Institute in San Antonio. “It’s bluer in color up there than other parts of the planet, and there are a lot of storms. There is no sign of the latitudinal bands or zone and belts that we are used to — this image is hardly recognizable as Jupiter. We’re seeing signs that the clouds have shadows, possibly indicating that the clouds are at a higher altitude than other features.”
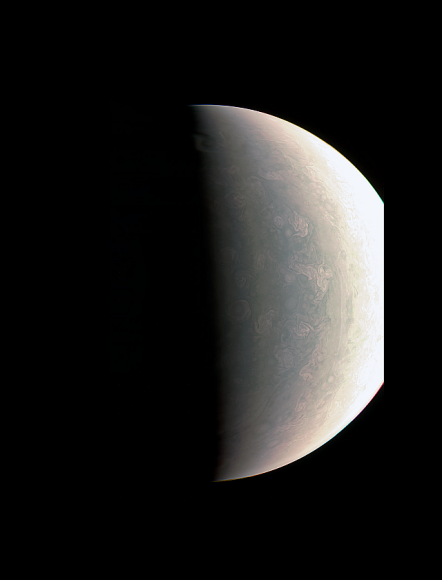
The iconic storm bands of Jupiter are absent in this JunoCam image of Jupiter’s northern polar region. Instead, the region is dominated by swirling storm patterns reminiscent of hurricanes here on Earth. Image: NASA/JPL-Caltech/SwRI/MSSS
The visible light images of Jupiter’s north pole are very different from our usual perception of Jupiter. People have been looking at Jupiter for a long time, and the gas giant’s storm bands, and the Great Red Spot, are iconic. But the north polar region looks completely different, with whirling, rotating storms similar to hurricanes here on Earth.
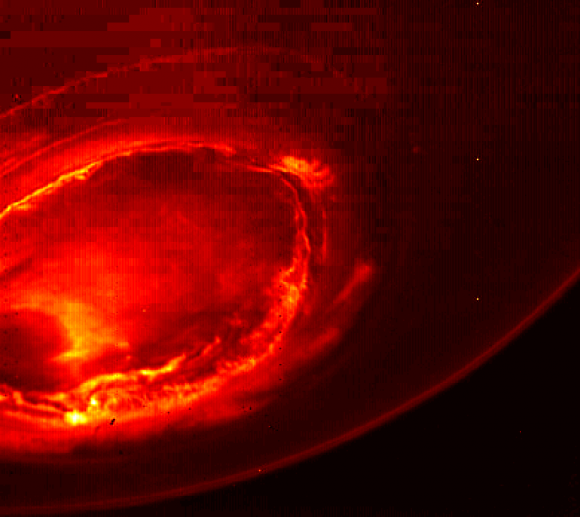
The Junocam instrument is responsible for the visible light pictures of Jupiter that we all enjoy. But the Jovian Infrared Auroral Mapper (JIRAM) is showing us a side of Jupiter that the naked eye will never see.
The Juno Infrared Auroral Mapper (JIRAM) captured this infrared image of Jupiter’s south pole. This part of Jupiter cannot be seen from Earth. Image: NASA/JPL-Caltech/SwRI/MSSS
“JIRAM is getting under Jupiter’s skin, giving us our first infrared close-ups of the planet,” said Alberto Adriani, JIRAM co-investigator from Istituto di Astrofisica e Planetologia Spaziali, Rome. “These first infrared views of Jupiter’s north and south poles are revealing warm and hot spots that have never been seen before. And while we knew that the first-ever infrared views of Jupiter’s south pole could reveal the planet’s southern aurora, we were amazed to see it for the first time.”
“No other instruments, both from Earth or space, have been able to see the southern aurora.”
Even when we’re prepared to be amazed by what Juno and other spacecraft show us, we are still amazed. It’s impossible to see Jupiter’s south pole from Earth, so these are everybody’s first glimpses of it.
“No other instruments, both from Earth or space, have been able to see the southern aurora,” said Adriani. “Now, with JIRAM, we see that it appears to be very bright and well-structured. The high level of detail in the images will tell us more about the aurora’s morphology and dynamics.”
Beyond the juicy images of Jupiter are some sound recordings. It’s been known since about the 1950’s that Jupiter is a noisy planet. Now Juno’s Radio/Plasma Wave Experiment (WAVE) has captured a recording of that sound.
“Jupiter is talking to us in a way only gas-giant worlds can,” said Bill Kurth, co-investigator for the Waves instrument from the University of Iowa, Iowa City. “Waves detected the signature emissions of the energetic particles that generate the massive auroras which encircle Jupiter’s north pole. These emissions are the strongest in the solar system. Now we are going to try to figure out where the electrons come from that are generating them.”
Oddly enough, that’s pretty much exactly what I expected Jupiter to sound like. Like something from an early sci-fi film.
There’s much more to come from Juno. These images and recordings of Jupiter are just the result of Juno’s first orbit. There are over 30 more orbits to come, as Juno examines the gas giant as it orbits beneath it.
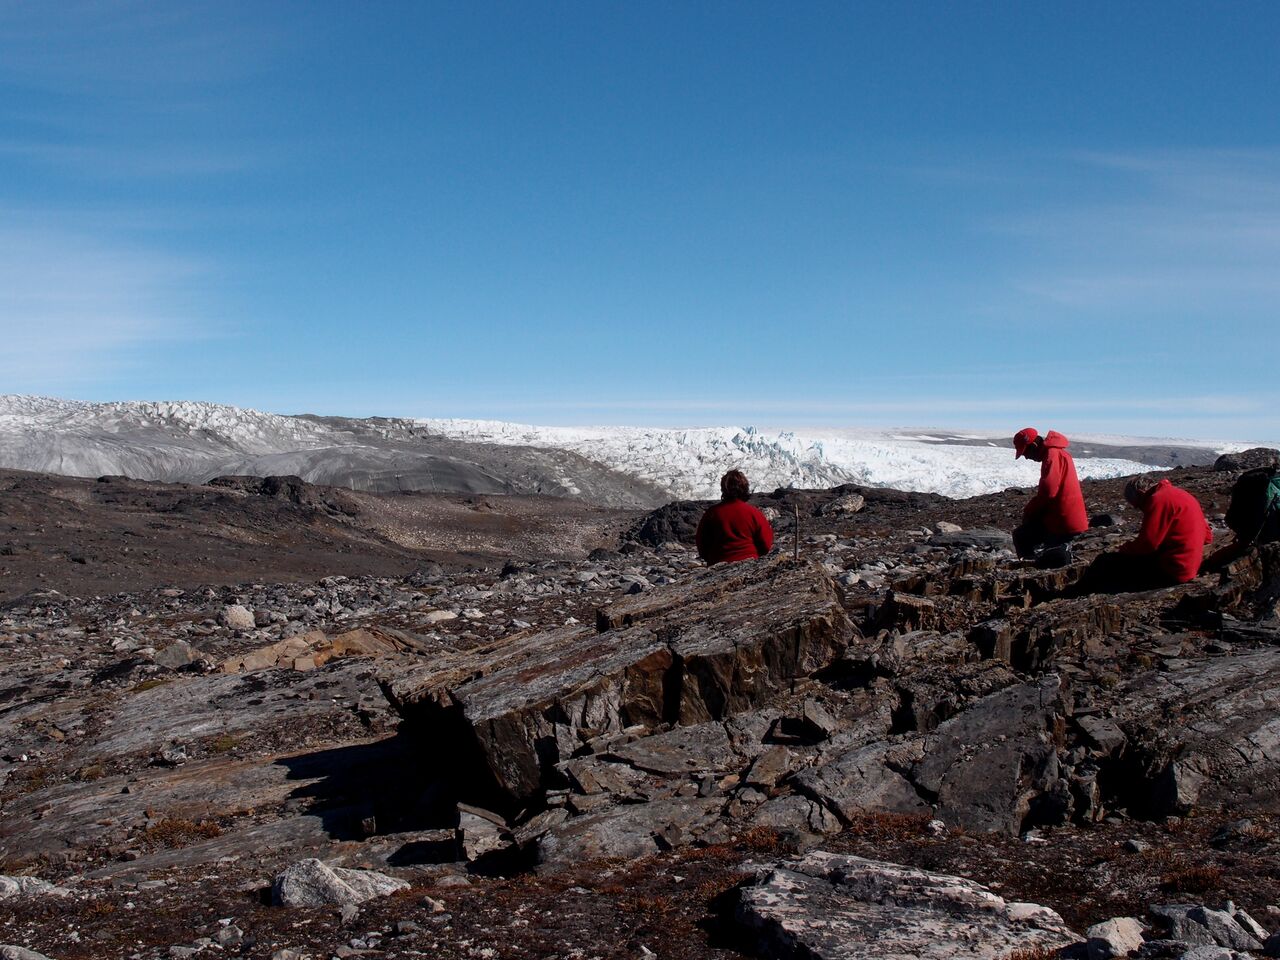
Fossilized remains found in Greenland have been dated to 3.7 billion years ago, 220 million years older than when life is believed to have emerged. Credit: A.P. Nutman et al./Nature
Fossilized remains are a fascinating thing. For paleontologists, these natural relics offer a glimpse into the past and a chance to understand what kind of lifeforms lurked there. But for astronomers, fossils are a way of ascertaining precisely when it was that life first began here on our planet – and perhaps even the Solar System.
And thanks to a team of Australian scientists, the oldest fossils to date have been uncovered. These fossilized remains have been dated to 3.7 billion years of age, and were of a community of microbes that lived on the ancient seafloor. In addition to making scientists reevaluate their theories of when life emerged on Earth, they could also tell us if there was ancient life on Mars.
The fossil find was made in what is known as the Isua Supracrustal Belt (ISB), an area in southwest Greenland that recently became accessible due to the ice melting in the area. According to the team, these fossils – basically tiny humps in rock measuring between one and four centimeters (0.4 and 1.6 inches) tall – are stromatolites, which are layers of sediment packed together by ancient, water-based bacterial colonies.
The Australian team searching for fossilized remains in the Isua supracrustal belt (ISB) in southwest Greenland. Credit: uow.edu.au
According to the team’s research paper, which appeared recently in Nature Communications, the fossilized microbes grew in a shallow marine environment, which is indicated by the seawater-like rare-earth elements and samples of sedimentary rock that were found with them.
They are also similar to colonies of microbes that can be found today, in shallow salt-water environments ranging from Bermuda to Australia. But of course, what makes this find especially interesting is just how old it is. Basically, the stone in the ISB is dated back to the early Archean Era, which took place between 4 and 3.6 billion years ago.
Based on their isotopic signatures, the team dated the fossils to 3.7 billion years of age, which makes them 220 million years older than remains that had been previously uncovered in the Pilbara Craton in north-western Australia. At the time of their discovery, those remains were widely believed to be the earliest fossil evidence of life on Earth.
As such, scientists are now reconsidering their estimates on when microbial life first emerged on planet Earth. Prior to this discovery, it was believed that Earth was a hellish environment 3.7 billion years ago. This was roughly 300 million years after the planet had finished cooling, and scientists believed it would take at least half a billion years for life to form after this point.
4.5 billion years ago, during the Hadean Eon, Earth had a much different environment than it does today. Credit: NASA
But with this new evidence, it now appears that life could have emerged faster than that. As Allen P. Nutman – a professor from the University of Wallongong, Australia, and the study’s lead author – said in a university press release:
“The significance of stromatolites is that not only do they provide obvious evidence of ancient life that is visible with the naked eye, but that they are complex ecosystems. This indicates that as long as 3.7 billion years ago microbial life was already diverse. This diversity shows that life emerged within the first few hundred millions years of Earth’s existence, which is in keeping with biologists’ calculations showing the great antiquity of life’s genetic code.”
When life emerged is a major factor when it comes to Earth’s chemical cycles. Essentially, Earth’s atmosphere during the Hadean was believed to be composed of heavy concentrations of CO² atmosphere, hydrogen and water vapor, which would be toxic to most life forms today. During the following Archean era, this primordial atmosphere slowly began to be converted into a breathable mix of oxygen and nitrogen, and the protective ozone layer was formed.
The emergence of microbial life played a tremendous role in this transformation, allowing for the sequestration of CO² and the creation of oxygen gas through photosynthesis. Therefore, when it comes to Earth’s evolution, the question of when life arose and began to affect the chemical cycles of the planet has always been paramount.
Could fossilized remains of microbes be found underneath Mars’ cold, dry landscape? Credit: NASA/JPL-Caltech
“This discovery turns the study of planetary habitability on its head,” said associate Professor Bennett, one of the study’s co-authors. “Rather than speculating about potential early environments, for the first time we have rocks that we know record the conditions and environments that sustained early life. Our research will provide new insights into chemical cycles and rock-water-microbe interactions on a young planet.”
The find has also inspired some to speculation that similar life structures could be found on Mars. Thanks to the ongoing efforts of Martian rovers, landers and orbiters, scientists now know with a fair degree of certainty that roughly 3.7 billion years ago, Mars had a warmer, wetter environment.
As a result, it is possible that life on Mars had enough time to form before its atmosphere was stripped away and the waters in which the microbe would have emerged dried up. As Professor Martin Van Kranendonk, the Director of the Australian Centre for Astrobiology at UNSW and a co-author on the paper, explained:
“The structures and geochemistry from newly exposed outcrops in Greenland display all of the features used in younger rocks to argue for a biological origin. This discovery represents a new benchmark for the oldest preserved evidence of life on Earth. It points to a rapid emergence of life on Earth and supports the search for life in similarly ancient rocks on Mars.”
Another thing to keep in mind is that compared to Earth, Mars experiences far less movement in its crust. As such, any microbial life that existed on Mars roughly 3.7 billion years ago would likely be easier to find.
This is certainly good news for NASA, since one of the main objectives of their Mars 2020 rover is to find evidence of past microbial life. I for one am looking forward to seeing what it leaves for us to pickup in its cache of sample tubes!
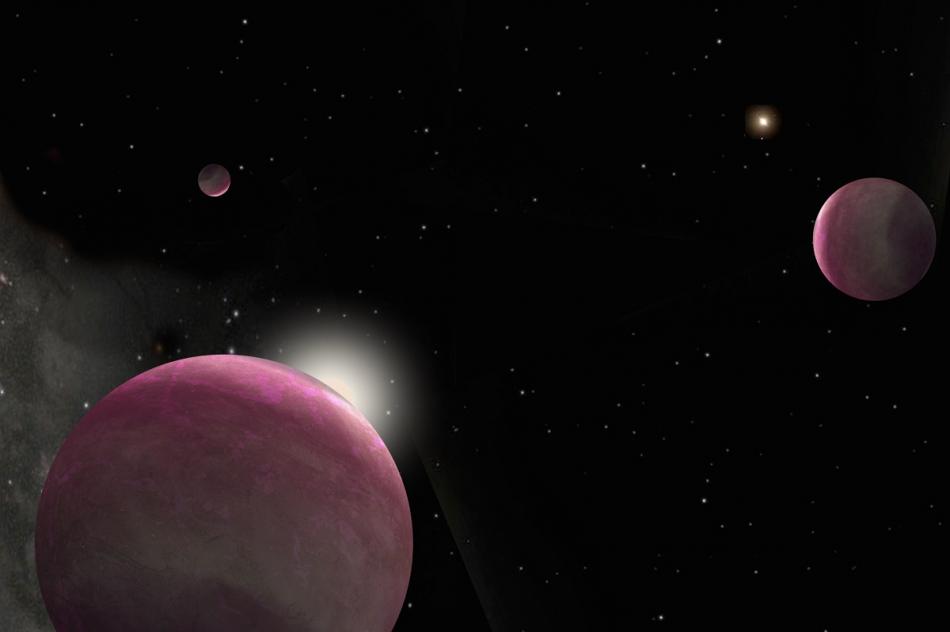
Artist’s conception of the binary system with three giant planets discovered in this study. One star hosts two planets and the other hosts the third. The system represents the smallest-separation binary in which both stars host planets that has ever been observed. Image courtesy of Robin Dienel/Carnegie.
The more we look, the more we see the great diversity in planetary systems around other stars. And curiously, planet hunters are finding that most star systems are very different from our own.
An example is a recently discovered system that is extremely crowded. It consists of a three giant planets in a binary (two stars) system. One star hosts two planets and the other hosts the third. The system represents the smallest-separation binary in which both stars host planets that has ever been observed.
“The probability of finding a system with all these components was extremely small,” said Johanna Teske from the Carnegie Institution for Science, “so these results will serve as an important benchmark for understanding planet formation, especially in binary systems.”
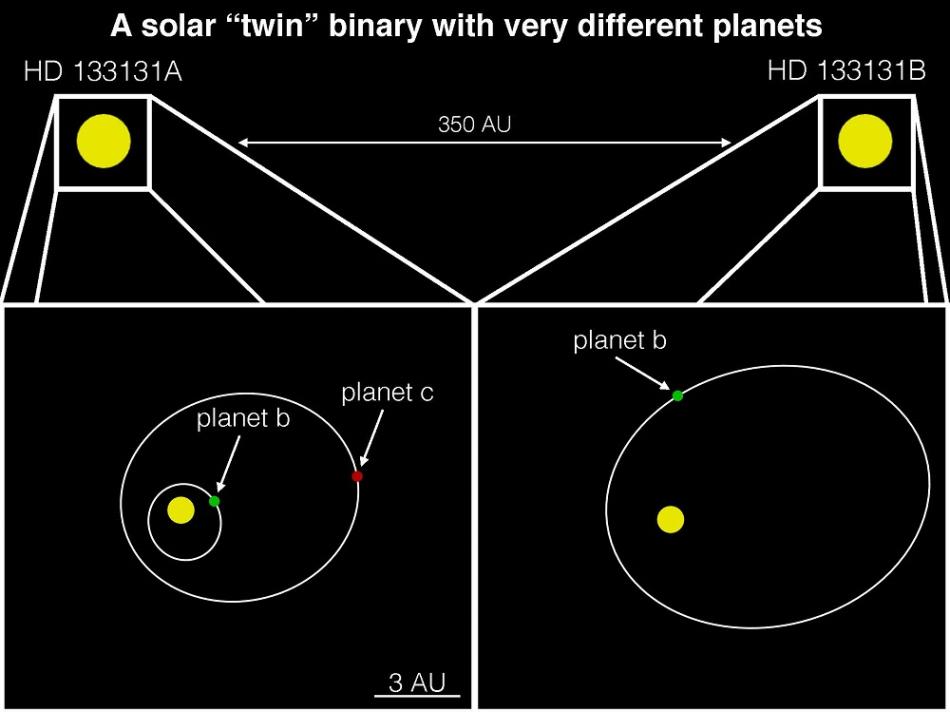
An illustration of this highly unusual system, which features the smallest-separation binary stars that both host planets ever discovered. Only six other metal-poor binary star systems with exoplanets have ever been found. Illustration courtesy of Timothy Rodigas/Carnegie.
Teske and her team said this busy system might help explain the influence that giant planets like Jupiter have over a solar system’s architecture.
“We are trying to figure out if giant planets like Jupiter often have long and, or eccentric orbits,” Teske explained. “If this is the case, it would be an important clue to figuring out the process by which our Solar System formed, and might help us understand where habitable planets are likely to be found.”
The twin stars are named HD 133131A and HD 133131B. The former hosts two Jupiter-sized worlds and the latter a planet with a mass at least 2.5 times Jupiter’s. All three planets have “eccentric” or highly elliptical orbits. So far no smaller, rocky worlds have been detected but the team said those type of planets could be part of the system, or may have been part of the system in the past.
The two stars themselves are separated by only 360 astronomical units (AU – the distance between the Earth and the Sun, approximately 150,000,000 km or 93,000,000 miles). This is extremely close for twin stars with detected planets orbiting the individual stars. The next-closest known binary star system with planets has stars about 1,000 AU apart.
The two stars are more like fraternal twins rather than identical because they have slight different chemical compositions. The team said this could indicate that one star swallowed some baby planets early in its life, changing its composition slightly. Or another option is that the gravitational forces of the detected giant planets may have had a strong effect on fully-formed small planets, flinging them in towards the star or out into space.
But both stars are “metal poor,” meaning that most of their mass is hydrogen and helium, as opposed to other elements like iron or oxygen. This is another curious thing about this system, as most stars that host giant planets are “metal rich.”
The system was found using the Planet Finder Spectrograph, an instrument developed by Carnegie scientists and mounted on the Magellan Clay Telescopes at Carnegie’s Las Campanas Observatory. This finding represents the first exoplanet detection made based solely on data from the. PFS is able to find large planets with long-duration orbits or orbits that are very elliptical rather than circular.
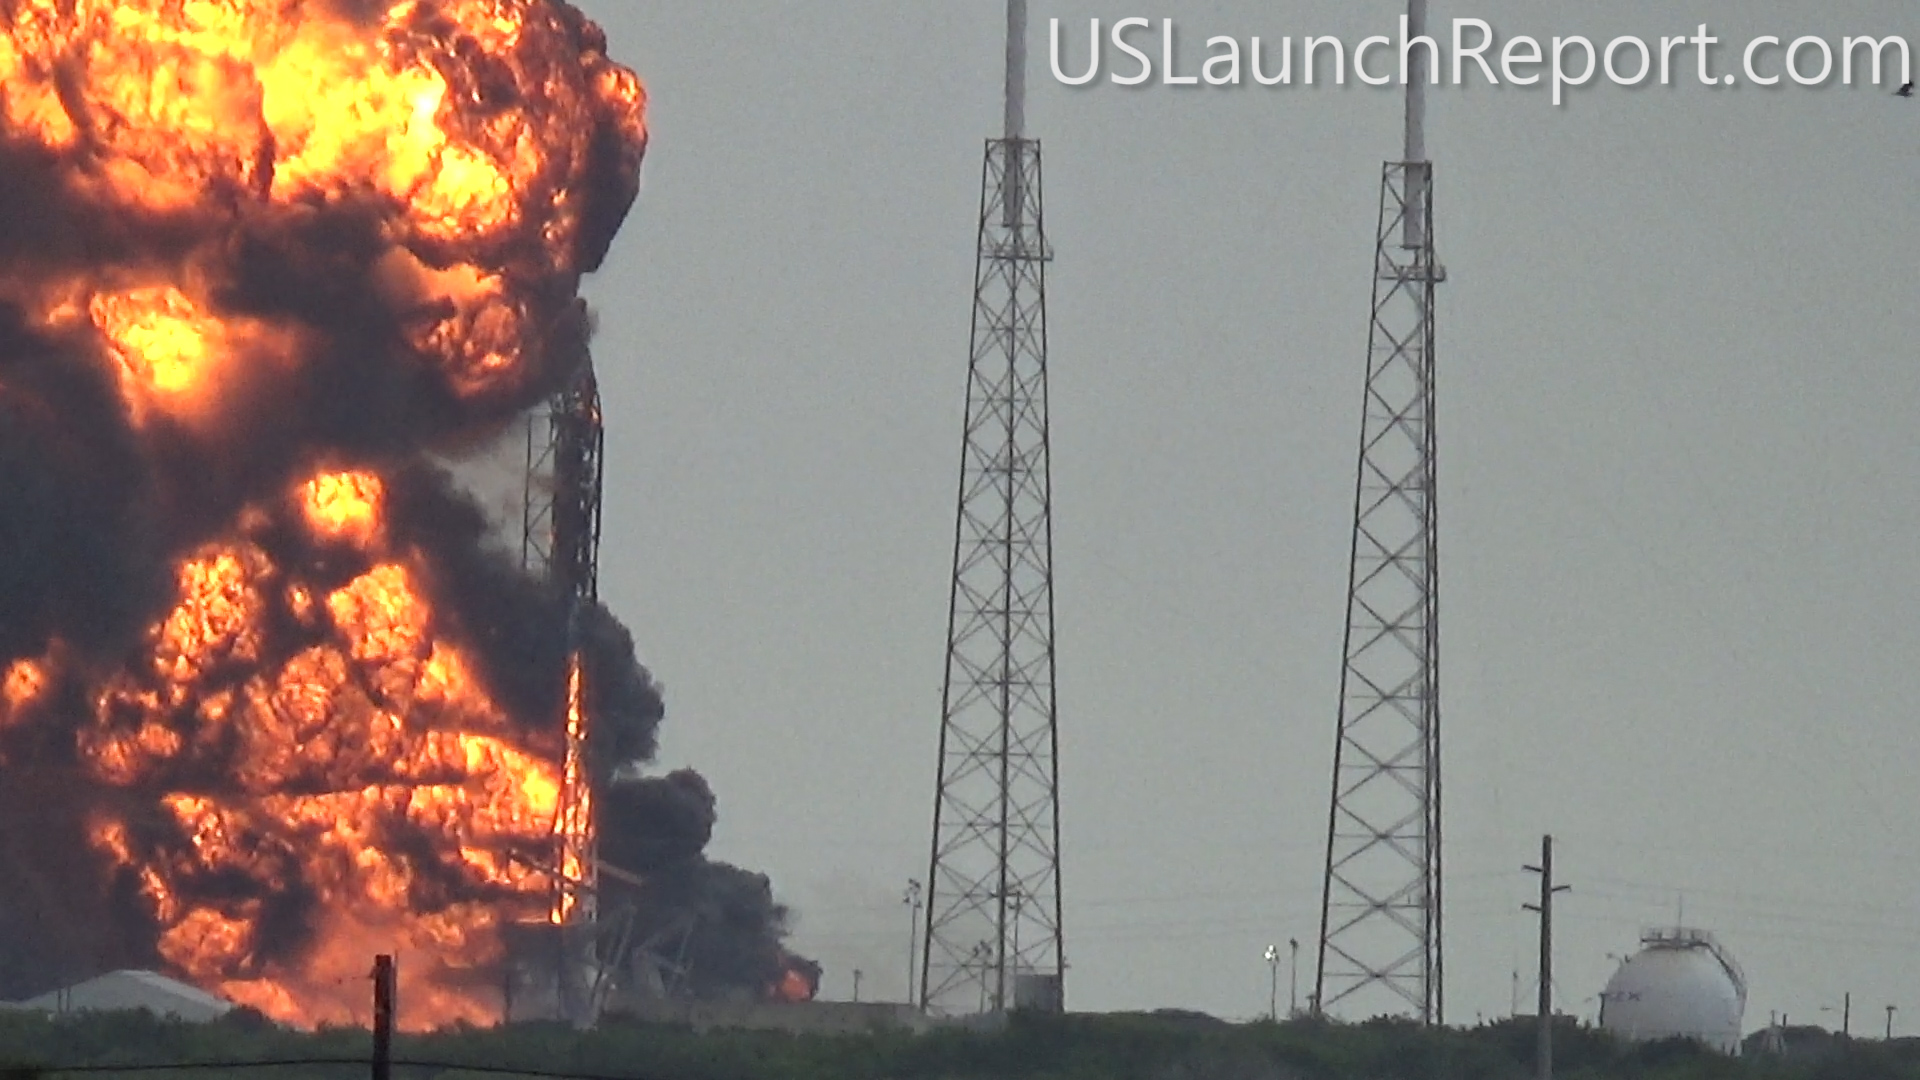
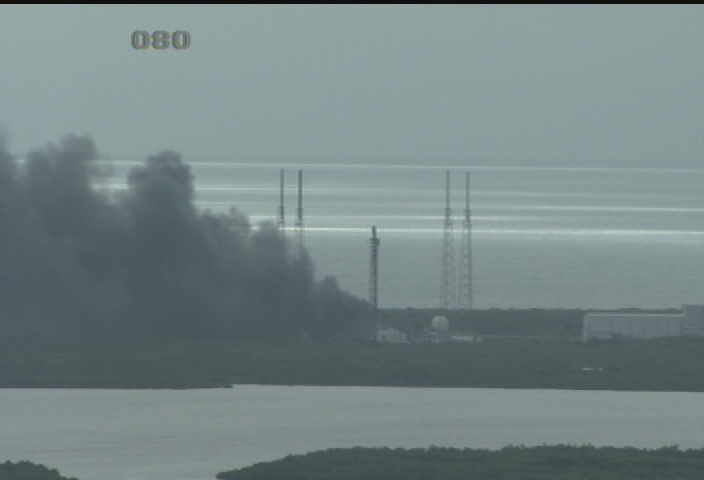
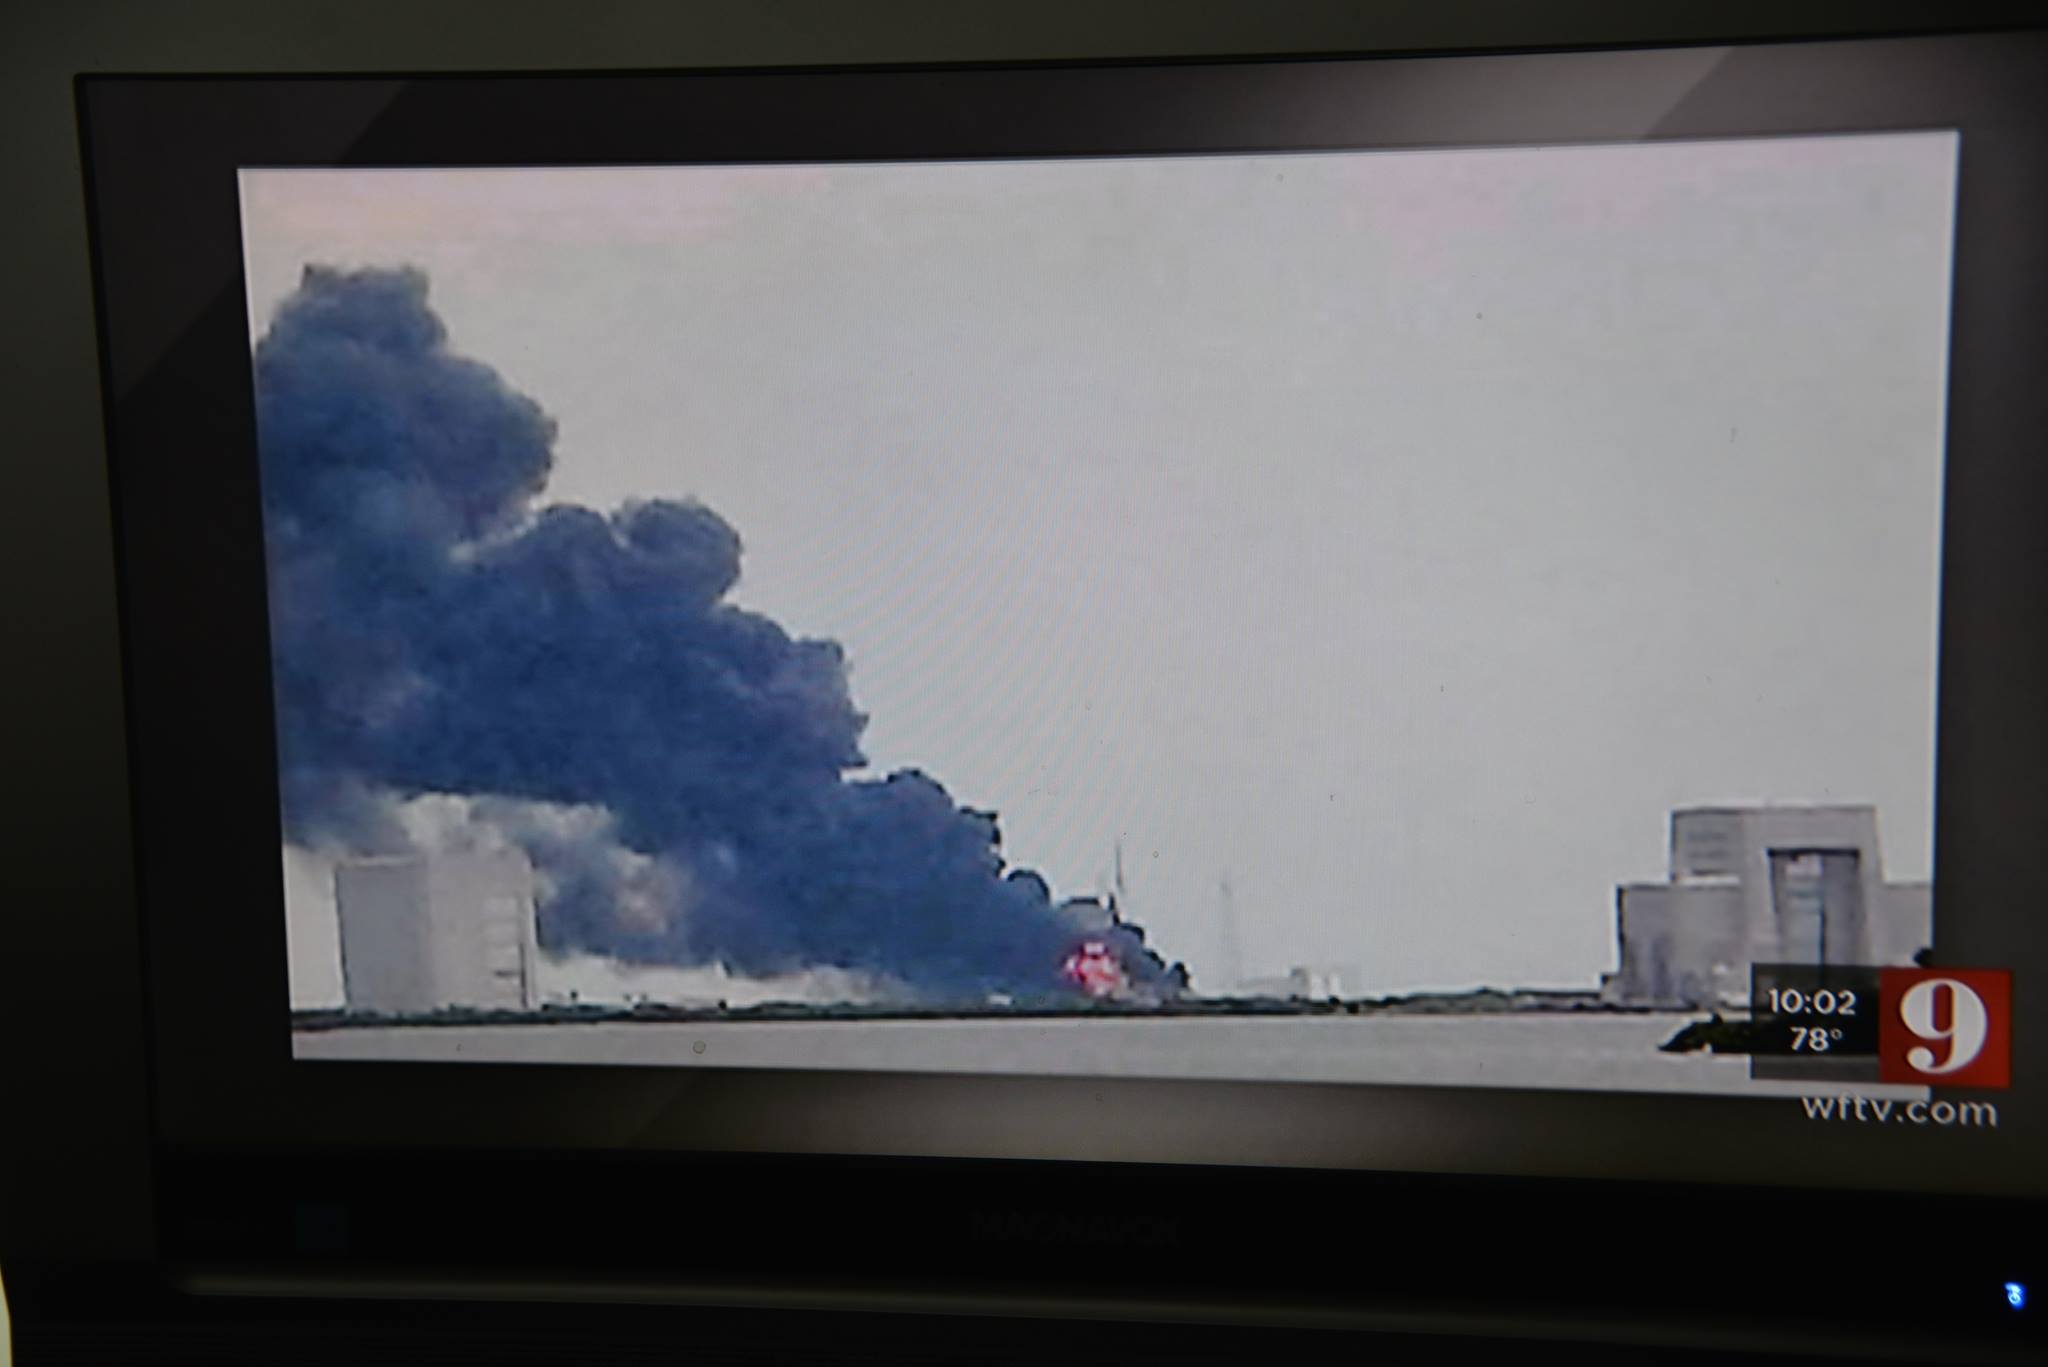
SpaceX Falcon 9 rocket moments after catastrophic explosion destroys the rocket and Amos-6 Israeli satellite payload at launch pad 40 at Cape Canaveral Air Force Station, FL, on Sept. 1, 2016. A static hot fire test was planned ahead of scheduled launch on Sept. 3, 2016. Credit: USLaunchReport
SpaceX Falcon 9 rocket moments after catastrophic explosion destroys the rocket and Amos-6 Israeli satellite payload at launch pad 40 at Cape Canaveral Air Force Station, FL, on Sept. 1, 2016. A static hot fire test was planned ahead of scheduled launch on Sept. 3, 2016. See the full video below. Credit: USLaunchReport
The SpaceX Falcon 9 rocket that suffered a catastrophic explosion this morning, Thursday, Sept. 1, at Cape Canaveral Air Force Station in Florida was captured in stunning detail in a spectacular video recorded by my space journalist colleague at USLaunchReport.
As seen in the still image above and the full video below, the rocket failure originated somewhere in the upper stage during fueling test operations at the launch pad, less than two days prior to its planned launch on Sept. 3. The rocket was swiftly consumed in a massive fireball and thunderous blasts accompanied by a vast plume of smoke rising from the wreckage visible for many miles.
Both the SpaceX rocket and the $200 million AMOS-6 Israeli commercial communications satellite payload were completely destroyed in the incident. Thankfully there were no injuries to anyone, because the pad is cleared during these types of operations.
It took place during this morning’s prelaunch preparations for a static hot fire test of the nine Merlin 1 D engines powering the Falcon 9 first stage when engineers were loading the liquid oxygen (LOX) and RP-1 kerosene propellants for the test, according to SpaceX CEO Elon Musk.
“Loss of Falcon vehicle today during propellant fill operation,” tweeted SpaceX CEO and founder Elon Musk this afternoon a few hours after the launch pad explosion.
“Originated around upper stage oxygen tank. Cause still unknown. More soon.”
The Falcon 9 explosion occurred at approximately 9:07 a.m. EDT this morning at the SpaceX launch facilities at Space Launch Complex 40 on Cape Canaveral Air Force Station, according to statements from SpaceX and the USAF 45th Space Wing Public Affairs office.
All SpaceX launches will be placed on hold until a thorough investigation is conducted, the root cause is determined, and effective fixes and remedies are identified and instituted.
The planned engine test was being conducted as part of routine preparations for the scheduled liftoff of the Falcon 9 on Saturday, September 3, with an Israeli telecommunications satellite that would have also been used by Facebook.
During the static fire test, which is a full launch dress rehearsal, the rocket is loaded with propellants and is held down at pad 40 while the engines are typically fired for a few seconds.
Here is the full video from my space journalist friend and colleague Mike Wagner of USLaunchReport:
Video Caption: SpaceX – Static Fire Anomaly – AMOS-6 – 09-01-2016. Credit: USLaunchReport
The 229-foot-tall (70-meter) SpaceX Falcon 9 had been slated for an overnight blastoff on Saturday, September 3 at 3 a.m. from pad 40 with the 6 ton AMOS-6 telecommunications satellite valued at some $200 million.
In the video you can clearly see the intensely bright explosion flash near the top of the upper stage that quickly envelopes the entire rocket in a fireball, followed later by multiple loud bangs from the disaster echoing across and beyond the pad.
Seconds later the nose cone and payload break away violently, falling away and crashing into the ground and generating a new round of loud explosions and fires and a vast plume of smoke rising up.
At the end the rocket is quite visibly no longer standing. Only the strongback erector is still standing at pad 40. And both the strongback and the pad structure seems to have suffered significant damage.
This would have been the 9th Falcon 9 launch of 2016.
SpaceX Falcon 9 rocket moments after catastrophic explosion destroys the rocket and Amos-6 Israeli satellite payload at launch pad 40 at Cape Canaveral Air Force Station, FL, on Sept. 1, 2016. A static hot fire test was planned ahead of scheduled launch on Sept. 3, 2016. Credit: USLaunchReport
SpaceX media relations issued this updated statement:
“At approximately 9:07 am ET, during a standard pre-launch static fire test for the AMOS-6 mission, there was an anomaly at SpaceX’s Cape Canaveral Space Launch Complex 40 resulting in loss of the vehicle.”
“The anomaly originated around the upper stage oxygen tank and occurred during propellant loading of the vehicle. Per standard operating procedure, all personnel were clear of the pad and there were no injuries.”
“We are continuing to review the data to identify the root cause. Additional updates will be provided as they become available.”
Listen to my BBC Radio 5 Live interview conducted late this afternoon:
Today’s explosion and the total loss of vehicle and payload will certainly have far reaching consequences for not just SpaceX and the commercial satellite provider and end users, but also NASA, the International Space Station, the US military, and every other customer under a launch contact with the fast growing aerospace firm.
The ISS is impacted because SpaceX is one of two NASA contracted firms launching cargo resupply missions to the ISS – along with Orbital ATK.
Continued operations of the ISS depends on a reliable and robust lifeline of periodic supply trains from SpaceX and Orbital ATK.
In fact the most recent SpaceX Drago cargo freighter launched on the CRS-9 mission to the ISS on July 18 as I witnessed and reported here. And just successfully returned to Earth with 3000 pounds of NASA science cargo and research samples last week on Aug. 26.
The SpaceX Dragon launches to the ISS will be put on hold as the investigation moves forward.
Furthermore SpaceX is manufacturing a Crew Dragon designed to launch astronauts to the ISS atop this same Falcon 9 rocket. So that will also have to be evaluated.
SpaceX is also trying to recover and recycle the Falcon 9 first stage.
To date SpaceX has recovered 6 first stage Falcon 9 boosters by land and by sea.
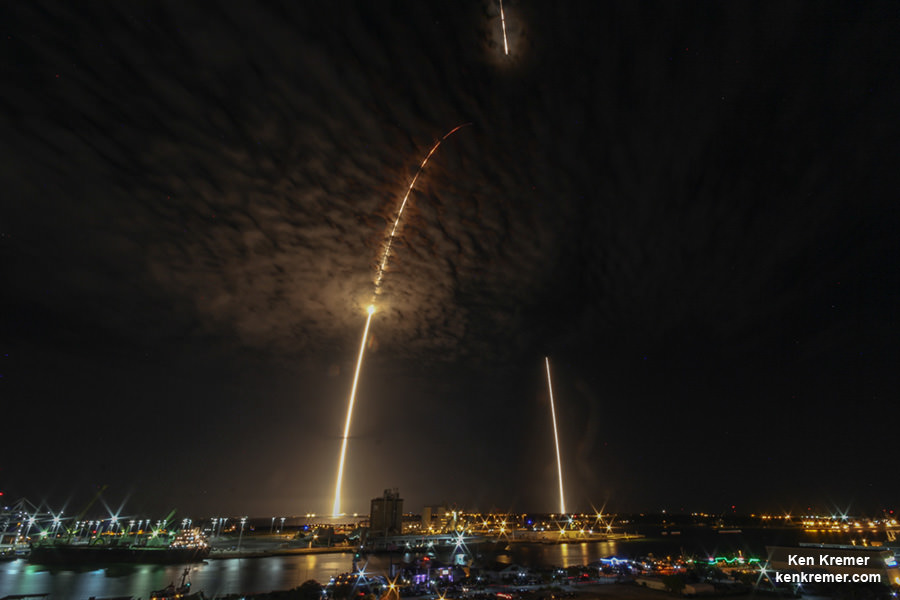
SpaceX Falcon 9 launches and lands over Port Canaveral in this streak shot showing rockets midnight liftoff from Space Launch Complex 40 at Cape Canaveral Air Force Station in Florida at 12:45 a.m. EDT on July 18, 2016 carrying Dragon CRS-9 craft to the International Space Station (ISS) with almost 5,000 pounds of cargo and docking port. View from atop Exploration Tower in Port Canaveral. Credit: Ken Kremer/kenkremer.com
Indeed as I reported just 2 days ago, SpaceX announced a contract with SES to fly the SES-10 communications satellite on a recycled Falcon 9, before the end of the year and perhaps as soon as October.
But this explosion will set back that effort and force a halt to all SpaceX launches until the root cause of the disaster is determined.
Here’s one of my photos showing the prior SpaceX rocket failure in June 2015 during the CRS-7 cargo delivery mission to the ISS:
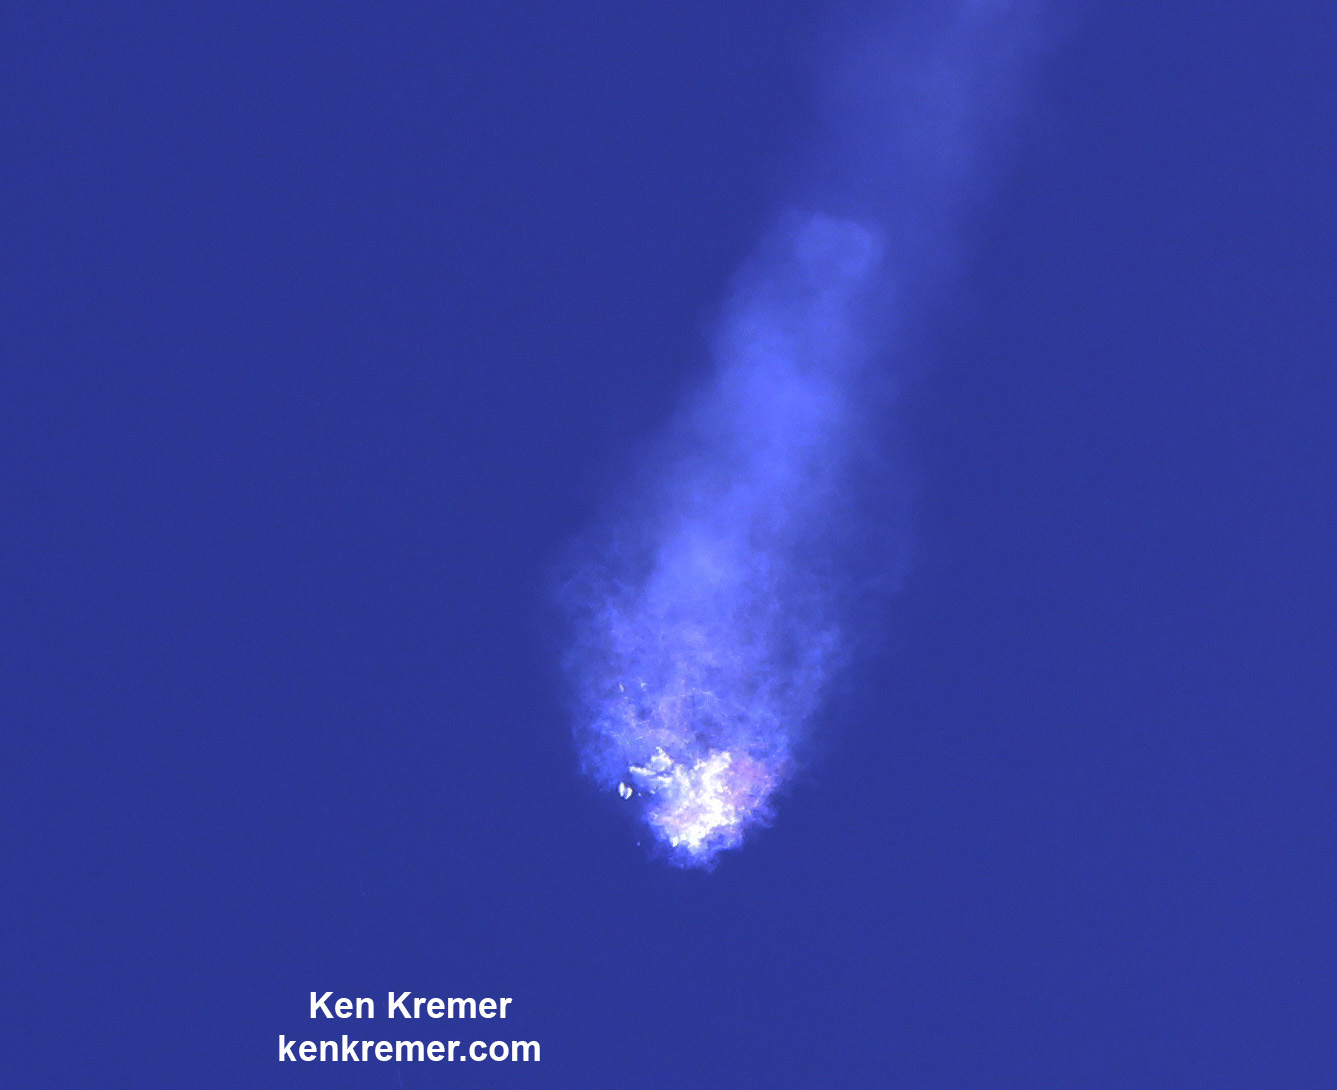
SpaceX Falcon 9 rocket and Dragon resupply spaceship explode about 2 minutes after liftoff from Cape Canaveral Air Force Station in Florida on June 28, 2015. Credit: Ken Kremer/kenkremer.com
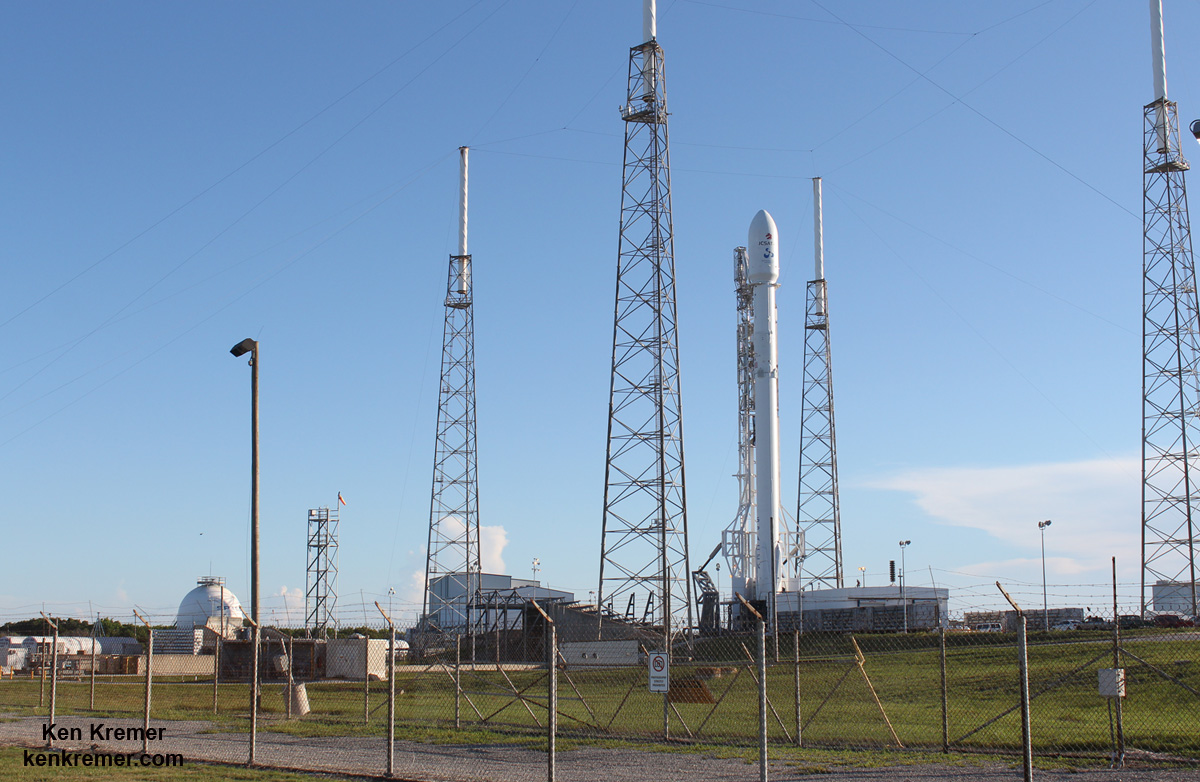
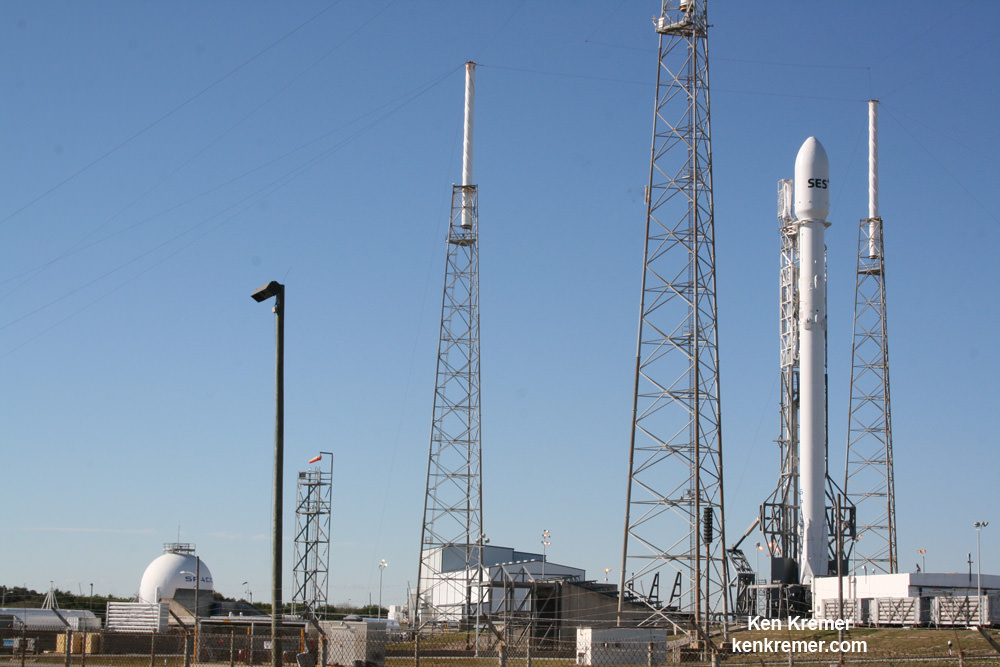
Here’s the prior SpaceX Falcon 9 on pad 40 before the successful liftoff with the JCSAT-16 Japanese telecom satellite on Aug. 14, 2016:
SpaceX Falcon 9 set to deliver JCSAT-16 Japanese communications satellite to orbit on Aug. 14, 2016 from Space Launch Complex 40 at Cape Canaveral Air Force Station, Fl. Credit: Ken Kremer/kenkremer.com
The AMOS-6 communications satellite was built by Israel Aerospace Industries for Space Communication Ltd. It was planned to provide communication services including direct satellite home internet for Africa, the Middle East and Europe.
Cape Canaveral Air Force Station Emergency Management quickly provided initial on-scene response and set up roadblocks, said the Air Force in a statement.
“Days like today are difficult for many reasons,” said Brig. Gen. Wayne Monteith, 45th Space Wing commander.
“There was the potential for things to be a lot worse; however, due to our processes and procedures no one was injured as a result of this incident. I am proud of our team and how we managed today’s response and our goal moving forward will be to assist and provide support wherever needed. Space is inherently dangerous and because of that, the Air Force is always ready.”
Stay tuned here for Ken’s continuing Earth and Planetary science and human spaceflight news.
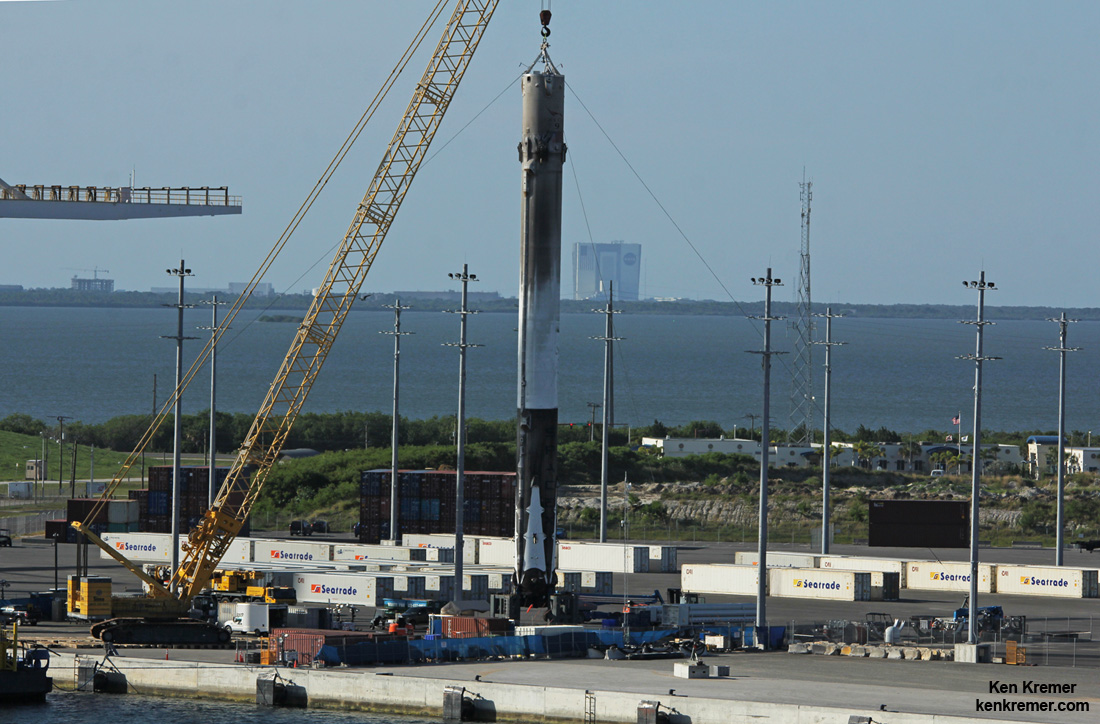
A SpaceX Falcon 9 rocket is destroyed during explosion at the pad on Sept. 1, 2016. Only the strongback remains. A static hot fire test was planned ahead of scheduled launch on Sept. 3, 2016 of Amos-6 comsat. Credit: NASAThis recovered 156-foot-tall (47-meter) SpaceX Falcon 9 first stage has arrived back into Port Canaveral, FL after successfully launching JCSAT-16 Japanese communications satellite to orbit on Aug. 14, 2016 from Space Launch Complex 40 at Cape Canaveral Air Force Station, Fl. NASA’s VAB in the background – as seen from Exploration Tower on Aug. 19. Credit: Ken Kremer/kenkremer.com
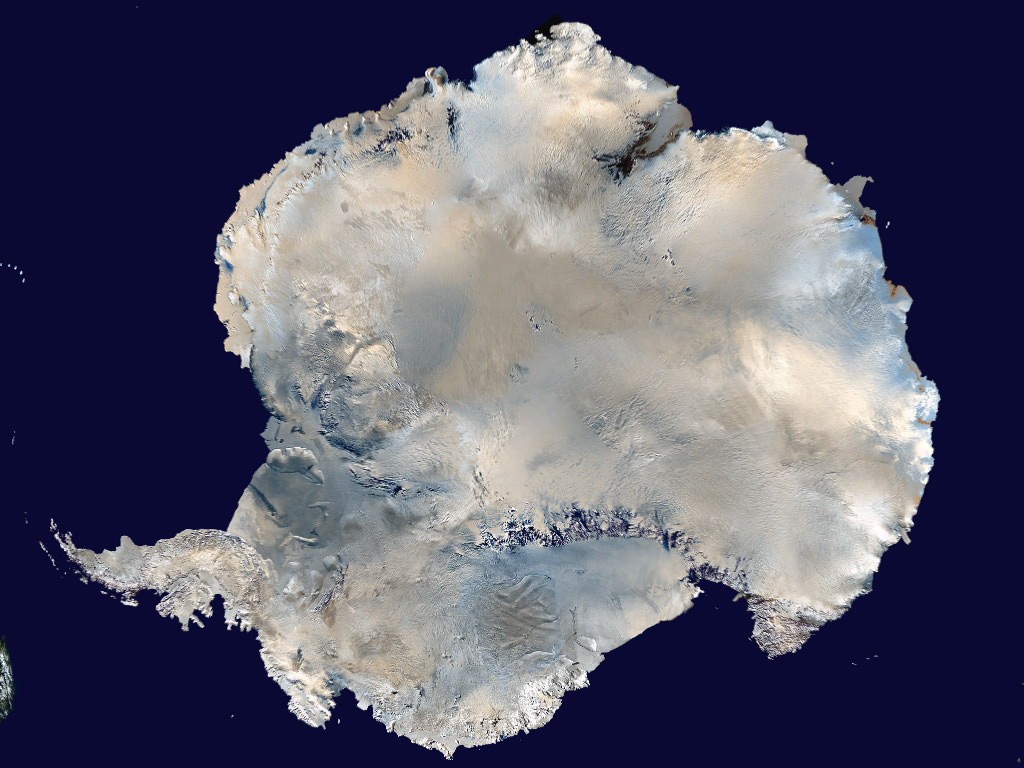
Composite satellite image of Antarctica, the location of the largest desert on Earth. Credit: NASA/Dave Pape
When you hear the word desert, what comes to mind? Chances are, you’d think of sun, sand, and very little in the way of rain. Perhaps cacti, vultures, mesas, and scorpions come to mind as well, or possibly camels and oases? But in truth, deserts come in all shapes and sizes, and vary considerably from one part of the world to the next.
Like all of Earth’s climates, it all comes down to some basic characteristics that they share – which in this case, involves being barren, dry, and hostile to life. For this reason, you might be surprised to learn that the largest desert in the world is actually in Antarctica. How’s that for a curveball?
Definition:
To break it down, a desert is a region that is simply very dry because its receives little to no water. To be considered a desert, an area must receive than 250 millimeters of annual precipitation. But precipitation can take the form of rain, snow, mist or fog – literally any form of water being transferred from the atmosphere to the earth.
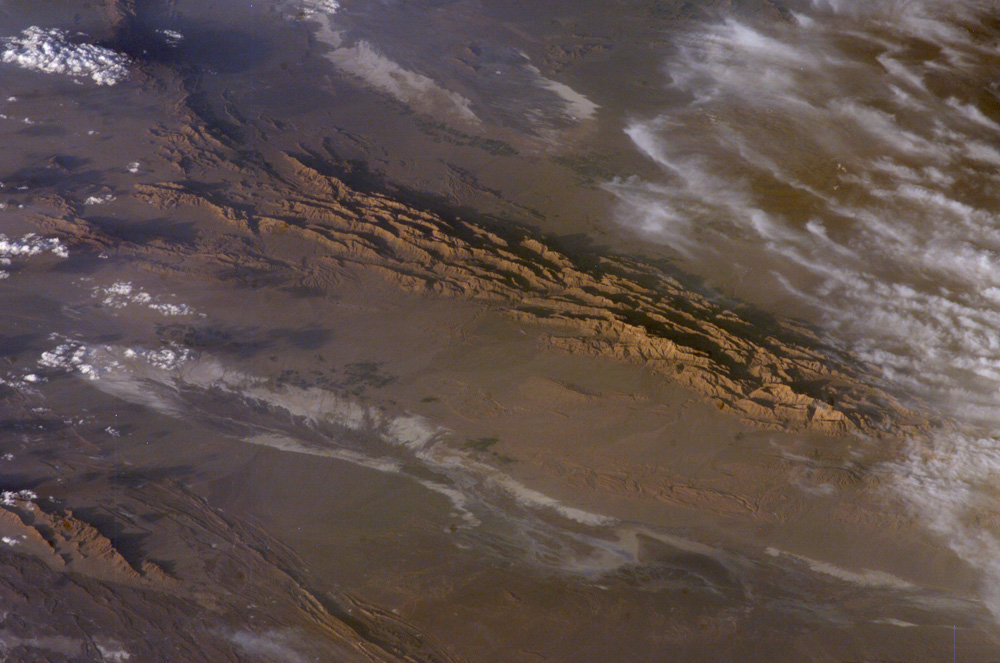
The Lut Desert of Iran, as observed by NASA’s Earth Observatory. It was here that the hottest temperature ever was recorded between 2003-9. Credit: NASA
Deserts can also be described as areas where more water is lost by evaporation than falls as precipitation. This certainly applies in regions that are subject to “desertification”, where increasing temperatures (i.e. climate change) result in river beds drying up, precipitation patterns changing, and vegetation dying off.
Deserts are often some of the hottest and most inhospitable places on Earth, as exemplified by the Sahara Desert in Africa, the Gobi desert in northern China and Mongolia, and Death Valley in California. But they can also be cold, windswept landscapes where little to no snow ever falls – like in the Antarctic and Arctic.
So in the end, being hot has little to do with it. In fact, it would be more accurate to say that deserts are characterized by little to no moisture and extremes in temperature. All told, deserts make up one-third of the surface of the Earth. But most of that is found in the polar regions.
Antarctica:
In terms of sheer size, the Antarctic Desert is the largest desert on Earth, measuring a total of 13.8 million square kilometers. Antarctica is the coldest, windiest, and most isolated continent on Earth, and is considered a desert because its annual precipitation can be less than 51 mm in the interior.
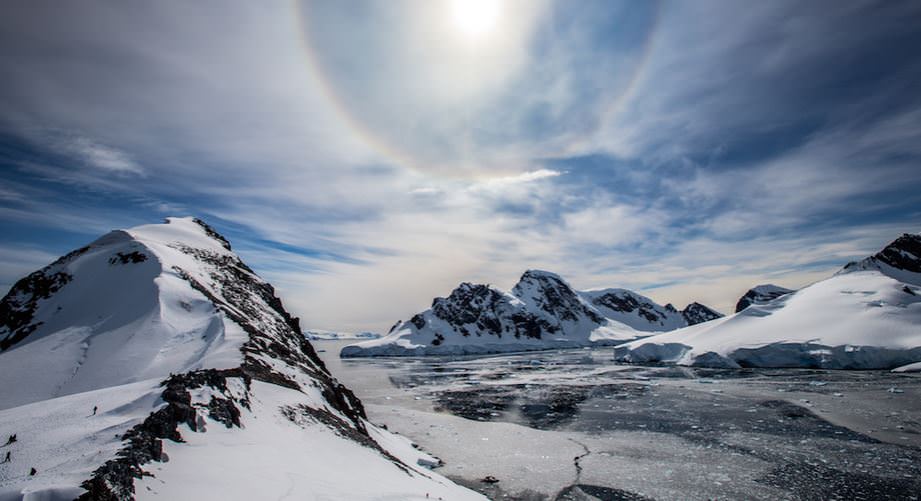
A Sun halo seen among the the landscape and ice flows of Antarctica. Credit and copyright: Alex Cornell
It’s covered by a permanent ice sheet that contains 90% of the Earth’s fresh water. Only 2% of the continent isn’t covered by ice, and this land is strictly along the coasts, where all the life that is associated with the land mass (i.e. penguins, seals and various species of birds) reside. The other 98% of Antarctica is covered by ice which averages 1.6 km in thickness.
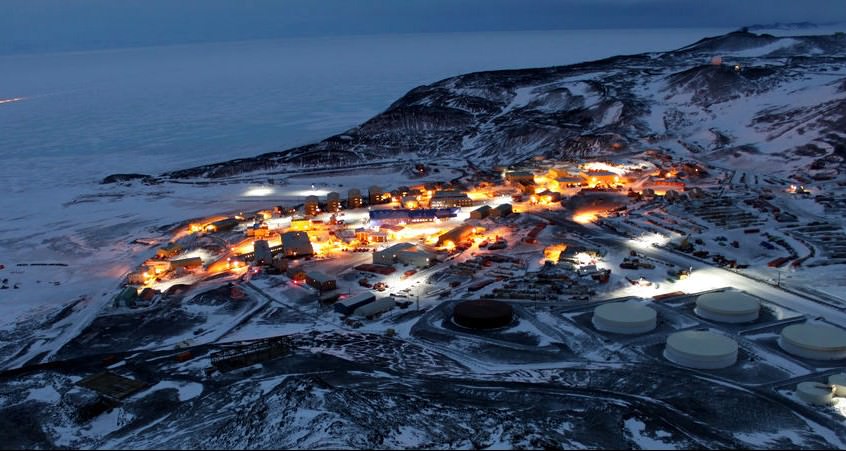
There are no permanent human residents, but anywhere from 1,000 to 5,000 researchers inhabit the research stations scattered across the continent – the largest being McMurdo Station, located on the tip of Ross Island. Beyond a limited range of mammals, only certain cold-adapted species of mites, algaes, and tundra vegetation can survive there.
Despite having very little precipitation, Antarctica still experiences massive windstorms. Much like sandstorms in the desert, the high winds pick up snow and turn into blizzards. These storms can reach speeds of up to 320 km an hour (200 mph) and are one of the reasons the continent is so cold.
In fact, the coldest temperature ever recorded was taken at the Soviet Vostok Station on the Antarctic Plateau. Using ground-based measurements, the temperature reached a historic low of -89.2°C (-129°F) on July 21st, 1983. Analysis of satellite data indicated a probable temperature of around -93.2 °C (-135.8 °F; 180.0 K), also in Antarctica, on August 10th, 2010. However, this reading was not confirmed.
Antarctica’s McMurdo Station at night. Credit: m.earthtripper.com
Other Deserts:
Interestingly, the second-largest desert in the world is also notoriously cold – The Arctic Desert. Located above 75 degrees north latitude, the Arctic Desert covers a total area of about 13.7 million square km (5.29 million square mi). Here, the total amount of precipitation is below 250mm (10 inches), which is predominantly in the form of snow.
The average temperature in the Arctic Desert is -20 °C, reaching as low as -50 °C in the winter. But perhaps the most interesting aspect of the Arctic Desert is its sunshine patterns. During the summer months, the sun doesn’t set for a period of 60 days. These are then followed in the winter by a period of prolonged darkness.
The third largest desert in the world is the more familiar Sahara, with a total size of 9.4 million square km. The average annual rainfall ranges from very low (in the northern and southern fringes of the desert) to nearly non-existent over the central and the eastern part. All told, most of the Saraha receives less than 20 mm (0.79 in).
However, in northern fringe of the desert, low pressure systems from the Mediterranean Sea result in an annual rainfall of between 100 to 250 mm (3.93 – 9.84 in). The southern fringe of the desert – which extends from coastal Mauritania to the Sudan and Eritrea – receives the same amount of rainfall from the south. The central core of the desert, which is extremely arid, experiences an annual rainfall of less than 1 mm (0.04 in).
Temperatures are also quite intense in the Sahara, and can rise to more than 50 °C. Interestingly, this is not the hottest desert on the planet though. The hottest temperature ever recorded on Earth was 70.7 °C (159 °F), which was taken in the Lut Desert of Iran. These measurements were part of a global temperature survey conducted by scientists at NASA’s Earth Observatory during the summers of 2003 to 2009.
In short, deserts are not just sand dunes and places where you might come across Bedouins and Berbers, or a place you have to drive through to get to Napa Valley. They are common to every continent of the world, and can take the form of sandy deserts or icy deserts. In the end, the defining characteristic is their pronounced lack of moisture.
In that respect, the polar regions are the largest deserts in the world, with Antarctica narrowly beating out the Arctic for first place. And going by this definition – i.e. cold, arid, and with little to no precipitation – we’re sure to find some particularly big deserts elsewhere in Solar System. After all, what is Mars if not one big, cold, arid, and extremely dry climate?
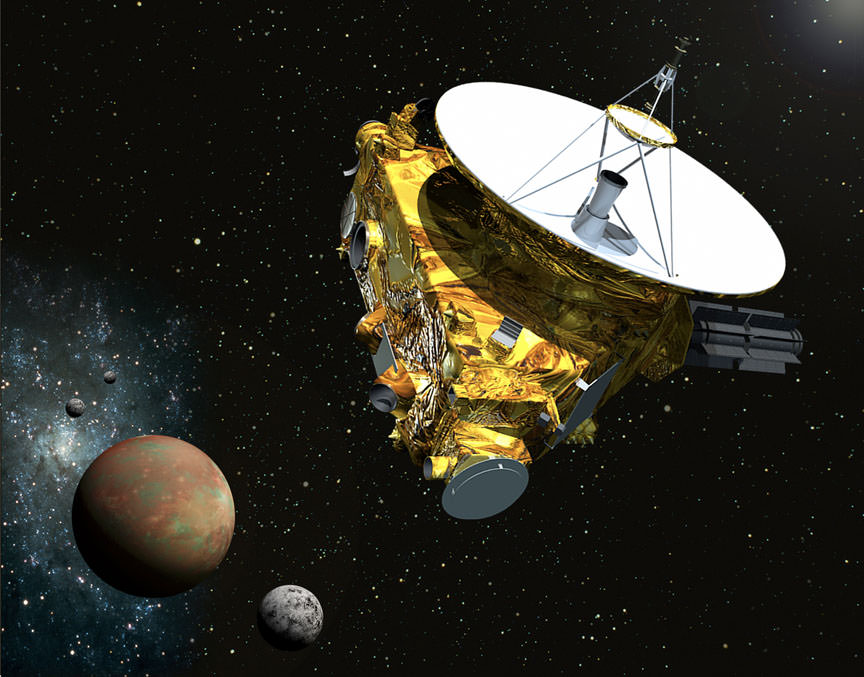
Artist view of New Horizons passing Pluto and three of its moons.. Credit: NASA/Johns Hopkins University Applied Physics Laboratory/Southwest Research Institute
Now more than a year after its historic flyby of Pluto, the New Horizons spacecraft continues to speed through the Kuiper Belt. It’s currently on a beeline towards its next target of exploration, a KBO called 2014 MU69. But during its travels, New Horizons spotted another KBO, one of Pluto’s pals, Quaoar.
This animated sequence shows composite images of the Kuiper Belt object Quaoar, taken by New Horizons’ Long Range Reconnaissance Imager (LORRI). Click on the image to animate. Credit: NASA/JHUAPL/SwRI.
When these images were taken (in July 2016), Quaoar was approximately 4 billion miles (6.4 billion kilometers) from the Sun and 1.3 billion miles (2.1 billion kilometers) from New Horizons.
The animated sequence, above, (click the image if it isn’t animating in your browser) shows composite images taken by New Horizons’ Long Range Reconnaissance Imager (LORRI) at four different times over July 13-14: “A” on July 13 at 02:00 Universal Time; “B” on July 13 at 04:08 UT; “C” on July 14 at 00:06 UT; and “D” on July 14 at 02:18 UT. The New Horizons team explained that each composite includes 24 individual LORRI images, providing a total exposure time of 239 seconds and making the faint object easier to see.
Quaoar ( pronounced like “Kwa-war”) is about 690 miles or 1,100 kilometers in diameter, about half the size of Pluto. It was discovered on June 4, 2002 by astronomers Mike Brown and Chad Trujillo from Caltech, and at the time of its discovery, it was the largest object found in the Solar System since the discovery of Pluto. Quaoar’s discovery was one of the things that spurred the discussion of whether Pluto should continue to be classified as a planet or not.
But Quaoar is an interesting object in its own right and the New Horizons team said the oblique views of it that New Horizons can see – where LORRI sees only a portion of Quaoar’s illuminated surface — is very different from the nearly fully illuminated view of it that is visible from Earth. Comparing Quaoar from the two very different perspectives gives mission scientists a valuable opportunity to study the light-scattering properties of Quaoar’s surface.
If you’re thinking, “Why don’t we send a mission to Quaoar, or Sedna or Eris?” you aren’t alone. New Horizons team member Alex Parker has obviously been thinking about it. Parker tweeted that for a New Horizons-like mission it would take about 13 and a half years to reach Quaoar if it could be launched in December 2016. “Otherwise, we have to wait another 11 years for the next Jupiter assist window,” he said.
Um, NASA, can we put this on the schedule for 2027?
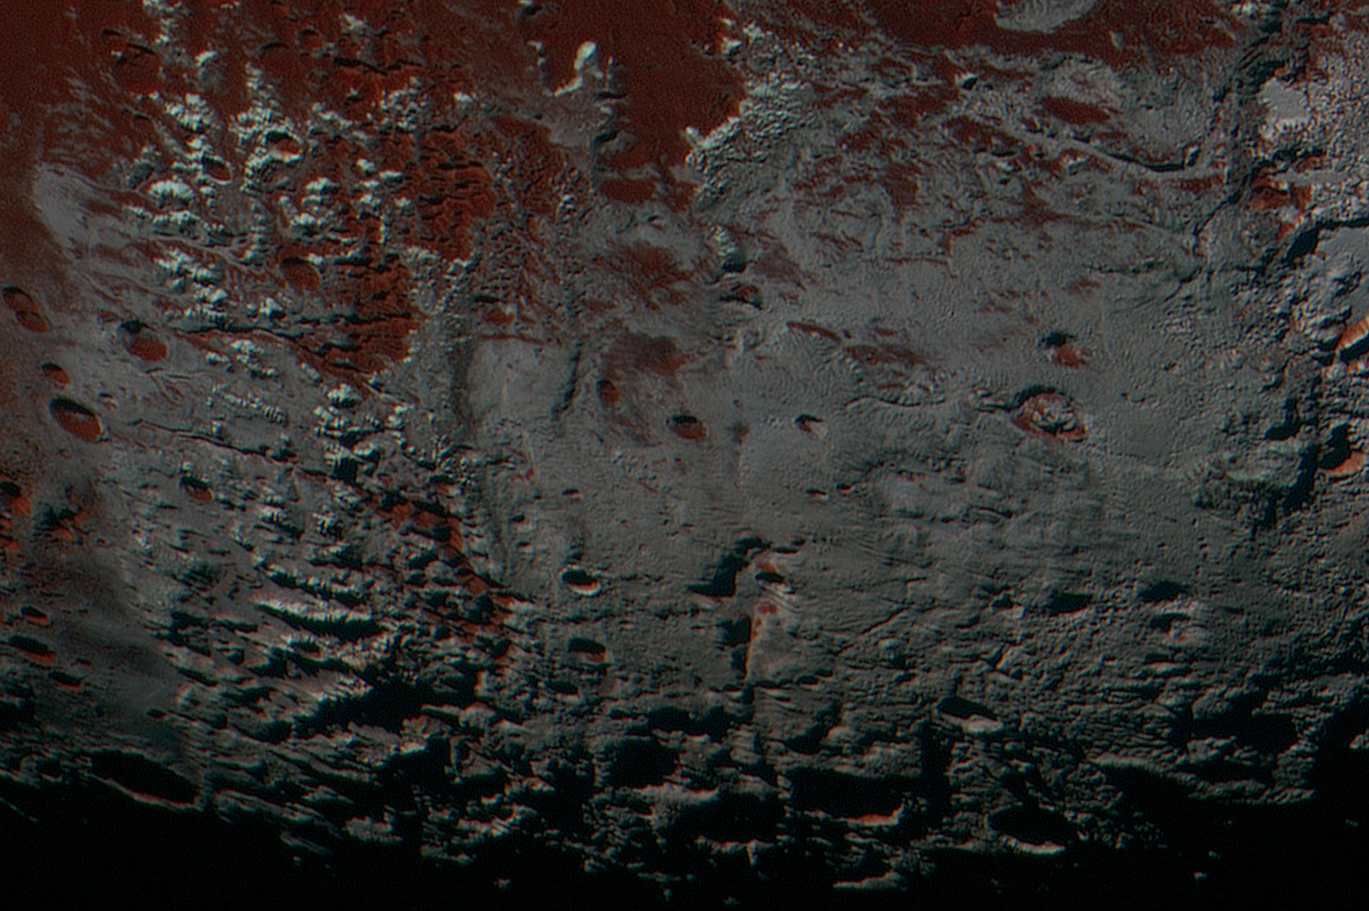
In the meantime, the images and data that New Horizons gathered during the Pluto flyby in July 2015 are still trickling back to Earth. The image below is a stunning view of Pluto’s methane snowcaps, visible at the terminator, showing the region north of Pluto’s dark equatorial band informally named Cthulhu Regio, and southwest of the vast nitrogen ice plains informally named Sputnik Planitia. This image was taken about 45 minutes before New Horizons’ closest approach to Pluto on July 14, 2015.
This area is south of Pluto’s dark equatorial band informally named Cthulhu Regio, and southwest of the vast nitrogen ice plains informally named Sputnik Planitia. North is at the top; in the western portion of the image, a chain of bright mountains extends north into Cthulhu Regio. New Horizons compositional data indicate the bright snowcap material covering these mountains isn’t water, but atmospheric methane that has condensed as frost onto these surfaces at high elevation. Between some mountains are sharply cut valleys – indicated by the white arrows. These valleys are each a few miles across and tens of miles long. Credit: NASA/Johns Hopkins University Applied Physics Laboratory/Southwest Research Institute.
See all of the latest photos sent back from our robot in the outer reaches of our Solar System at the New Horizons website.
Artist's impression of a spaceship making the jump to "light speed". Credit: NASA/Glenn Research Center
Since ancient times, philosophers and scholars have sought to understand light. In addition to trying to discern its basic properties (i.e. what is it made of – particle or wave, etc.) they have also sought to make finite measurements of how fast it travels. Since the late-17th century, scientists have been doing just that, and with increasing accuracy.
In so doing, they have gained a better understanding of light’s mechanics and the important role it plays in physics, astronomy and cosmology. Put simply, light moves at incredible speeds and is the fastest moving thing in the Universe. Its speed is considered a constant and an unbreakable barrier, and is used as a means of measuring distance. But just how fast does it travel?
Speed of Light (c):
Light travels at a constant speed of 1,079,252,848.8 (1.07 billion) km per hour. That works out to 299,792,458 m/s, or about 670,616,629 mph (miles per hour). To put that in perspective, if you could travel at the speed of light, you would be able to circumnavigate the globe approximately seven and a half times in one second. Meanwhile, a person flying at an average speed of about 800 km/h (500 mph), would take over 50 hours to circle the planet just once.
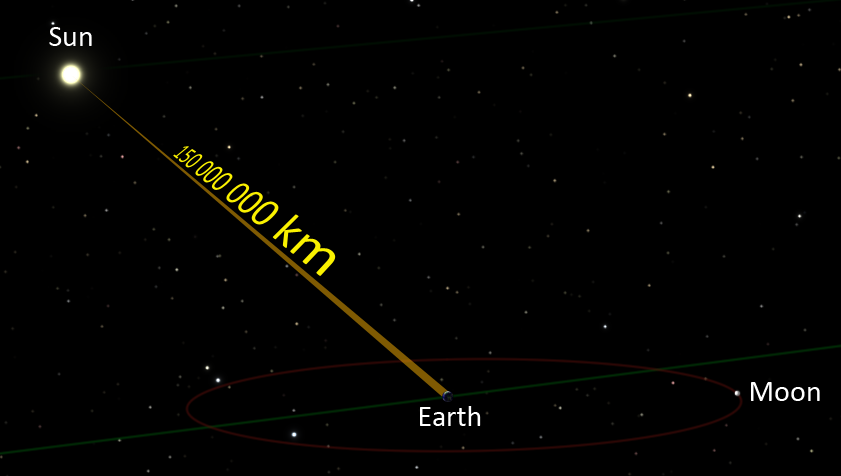
Illustration showing the distance light travels between the Earth and the Sun. Credit: LucasVB/Public Domain
To put that into an astronomical perspective, the average distance from the Earth to the Moon is 384,398.25 km (238,854 miles ). So light crosses that distance in about a second. Meanwhile, the average distance from the Sun to the Earth is ~149,597,886 km (92,955,817 miles), which means that light only takes about 8 minutes to make that journey.
Little wonder then why the speed of light is the metric used to determine astronomical distances. When we say a star like Proxima Centauri is 4.25 light years away, we are saying that it would take – traveling at a constant speed of 1.07 billion km per hour (670,616,629 mph) – about 4 years and 3 months to get there. But just how did we arrive at this highly specific measurement for “light-speed”?
History of Study:
Until the 17th century, scholars were unsure whether light traveled at a finite speed or instantaneously. From the days of the ancient Greeks to medieval Islamic scholars and scientists of the early modern period, the debate went back and forth. It was not until the work of Danish astronomer Øle Rømer (1644-1710) that the first quantitative measurement was made.
In 1676, Rømer observed that the periods of Jupiter’s innermost moon Io appeared to be shorter when the Earth was approaching Jupiter than when it was receding from it. From this, he concluded that light travels at a finite speed, and estimated that it takes about 22 minutes to cross the diameter of Earth’s orbit.
Prof. Albert Einstein delivering the 11th Josiah Willard Gibbs lecture at the Carnegie Institute of Technology on Dec. 28th, 1934, where he expounded on his theory of how matter and energy are the same thing in different forms. Credit: AP Photo
Christiaan Huygens used this estimate and combined it with an estimate of the diameter of the Earth’s orbit to obtain an estimate of 220,000 km/s. Isaac Newton also spoke about Rømer’s calculations in his seminal work Opticks (1706). Adjusting for the distance between the Earth and the Sun, he calculated that it would take light seven or eight minutes to travel from one to the other. In both cases, they were off by a relatively small margin.
Later measurements made by French physicists Hippolyte Fizeau (1819 – 1896) and Léon Foucault (1819 – 1868) refined these measurements further – resulting in a value of 315,000 km/s (192,625 mi/s). And by the latter half of the 19th century, scientists became aware of the connection between light and electromagnetism.
This was accomplished by physicists measuring electromagnetic and electrostatic charges, who then found that the numerical value was very close to the speed of light (as measured by Fizeau). Based on his own work, which showed that electromagnetic waves propagate in empty space, German physicist Wilhelm Eduard Weber proposed that light was an electromagnetic wave.
The next great breakthrough came during the early 20th century/ In his 1905 paper, titled “On the Electrodynamics of Moving Bodies”, Albert Einstein asserted that the speed of light in a vacuum, measured by a non-accelerating observer, is the same in all inertial reference frames and independent of the motion of the source or observer.
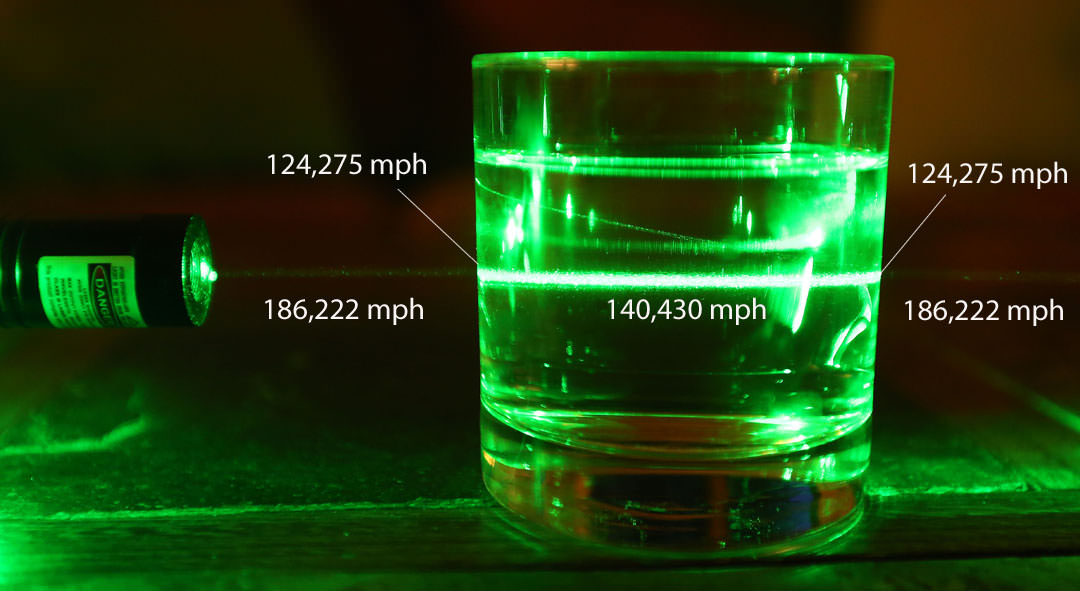
A laser shining through a glass of water demonstrates how many changes in speed (in mph) it undergoes as it passes from air, to glass, to water, and back again. Credit: Bob King
Using this and Galileo’s principle of relativity as a basis, Einstein derived the Theory of Special Relativity, in which the speed of light in vacuum (c) was a fundamental constant. Prior to this, the working consensus among scientists held that space was filled with a “luminiferous aether” that was responsible for its propagation – i.e. that light traveling through a moving medium would be dragged along by the medium.
This in turn meant that the measured speed of the light would be a simple sum of its speed through the medium plus the speed of that medium. However, Einstein’s theory effectively made the concept of the stationary aether useless and revolutionized the concepts of space and time.
Not only did it advance the idea that the speed of light is the same in all inertial reference frames, it also introduced the idea that major changes occur when things move close the speed of light. These include the time-space frame of a moving body appearing to slow down and contract in the direction of motion when measured in the frame of the observer (i.e. time dilation, where time slows as the speed of light approaches).
His observations also reconciled Maxwell’s equations for electricity and magnetism with the laws of mechanics, simplified the mathematical calculations by doing away with extraneous explanations used by other scientists, and accorded with the directly observed speed of light.
During the second half of the 20th century, increasingly accurate measurements using laser inferometers and cavity resonance techniques would further refine estimates of the speed of light. By 1972, a group at the US National Bureau of Standards in Boulder, Colorado, used the laser inferometer technique to get the currently-recognized value of 299,792,458 m/s.
Role in Modern Astrophysics:
Einstein’s theory that the speed of light in vacuum is independent of the motion of the source and the inertial reference frame of the observer has since been consistently confirmed by many experiments. It also sets an upper limit on the speeds at which all massless particles and waves (which includes light) can travel in a vacuum.
One of the outgrowths of this is that cosmologists now treat space and time as a single, unified structure known as spacetime – in which the speed of light can be used to define values for both (i.e. “lightyears”, “light minutes”, and “light seconds”). The measurement of the speed of light has also become a major factor when determining the rate of cosmic expansion.
Beginning in the 1920’s with observations of Lemaitre and Hubble, scientists and astronomers became aware that the Universe is expanding from a point of origin. Hubble also observed that the farther away a galaxy is, the faster it appears to be moving. In what is now referred to as the Hubble Parameter, the speed at which the Universe is expanding is calculated to 68 km/s per megaparsec.
This phenomena, which has been theorized to mean that some galaxies could actually be moving faster than the speed of light, may place a limit on what is observable in our Universe. Essentially, galaxies traveling faster than the speed of light would cross a “cosmological event horizon”, where they are no longer visible to us.
Also, by the 1990’s, redshift measurements of distant galaxies showed that the expansion of the Universe has been accelerating for the past few billion years. This has led to theories like “Dark Energy“, where an unseen force is driving the expansion of space itself instead of objects moving through it (thus not placing constraints on the speed of light or violating relativity).
Along with special and general relativity, the modern value of the speed of light in a vacuum has gone on to inform cosmology, quantum physics, and the Standard Model of particle physics. It remains a constant when talking about the upper limit at which massless particles can travel, and remains an unachievable barrier for particles that have mass.
Perhaps, someday, we will find a way to exceed the speed of light. While we have no practical ideas for how this might happen, the smart money seems to be on technologies that will allow us to circumvent the laws of spacetime, either by creating warp bubbles (aka. the Alcubierre Warp Drive), or tunneling through it (aka. wormholes).
Until that time, we will just have to be satisfied with the Universe we can see, and to stick to exploring the part of it that is reachable using conventional methods.
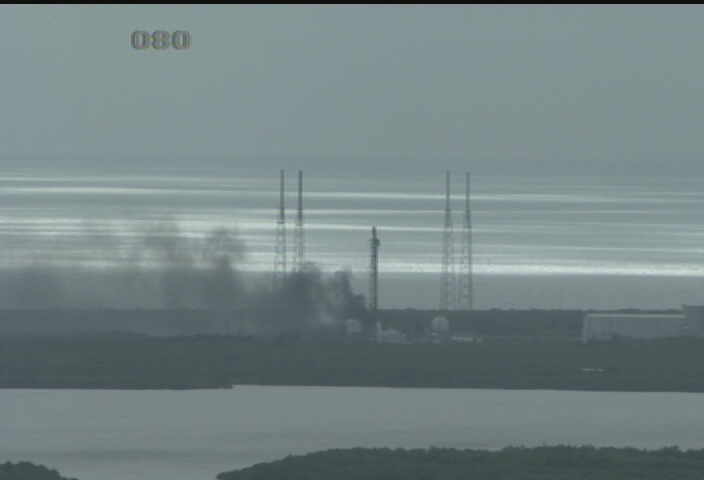
A SpaceX Falcon 9 rocket is destroyed during explosion at the pad on Sept. 1, 2016. Only the strongback remains. A static hot fire test was planned ahead of scheduled launch on Sept. 3, 2016 of Amos-6 comsat. Credit: NASA
A SpaceX Falcon 9 rocket is destroyed during explosion at the pad on Sept. 1, 2016. A static hot fire test was planned ahead of scheduled launch on Sept. 3, 2016 of Amos-6 comsat. Credit: CCAFS
BREAKING NEWS- A SpaceX Falcon 9 rocket and its Israeli commercial satellite payload were completely destroyed this morning, Thursday, September 1, during launch preparations ahead of the scheduled liftoff on Saturday, September 3.
The explosion occurred at approximately 9:07 a.m. this morning at the SpaceX launch facilities at Space Launch Complex 40 on Cape Canaveral Air Force Station, according to a statement from the USAF 45th Space Wing Public Affairs office.
Watch for additional details here and my interview on the BBC as this story is being frequently updated:
There were no injuries reported at this time.
SpaceX was preparing to conduct a routine static fire test of the first stage Merlin 1 D engine when the explosion took place this morning.
SpaceX media relations issued this statement:
“SpaceX can confirm that in preparation for today’s static fire, there was an anomaly on the pad resulting in the loss of the vehicle and its payload. Per standard procedure, the pad was clear and there were no injuries.”
The SpaceX Falcon 9 had been slated for an overnight blastoff on Saturday, September 3 at 3 a.m. from pad 40 with the AMOS-6 telecommunications satellite valued at some $200 million.
SpaceX sells Falcon 9 rockets at a list price of some $60 million.
This would have been the 9th Falcon 9 launch of 2016. SpaceX Falcon 9 rocket explosion. Credit: WTTV/Julian Leek
This explosion and the total loss of vehicle and payload will have far reaching consequences for not just SpaceX and the commercial satellite provider, but also NASA, the US military, and every other customer under a launch contact with the aerospace firm.
Here’s my interview with the BBC TV news a short while ago. Note that the cause is under investigation:
SpaceX is also trying to recover and recycle the Falcon 9 first stage.
Indeed as I reported just 2 days ago, SpaceX announce a contract with SES to fly the SES-10 communications satellite on a recycled Falcon 9.
This explosion will set back that effort and force a halt to all SpaceX launches until the root cause is determined.
Stay tuned here for Ken’s continuing Earth and Planetary science and human spaceflight news.
Upgraded SpaceX Falcon 9 prior to launch of SES-9 communications satellite on Mar. 4, 2016 from Pad 40 at Cape Canaveral, FL. Credit: Ken Kremer/kenkremer.com
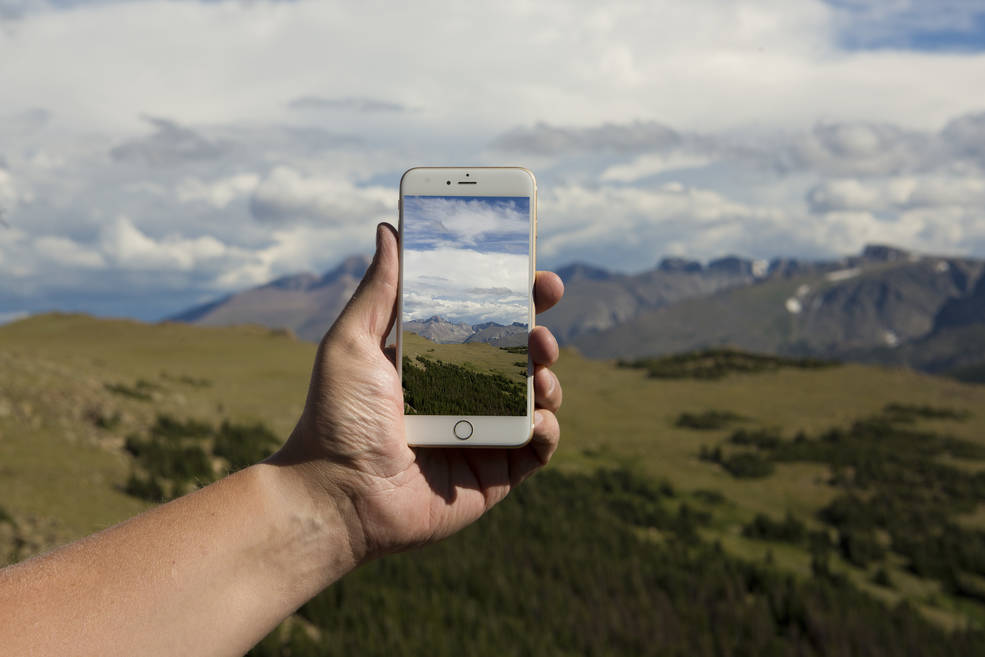
NASA's new app, the Globe Observer, will allow users to collect observations of clouds, and engage in a little citizen science. Image: NASA GLOBE Observer
It’s long been humanity’s dream to do something useful with our smartphones. Sure, we can take selfies, and post pictures of our meals, but true smartphone greatness has eluded us. Until now, that is.
Thanks to NASA, we can now do some citizen science with our ubiquitous devices.
For over 20 years, and in schools in over 110 countries, NASA’s Global Learning and Observations to Benefit the Environment (GLOBE) program has helped students understand their local environment in a global context. Now NASA has released the GLOBE Observer app, which allows users to capture images of clouds in their local environment, and share them with scientists studying the Earth’s climate.
“With the launch of GLOBE Observer, the GLOBE program is expanding beyond the classroom to invite everyone to become a citizen Earth scientist,” said Holli Riebeek Kohl, NASA lead of GLOBE Observer. The app will initially be used to capture cloud observations and images because they’re such an important part of the global climate system. But eventually, GLOBE Observer will also be used to observe land cover, and to identify types of mosquito larvae.
GLOBE has two purposes. One is to collect solid scientific data, the other is to increase users’ awareness of their own environments. “Once you collect environmental observations with the app, they are sent to the GLOBE data and information system for use by scientists and students studying the Earth,” said Kohl. “You can also use these observations for your own investigations and interact with a vibrant community of individuals from around the world who care about Earth system science and our global environment.”
Clouds are a dynamic part of the Earth’s climate system. Depending on their type, their altitude, and even the size of their water droplets, they either trap heat in the atmosphere, or reflect sunlight back into space. We have satellites to observe and study clouds, but they have their limitations. An army of citizen scientists observing their local cloud population will add a lot to the efforts of the satellites.
“Clouds are one of the most important factors in understanding how climate is changing now and how it’s going to change in the future,” Kohl said. “NASA studies clouds from satellites that provide either a top view or a vertical slice of the clouds. The ground-up view from citizen scientists is valuable in validating and understanding the satellite observations. It also provides a more complete picture of clouds around the world.”
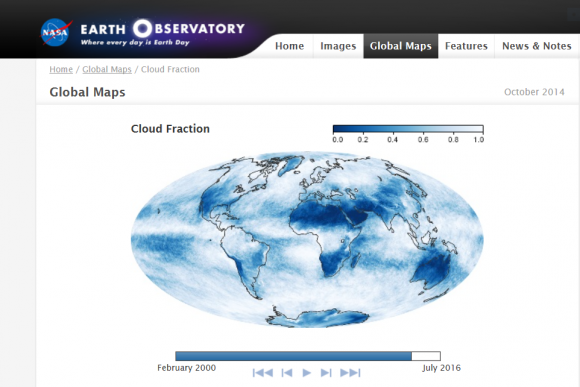
The observations collected by GLOBE users could end up as part of NASA’s Earth Observatory, which tracks the cloud fraction around the world. Image: NASA/NASA Earth Observation.
The GLOBE team has issued a challenge to any interested citizen scientists who want to use the app. Over the next two weeks, the team is hoping that users will make ground observations of clouds at the same time as a cloud-observing satellite passes overhead. “We really encourage all citizen scientists to look up in the sky and take observations while the satellites are passing over through Sept. 14,” said Kohl.
The app makes this easy to do. It informs users when a satellite will be passing overhead, so we can do a quick observation at that time. We can also use Facebook or Twitter to view daily maps of the satellite’s path.
“Ground measurements are critical to validate measurements taken from space through remote sensing,” said Erika Podest, an Earth scientist at NASA’s Jet Propulsion Laboratory in Pasadena, California, who is working with GLOBE data. “There are some places in the world where we have no ground data, so citizen scientists can greatly contribute to advancing our knowledge this important part of the Earth system.”
The app itself seems pretty straightforward. I checked for upcoming satellite flyovers and was notified of 6 flyovers that day. It’s pretty quick and easy to step outside and take an observation at one of those times.
I did a quick observation from the street in front of my house and it took about 2 minutes. To identify cloud types, you just match what you see with in-app photos of the different types of clouds. Then you estimate the percentage of cloud cover, or specify if the sky is obscured by blowing snow, or fog, or something else. You can also add pictures, and the app guides you in aiming the camera properly.
The GLOBE Observer app is easy to use, and kind of fun. It’s simple enough to fit a quick cloud observation in between selfies and meal pictures.
Download it and try it out.
You can download the IOS version from the App Store, and the Android version from Google Play.