New Signal May Be Evidence of Dark Matter, Say Researchers

Dark Matter Halo and dwarf galaxies
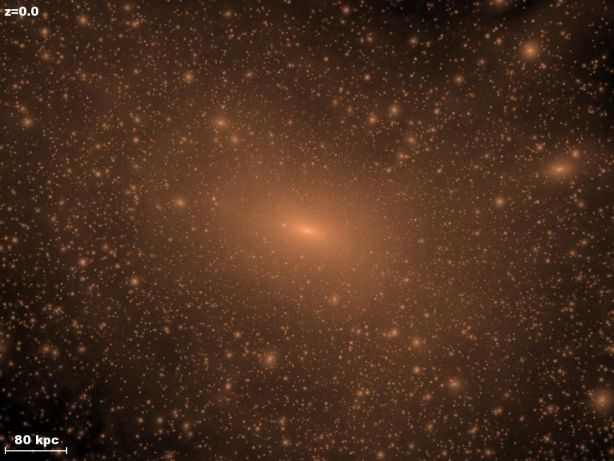
All galaxies are thought to have a dark matter halo. This image shows the distribution of dark matter surrounding our very own Milky Way. Image credit: J. Diemand, M. Kuhlen and P. Madau (UCSC)

Dark matter is the architect of large-scale cosmic structure and the engine behind proper rotation of galaxies. It’s an indispensable part of the physics of our Universe – and yet scientists still don’t know what it’s made of. The latest data from Planck suggest that the mysterious substance comprises 26.2% of the cosmos, making it nearly five and a half times more prevalent than normal, everyday matter. Now, four European researchers have hinted that they may have a discovery on their hands: a signal in x-ray light that has no known cause, and may be evidence of a long sought-after interaction between particles – namely, the annihilation of dark matter.

When astronomers want to study an object in the night sky, such as a star or galaxy, they begin by analyzing its light across all wavelengths. This allows them to visualize narrow dark lines in the object’s spectrum, called absorption lines. Absorption lines occur because a star’s or galaxy’s component elements soak up light at certain wavelengths, preventing most photons with those energies from reaching Earth. Similarly, interacting particles can also leave emission lines in a star’s or galaxy’s spectrum, bright lines that are created when excess photons are emitted via subatomic processes such as excitement and decay. By looking closely at these emission lines, scientists can usually paint a robust picture of the physics going on elsewhere in the cosmos.

But sometimes, scientists find an emission line that is more puzzling. Earlier this year, researchers at the Laboratory of Particle Physics and Cosmology (LPPC) in Switzerland and Leiden University in the Netherlands identified an excess bump of energy in x-ray light coming from both the Andromeda galaxy and the Perseus star cluster: an emission line with an energy around 3.5keV. No known process can account for this line; however, it is consistent with models of the theoretical sterile neutrino – a particle that many scientists believe is a prime candidate for dark matter.

The researchers believe that this strange emission line could result from the annihilation, or decay, of these dark matter particles, a process that is thought to release x-ray photons. In fact, the signal appeared to be strongest in the most dense regions of Andromeda and Perseus and increasingly more diffuse away from the center, a distribution that is also characteristic of dark matter. Additionally, the signal was absent from the team’s observations of deep, empty space, implying that it is real and not just instrumental artifact.

In a pre-print of their paper, the researchers are careful to stress that the signal itself is weak by scientific standards. That is, they can only be 99.994% sure that it is a true result and not just a rogue statistical fluctuation, a level of confidence that is known as 4σ. (The gold standard for a discovery in science is 5σ: a result that can be declared “true” with 99.9999% confidence) Other scientists are not so sure that dark matter is such a good explanation after all. According to predictions made based on measurements of the Lyman-alpha forest – that is, the spectral pattern of hydrogen absorption and photon emission within very distant, very old gas clouds – any particle purporting to be dark matter should have an energy above 10keV – more than twice the energy of this most recent signal.

As always, the study of cosmology is fraught with mysteries. Whether this particular emission line turns out to be evidence of a sterile neutrino (and thus of dark matter) or not, it does appear to be a signal of some physical process that scientists do not yet understand. If future observations can increase the certainty of this discovery to the 5σ level, astrophysicists will have yet another phenomena to account for – an exciting prospect, regardless of the final result.

The team’s research has been accepted to Physical Review Letters and will be published in an upcoming issue.

Why Can’t We See the Big Bang?

Why Can’t We See the Big Bang?

Since telescopes let us look back in time, shouldn’t we be able to see all the way back to the very beginning of time itself? To the moment of the Big Bang?

You’ve probably heard that looking out into space is like looking back in time. As it takes light 1 second to get from the Moon to us. Whenever we view it, we’re seeing it 1 second in the past. The Sun is 8 light minutes away, and the light we see from it is from 8 minutes into the past.

A better example might be Andromeda, it’s 2.5 million light years away… and you guessed it, we’re seeing it 2.5 million years in the past. Since the Big Bang happened 13.7 billion years ago, using this idea, shouldn’t we be able look all the way back to the beginning of time, even if we’ve misplaced the key to our Tardis?

At the very beginning of the Universe, seconds after the Big Bang, everything was mushed together. Energy and matter were the same thing. Dogs and cats lived together. There was no difference between light and radiation, it was all just one united force.

You couldn’t see it, because light didn’t actually exist. There were no such thing as photons.

However, if you’re still insisting there’s no such thing as photons, you might want to check yourself. After these things started to separate. Photons and particles became actual things. Electromagnetism and the weak nuclear force split off and formed new bands, but could never quite get the momentum of the original lineup.

By the end of the first second, neutrons and protons were around, and they were getting mashed by the intense heat and pressure into the first elements. But you still couldn’t see that because the whole Universe was like the inside of a star. Everything was opaque. It was Scarlett Johansson hot, and too crazy to form stable atoms with electrons as we see today.

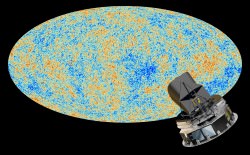
Artist's conception of Planck, a space observatory operated by the European Space Agency, and the cosmic microwave background. Credit: ESA and the Planck Collaboration - D. Ducros
Artist’s conception of Planck, a space observatory operated by the European Space Agency, and the cosmic microwave background. Credit: ESA and the Planck Collaboration – D. Ducros

After the Universe was about 380,000 years old, it had cooled down to the point that proper atoms could form. This is the moment when light could finally move, and travel distances across the Universe to you and get caught up in your light buckets. In fact, this light is known as the cosmic microwave background radiation.

So, how come we don’t see all this freed light in all directions with our eyes? It’s because the region of space where it exists is so far away, and travelling away from us so quickly. The light’s wavelengths have been stretched out to the point that light has been turned into microwaves. It’s only with sensitive radio telescopes and space missions that astronomers can even detect it.

Unfortunately, we’ll never be able to see the Big Bang. Even though we’re looking back in time, right to the edge of the observable Universe, it’s just beyond our reach. If you could look at the Universe at any point in time, what would it be? Tell us in the comments below.

And if you like what you see, come check out our Patreon page and find out how you can get these videos early while helping us bring you more great content!

Where is Earth Located?

Where is Earth Located?

You’ve probably heard the saying “everything’s relative”. When you consider our place in the Universe, everything really is relative. I’m recording this halfway up Vancouver Island, in the Pacific Ocean, off the West Coast of Canada. And where I’m standing is about 6,370 kilometers away from the center of the Earth, that way.

From my perspective, the Sun is over there. It’s as large as a dime held at arm’s length. For me it’s really, really far away. In fact, at this exact time it’s further away than any object I you can see with the naked eye.I’m about 150 million kilometers away from the Sun, and so are you.

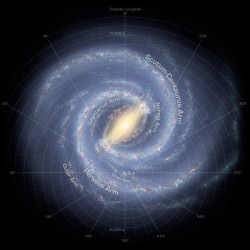
We’re carving out an elliptical orbit which takes one full year to complete one whole trip around. You, me and the Earth are all located inside our Solar System. Which contains the Sun, 8 planets and a vast collection of ice, rocks and dust. We’re embedded deep within our galaxy, the Milky Way. It’s a big flat disk of stars measuring up to 120,000 light years across.

Our Solar System is located in the middle of this galactic disk. And by the middle, I mean the center of the galaxy is about 27,000 light years that way, and the edge of the galaxy is about the same distance that way.

Our Milky Way is but one galaxy in a larger collection of galaxies known as the Local Group. There are 36 known objects in the local group. Which are mostly dwarf galaxies. However, there’s also the Triangulum Galaxy, the Milky Way, and the Andromeda galaxy… which is by far the largest, most massive object in the Local Group, It’s twice the size and 4 times the mass of the Milky Way.

But where is it?

Milky Way. Image credit: NASA

From me, and you, Andromeda is located just an astronomically distant 2.5 million light years that way. Or would that be just short 2.5 million light-years that away? I’m sure you see where this is going.

The Local Group is embedded within a much larger group known as the Virgo Supercluster, containing at least 100 galaxy groups and clusters. The rough center of the supercluster is in the constellation Virgo. Which as of right now, is that way, about 65 million light years away. Which certainly makes the 2.5 million light years to Andromeda seem like an afternoon jaunt in the family car.

Unsurprisingly, The Virgo Supercluster is a part of a larger structure as well. The Pisces-Cetus Supercluster Complex. This is a vast filament of galactic superclusters measuring about 150 million light years across AND a billion light years long. The middle is just over that way. Right over there.

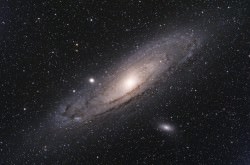
Astrophoto: Andromeda Galaxy by Fabio Bortoli
Andromeda Galaxy. Credit: Fabio Bortoli

One billion light years in length? Well that makes Andromeda seem right around the corner. So where are we? Where are you, and I and the Earth located in the entire Universe? The edge of the observable Universe is about 13.8 billion light years that way. But it’s also 13.8 billion light years that way. And that way, and that way.

And cosmologists think that if you travel in any direction long enough, you’ll return to your starting point, just like how you can travel in any one direction on the surface of the Earth and return right back at your starting point. In other words, the Earth is located at the very, very center of the Universe. Which sounds truly amazing.

What a strange coincidence for you and I to be located right here. Dead center. Smack dab right in the middle of the Universe. Certainly makes us sound important doesn’t it? But considering that every other spot in the Universe is also located at the center of the universe.

You heard me right. Every single spot that you can imagine inside the Universe is also the center of the Universe. That definitely complicates things in our plans for Universal relevance. And all this sure does make Andromeda seem close by….and it’s still just right over there, at the center of the Universe. Oh, and about every spot in the universe being the center of the Universe? Well, we’ll save that one for another episode.

Little Big Universe: Tilt-Shifted Astro Images Make Space Look Tiny

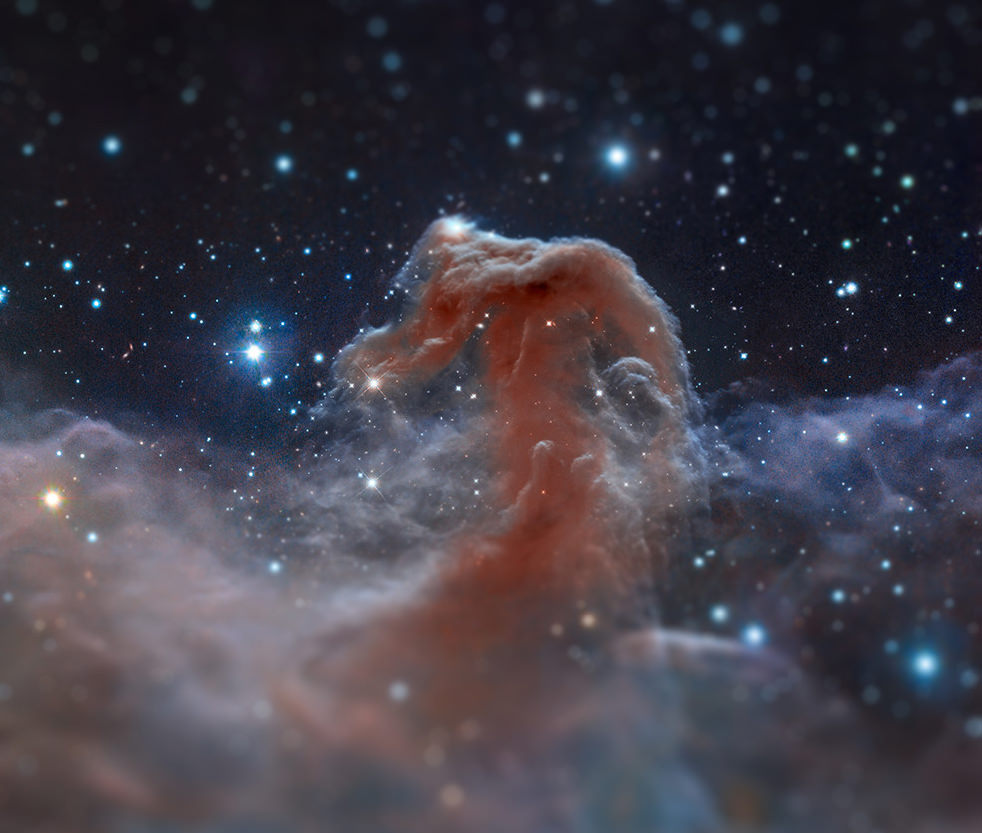
Hubble image of the Horsehead Nebula, "tilt-shifted" by Imgur user ScienceLlama (Original image credit: NASA, ESA, and the Hubble Heritage Team (STScI/AURA))

Aww, how cute! What an adorable little… nebula?

Although here it may look like it could fit in your hand, the Horsehead Nebula is obviously quite a bit larger – about 1.5 light-years across from “nose” to “mane.” But given a tilt-shift effect by Imgur.com user ScienceLlama, the entire structure takes on the appearance of something tiny — based purely on our eyes’ natural depth-of-field when peering at a small object close up. Usually done with Photoshop filters these days, it’s a gimmick, yes… but it works!

The original image was captured in infrared light by the Hubble Space Telescope and released in April 2013, in celebration of its 23rd anniversary.

Check out more of ScienceLlama’s “tiny universe” images below:

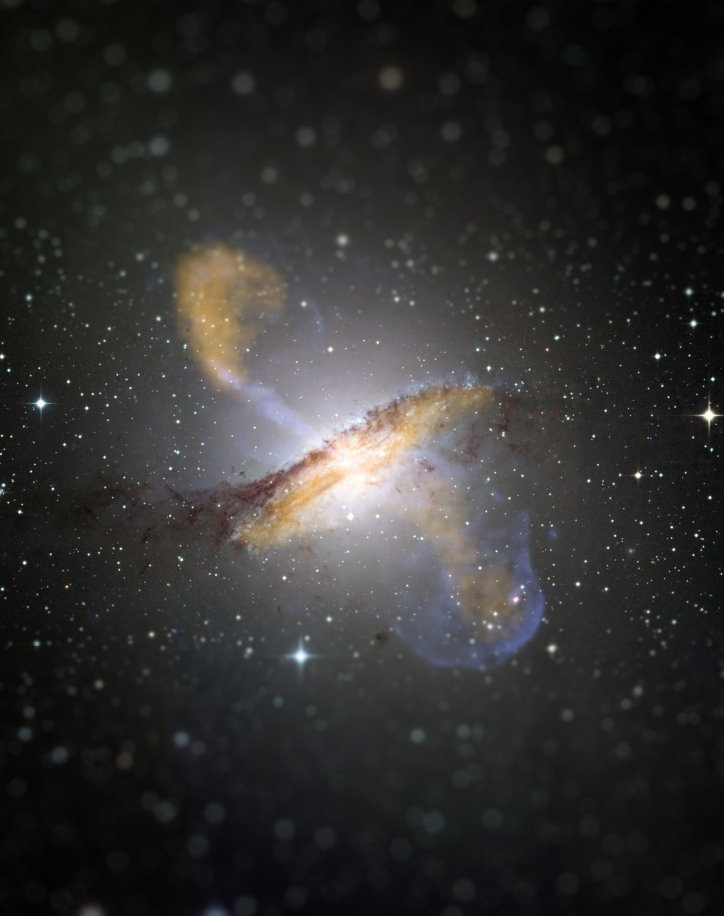
A tiny Centaurus A
A tiny Centaurus A
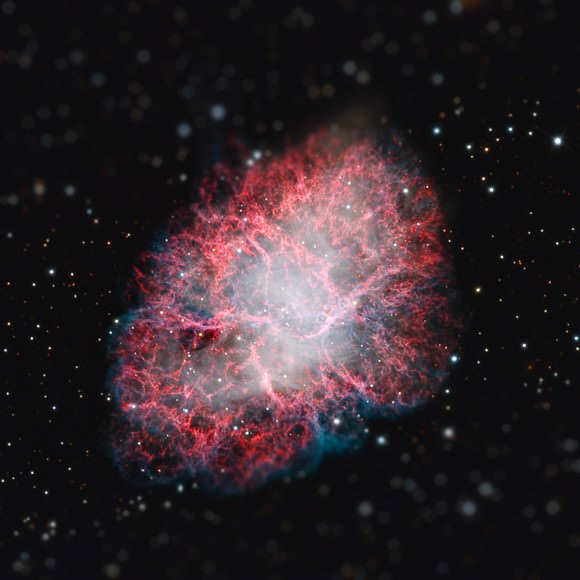
A tiny Crab Nebula (see original Spitzer image here)
A tiny Crab Nebula (see original NASA image here)
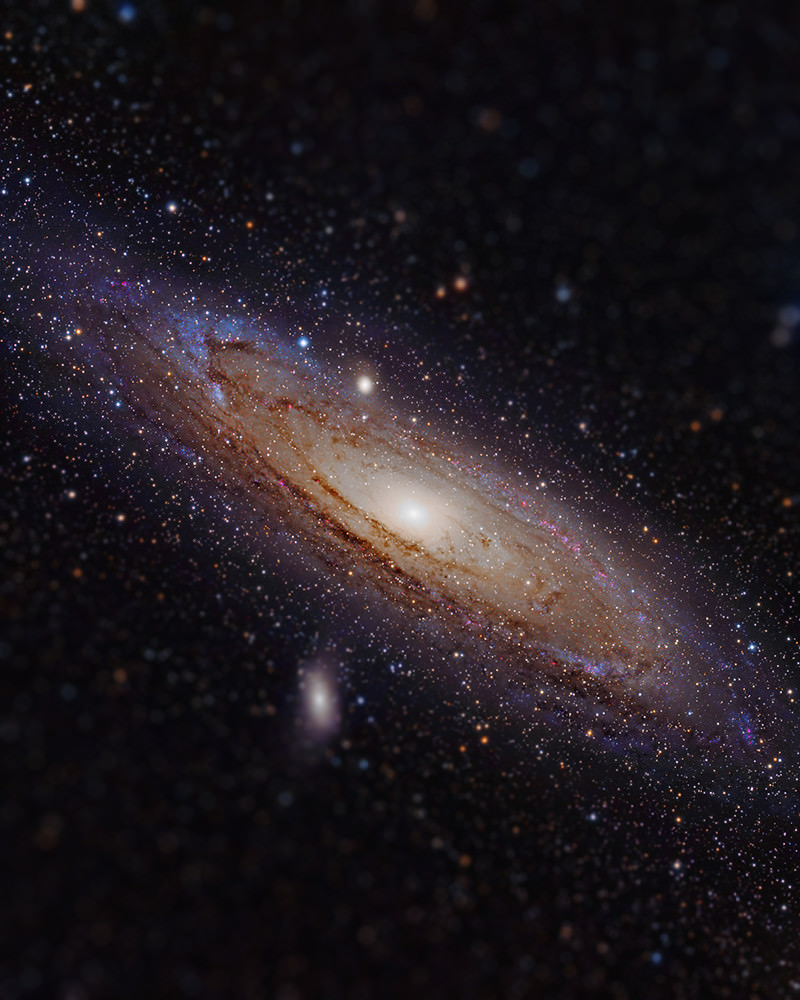
A tiny Andromeda Galaxy (see original here)
A tiny Andromeda Galaxy in hydrogen alpha (see original here)

See these and more on ScienceLlama’s Imgur page here, and follow Science Llama on Twitter here.

(H/T to Google+ user Brian Koberlein and fellow Space Community member Warren Isaac. Featured on Reddit.com.)

ADDITION 12/17: Several of these images (like this one) were originally processed by Robert Gendler from Hubble-acquired data, but the attribution was not noted by ScienceLlama. I apologize for the oversight — see more of Robert’s beautiful astrophotography on his website here. Another original source was Adam Block of the Mount Lemmon Sky Center.

How Big Are Galaxies?

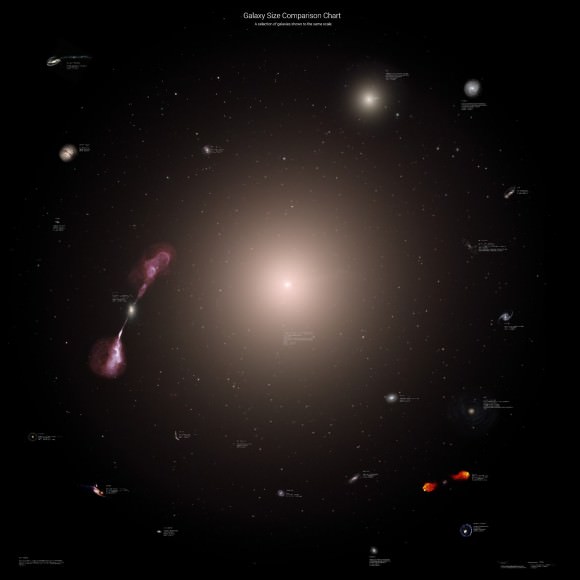
Galaxy size comparison chart by astrophysicist Rhys Taylor

I’m going to refrain from the initial response that comes to mind… actually, no I won’t — they’re really, really, really big!!!!

</Kermit arms>

Ok, now that that’s out of the way check out this graphic by Arecibo astrophysicist Rhys Taylor, which neatly illustrates the relative sizes of 25 selected galaxies using images made from NASA and ESA observation missions… including a rendering of our own surprisingly mundane Milky Way at the center for comparison. (Warning: this chart may adversely affect any feelings of bigness you may have once held dear.) According to Taylor on his personal blog, Physicists of the Caribbean (because he works had worked at the Arecibo Observatory in Puerto Rico) “Type in ‘asteroid sizes’ into Google and you’ll quickly find a bunch of  images comparing various asteroids, putting them all next to each at the same scale. The same goes for planets and stars. Yet the results for galaxies are useless. Not only do you not get any size comparisons, but scroll down even just a page and you get images of smartphones, for crying out loud.” So to remedy that marked dearth of galactic comparisons, Taylor made his own. Which, if you share my personal aesthetics, you’ll agree is quite nicely done.

“I tried to get a nice selection of well-known, interesting objects,” Taylor explains. “I was also a little limited in that I needed high-resolution images which completely mapped the full extent of each object… still, I think the final selection has a decent mix, and I reckon it was a productive use of a Saturday.” And even with the dramatic comparisons above, Taylor wasn’t able to accurately portray to scale one of the biggest — if not the biggest — galaxies in the observable universe: IC 1101.

For an idea of how we measure up to that behemoth, he made this graphic:

Galaxy sizes including IC 1101, the largest-known galaxy. Click for a zoomable version. (Credit: Rhys Taylor)

That big bright blur in the center? That’s IC 1101, the largest known galaxy — in this instance created by scaling up an image of M87, another supersized elliptical galaxy that just happens to be considerably closer to our own (and thus has had clearer images taken of it.) But the size is right — IC 1101 is gargantuan.

At an estimated 5.5 million light-years wide, over 50 Milky Ways could fit across it! And considering it takes our Solar System about 225 million years to complete a single revolution around the Milky Way… well… yeah. Galaxies are big. Really, really, reallyreally big!

</Kermit arms>

Now if you’ll pardon me, I need to go stop my head from spinning… Read this and more on Rhys Taylor’s blog here, and add Rhys to your awesome astronomy Google+ circles here. And you can find out more about IC 1101 in the video below from Tony Darnell, aka DeepAstronomy:

Lighting Up Andromeda’s Coldest Rings

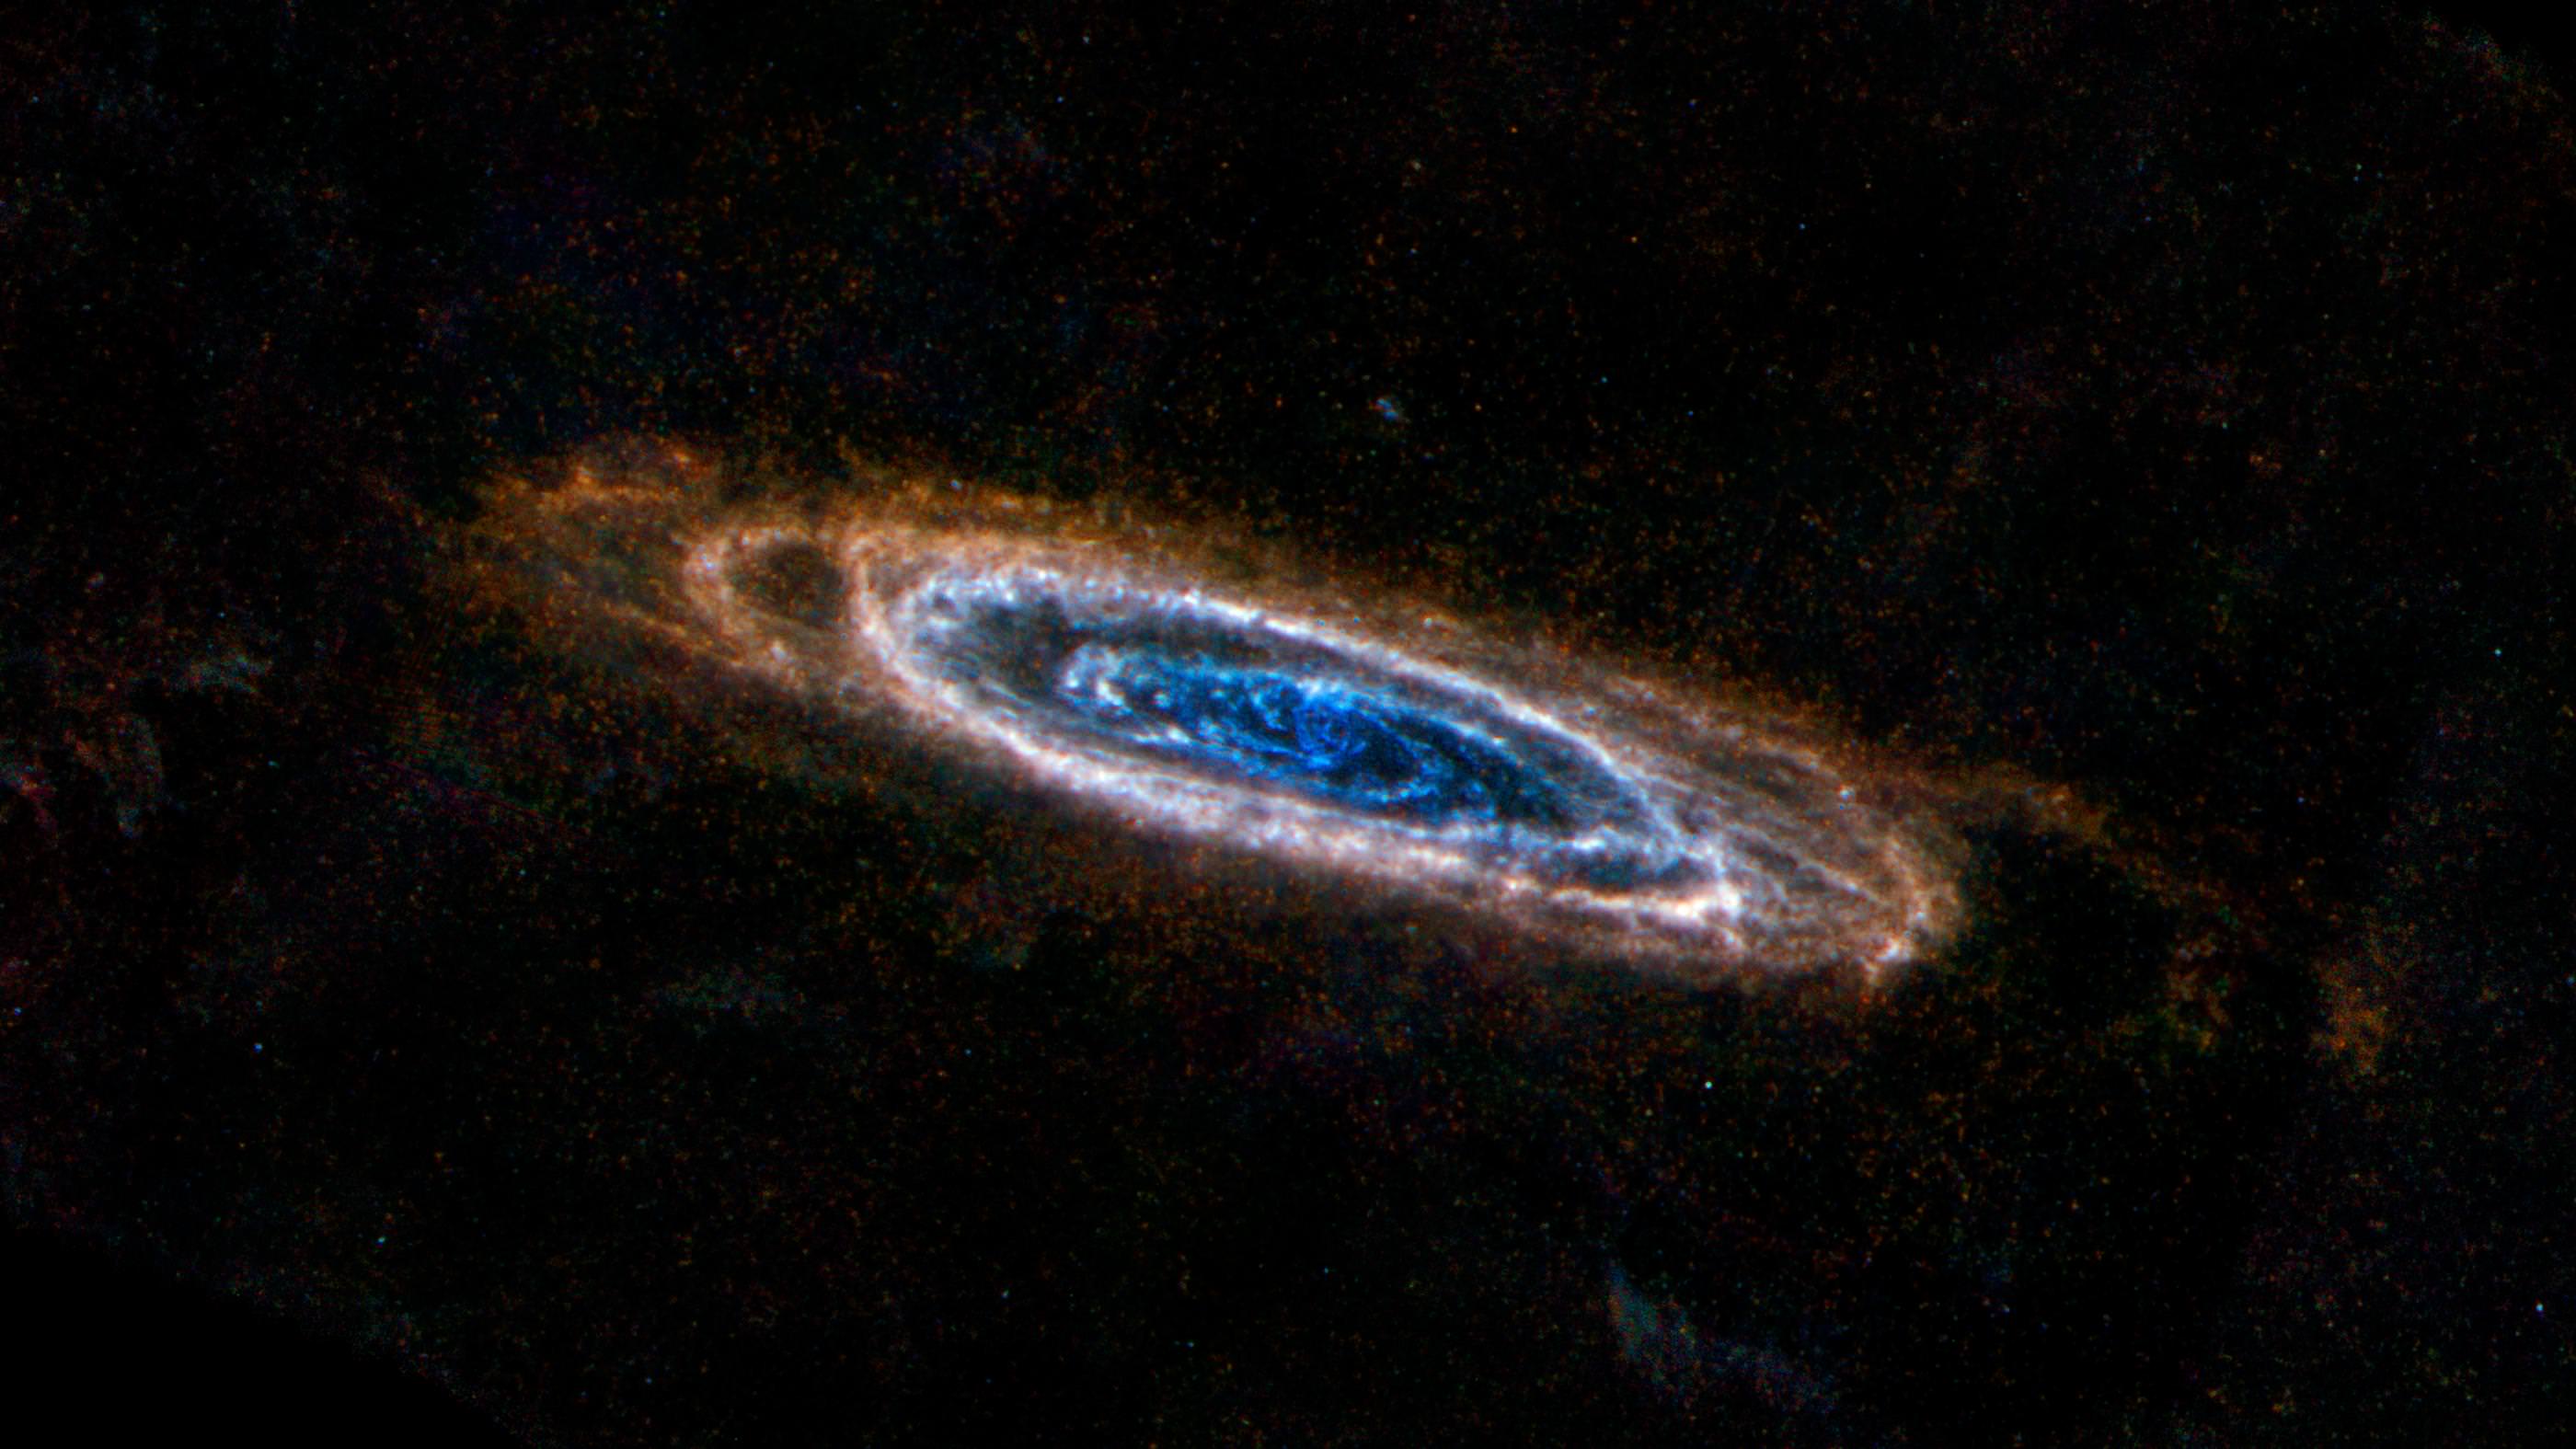
Cold rings of dust are illuminated in this image taken by Herschel’s Spectral and Photometric Imaging Receiver (SPIRE) instrument. Credit: ESA/NASA/JPL-Caltech/B. Schulz (NHSC)

Looking wispy and delicate from 2.5 million light-years away, cold rings of dust are seen swirling around the Andromeda galaxy in this new image from the Herschel Space Observatory, giving us yet another fascinating view of our galaxy’s largest neighbor.

The colors in the image correspond to increasingly warmer temperatures and concentrations of dust — blue rings are warmer, while pinks and reds are colder lanes of dust only slightly above absolute zero. Dark at shorter wavelengths, these dust rings are revealed by Herschel’s amazing sensitivity to the coldest regions of the Universe.

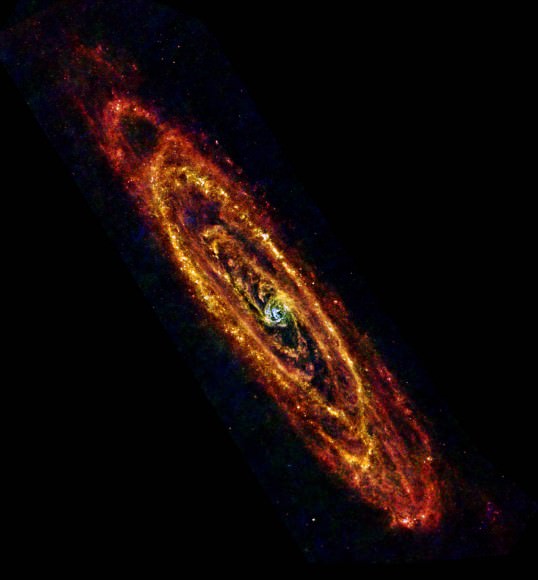
The image above shows data only from Herschel’s SPIRE (Spectral and Photometric Imaging Receiver) instrument; below is a mosaic made from SPIRE as well as the Photodetecting Array Camera and Spectrometer (PACS) instrument:

In this new view of the Andromeda galaxy from the Herschel space observatory, cool lanes of forming stars are revealed in the finest detail yet.

 “Cool Andromeda” Credit: ESA/Herschel/PACS & SPIRE Consortium, O. Krause, HSC, H. Linz

Estimated to be 200,000 light-years across — almost double the width of the Milky Way — Andromeda (M31) is home to nearly a trillion stars, compared to the 200–400 billion that are in our galaxy. And within these cold, dark rings of dust even more stars are being born… Andromeda’s star-making days are far from over.

Read more: Star Birth and Death in the Andromeda Galaxy

Herschel’s mission will soon be coming to an end as the telescope runs out of the liquid helium coolant required to keep its temperatures low enough to detect such distant heat signatures. This is expected to occur sometime in February or March.

Herschel is a European Space Agency cornerstone mission with science instruments provided by consortia of European institutes, and with important participation by NASA. Launched May 14, 2009, the telescope orbits the second Lagrange point of the Earth-Sun system (L2), located 1.5 million km (932,000 miles) from Earth. Read more from the Herschel mission here.

X-rays Reveal a Stellar-Mass Black Hole in Andromeda

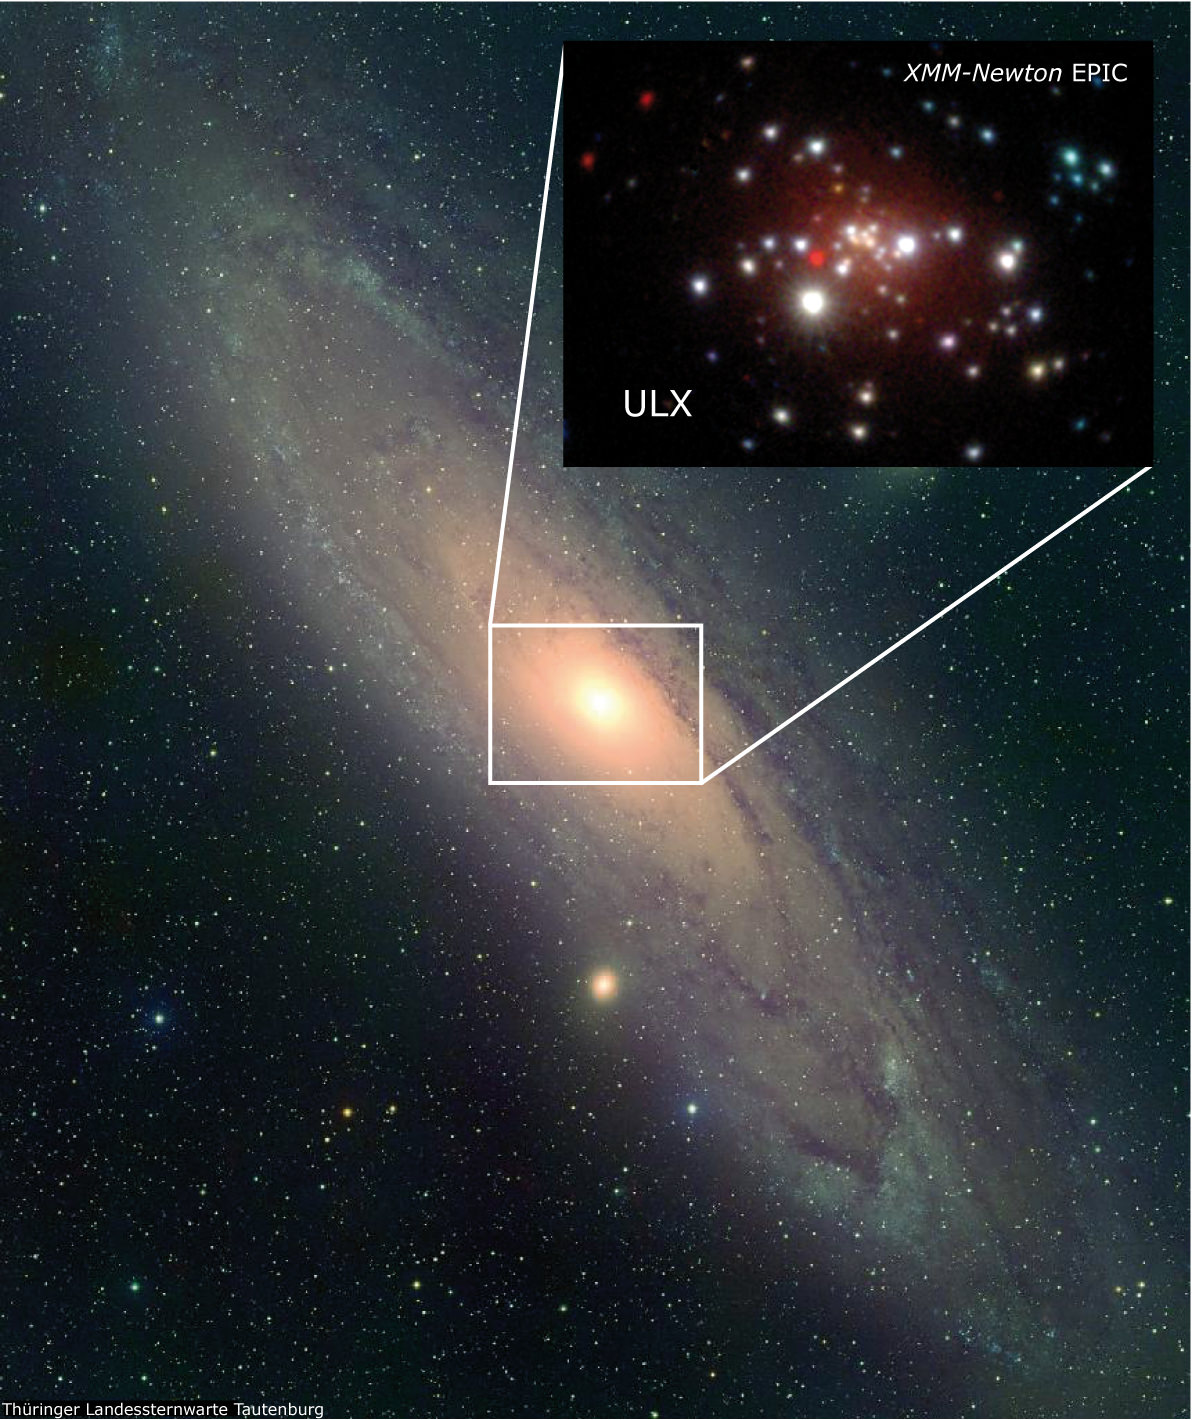
This image shows the central region of the Andromeda galaxy in X-rays, where the newly discovered ULX outshines all other sources. Image: Landessternwarte Tautenburg, XMM-Newton, MPE

[/caption]

An ultraluminous x-ray source (ULX) previously spotted in the neighboring Andromeda galaxy by NASA’s Chandra observatory has now been revealed to be a stellar-mass black hole, according to researchers at the Max Planck Institute for Extraterrestrial Physics.

The black hole was the first ULX seen in Andromeda, as well as the closest ever observed.

Ultraluminous x-ray sources are rare objects, observed in the near and distant Universe in the outer regions of galaxies. Typically only one or two ULXs are seen in any one particular galaxy — if there are any seen at all.

The large distances to ULXs makes detailed observations difficult, and so their exact causes have been hard to nail down.

This particular x-ray source was first identified in late 2009 by Chandra and was followed up with observations by Swift and Hubble. Classified by researchers at the Max Planck Institute as a low-luminosity source, it actually outshined the entire Andromeda galaxy in x-ray luminosity!

Continued observations with Chandra and ESA’s XMM-Newton showed behavior similar to known x-ray sources in our own Milky Way galaxy: actively feeding black holes.

“We were very lucky that we caught the ULX early enough to see most of its lightcurve, which showed a very similar behavior to other X-ray sources from our own galaxy,” said Wolfgang Pietsch from the Max Planck Institute for Extraterrestrial Physics. The emission decayed exponentially with a characteristic timescale of about one month, which is a common property of stellar mass X-ray binaries. “This means that the ULX in Andromeda likely contains a normal, stellar black hole swallowing material at very high rates.”

It’s estimated that the black hole is at least 13 times the mass of the Sun.

(Related: Stellar-Mass Black Hole Blows Record-Speed Winds)

Continued observations of the ULX/black hole will attempt to observe another outburst similar to the 2009 event, although if this black hole is anything like those observed in our galaxy it could be years before another such event occurs. Still, our relatively clear view of the Andromeda galaxy unobscured by intervening dust  and gas offers a chance to perhaps spot other potential x-ray sources residing there.

Read the report from the AlphaGalileo Foundation here, or on ScienceDaily here.

The first MPE team’s paper can be found here.

Stolen: Magellanic Clouds – Return to Andromeda

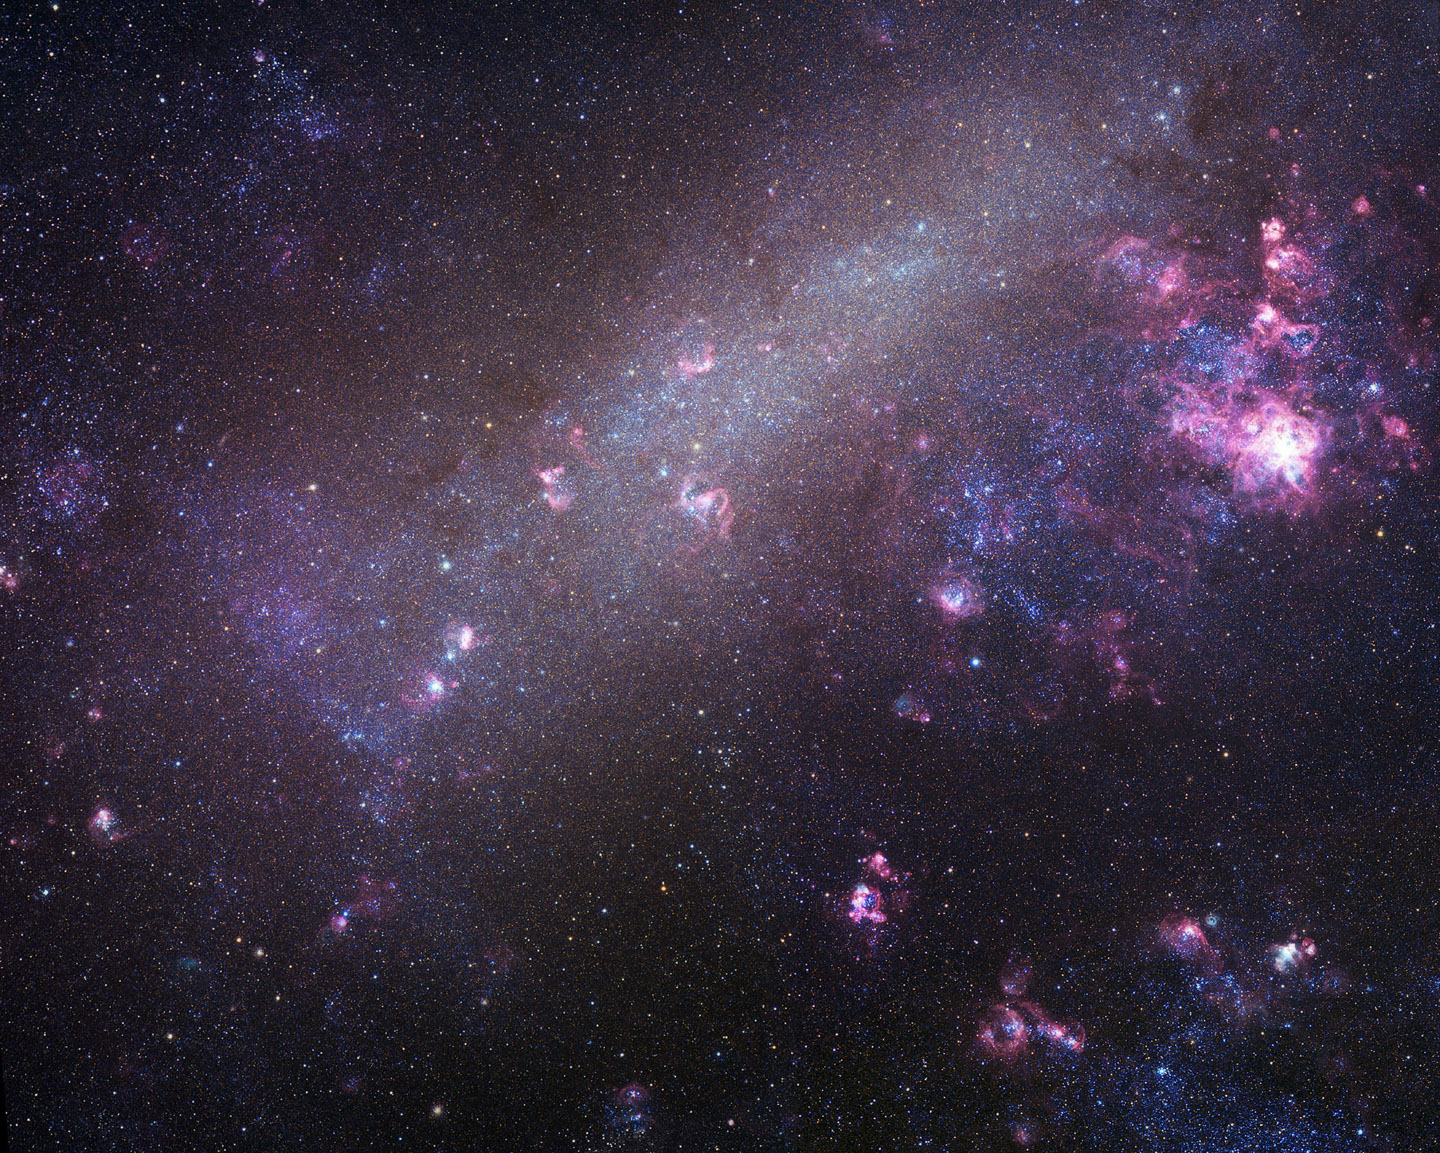
The Magellanic Clouds are an oddity. Their relative velocity is suspiciously close to the escape velocity of the Milky Way system making it somewhat difficult for them to have been formed as part of the system. Additionally, their direction of motion is nearly perpendicular to the disk of the galaxy and systems, especially ones as large as the Magellanic Clouds, should show more orientation to the plane if they formed along side. Their gas content is also notably different than other satellite galaxies of our galaxy. The combination of these features suggests to some, that the Magellanic Clouds aren’t native to the Milky Way and were instead intercepted.

But where did they come from? Although the suggestion is not entirely new, a recent paper, accepted to the Astrophysical Journal Letters, suggests they may have been captured after a past merger in the Andromeda Galaxy (M31).

To analyze this proposition, the researchers, Yang (from the Chinese Academy of Sciences) and Hammers (of the University of Paris, Diderot), conducted simulations backtracking the positions of the Magellanic Clouds. While this may sound straightforward, the process is anything but. Since galaxies are extended objects, their three dimensional shapes and mass profiles must be worked out extremely well to truly account for the path of motion. Additionally, the Andromeda galaxy is certainly moving and would have been in a different position that it is observed today. But exactly where was it when the Magellanic Clouds would have been expelled? This is an important question, but not easy to answer given that observing the proper motions of objects so far away is difficult.

But wait. There’s more! As always, there’s a significant amount of the mass that can’t be seen at all! The presence and distribution of dark matter would greatly have affected the trajectory of the expelled galaxies. Fortunately, our own galaxy seems to be in a fairly quiescent phase and other studies have suggested that dark matter halos would be mostly spherical unless perturbed. Furthermore, distant galaxy clusters such as the Virgo supercluster as well as the “Great Attractor” would have also played into the trajectories.

These uncertainties take what would be a fairly simple problem and turn it into a case in which the researchers were instead forced to explore the parameter space with a range of reasonable inputs to see which values worked. In doing so, the pair of astronomers concluded “it could be the case, within a reasonable range of parameters for both the Milky Way and M31.” If so, the clouds spent 4 – 8 billion years flying across intergalactic space before being caught by our own galaxy.

But could there be further evidence to support this? The authors note that if Andromeda underwent a merger event of such scale would likely have induced vast amounts of star formation. As such, we should expect to see an increase in numbers of stars with this age. The authors do not make any statements as to whether or not this is the case. Regardless, the hypothesis is interesting and reminds us how dynamic our universe can be.

Andromeda’s Unstable Black Hole

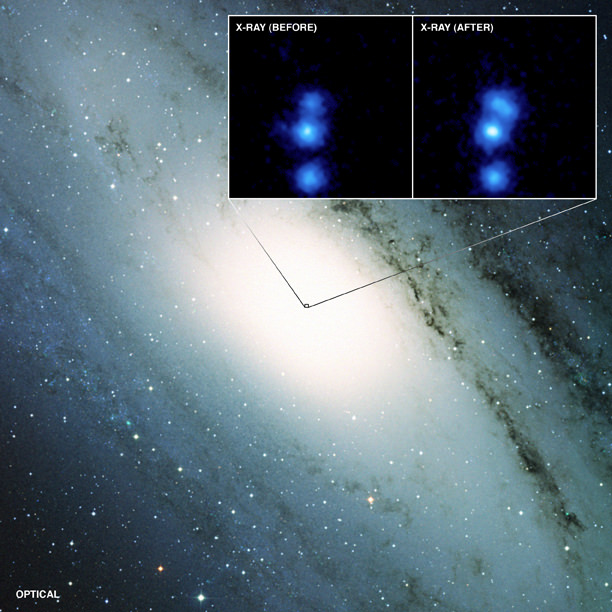
The Andromeda galaxy as seen in optical light, and Chandra's X-ray vision of the changing supermassive black hole in Andromeda's heart. Image Credit: X-Ray NASA/CXC/SAO/Li et al.), Optical (DSS)

[/caption]

The Andromeda galaxy, the closest spiral galaxy to our own Milky Way, has a supermassive blackhole at the center of it much like other galaxies. Because of its proximity to us, Andromeda – or M31 – is an excellent place to study just how the supermassive black holes in the centers of galaxies consume material to grow, and interact gravitationally with the surrounding material.

Over the course of the last ten years, NASA’s Chandra X-Ray observatory has monitored closely the supermassive black hole at Andromeda’s heart. This long-term data set gives astronomers a very nuanced picture of just how these monstrous black holes change over time. Zhiyuan Li of the Harvard-Smithsonian Center for Astrophysics (CfA) presented results of this decade-long observation of the black hole at the 216th American Astronomical Society meeting in Miami, Florida this week.

From 1999 to 2006, M31 was relatively quiet and dim. In January of 2006, though, the black hole in the center of Andromeda suddenly brightened by over 100 times, and has remained 10 times as bright since. This suggests that the black hole swallowed something massive, but the details of the outburst in 2006 remain unclear.

The black hole in M31, located in the Andromeda constellation, likely continues to feed off of the stellar winds of a nearby star or the material in a large gas cloud that is falling into the black hole. As material is consumed, it drives the productions of X-rays in a relativistic jet streaming out from the black hole, which are then picked up by Chandra’s X-ray eyes.

The black hole in M31 is 10 to 100,000 times dimmer than expected, given that it has a large reservoir of gas surrounding it.

“The black holes in both Andromeda and the Milky Way are incredibly feeble. These two ‘anti-quasars’ provide special laboratories for us to study some of the dimmest type of accretion even seen onto a supermassive black hole,” Li said.

Accretion of matter into supermassive black holes is important to study because the evolution of galaxies is influenced by this process, Li said. The gravitational interplay of the black hole with the surrounding material in a galaxy, as well as the energy released when such supermassive black holes consume material in their surrounding accretion disks, change the structure of the galaxy as it forms. A better understanding of just how these supermassive black holes act in the later stages of spiral galaxy life may give clues as to what astronomers can expect to see in other galaxies.

M31 is readily seen with the naked eye in the constellation Andromeda, and is breathtaking to see through a telescope or binoculars. You won’t be able to see the black hole at its center, however! For more information on observing Andromeda, see our Guide to Space article on M31.

Source: Eurekalert

Death in the Sky: M31 Shreds its Satellites

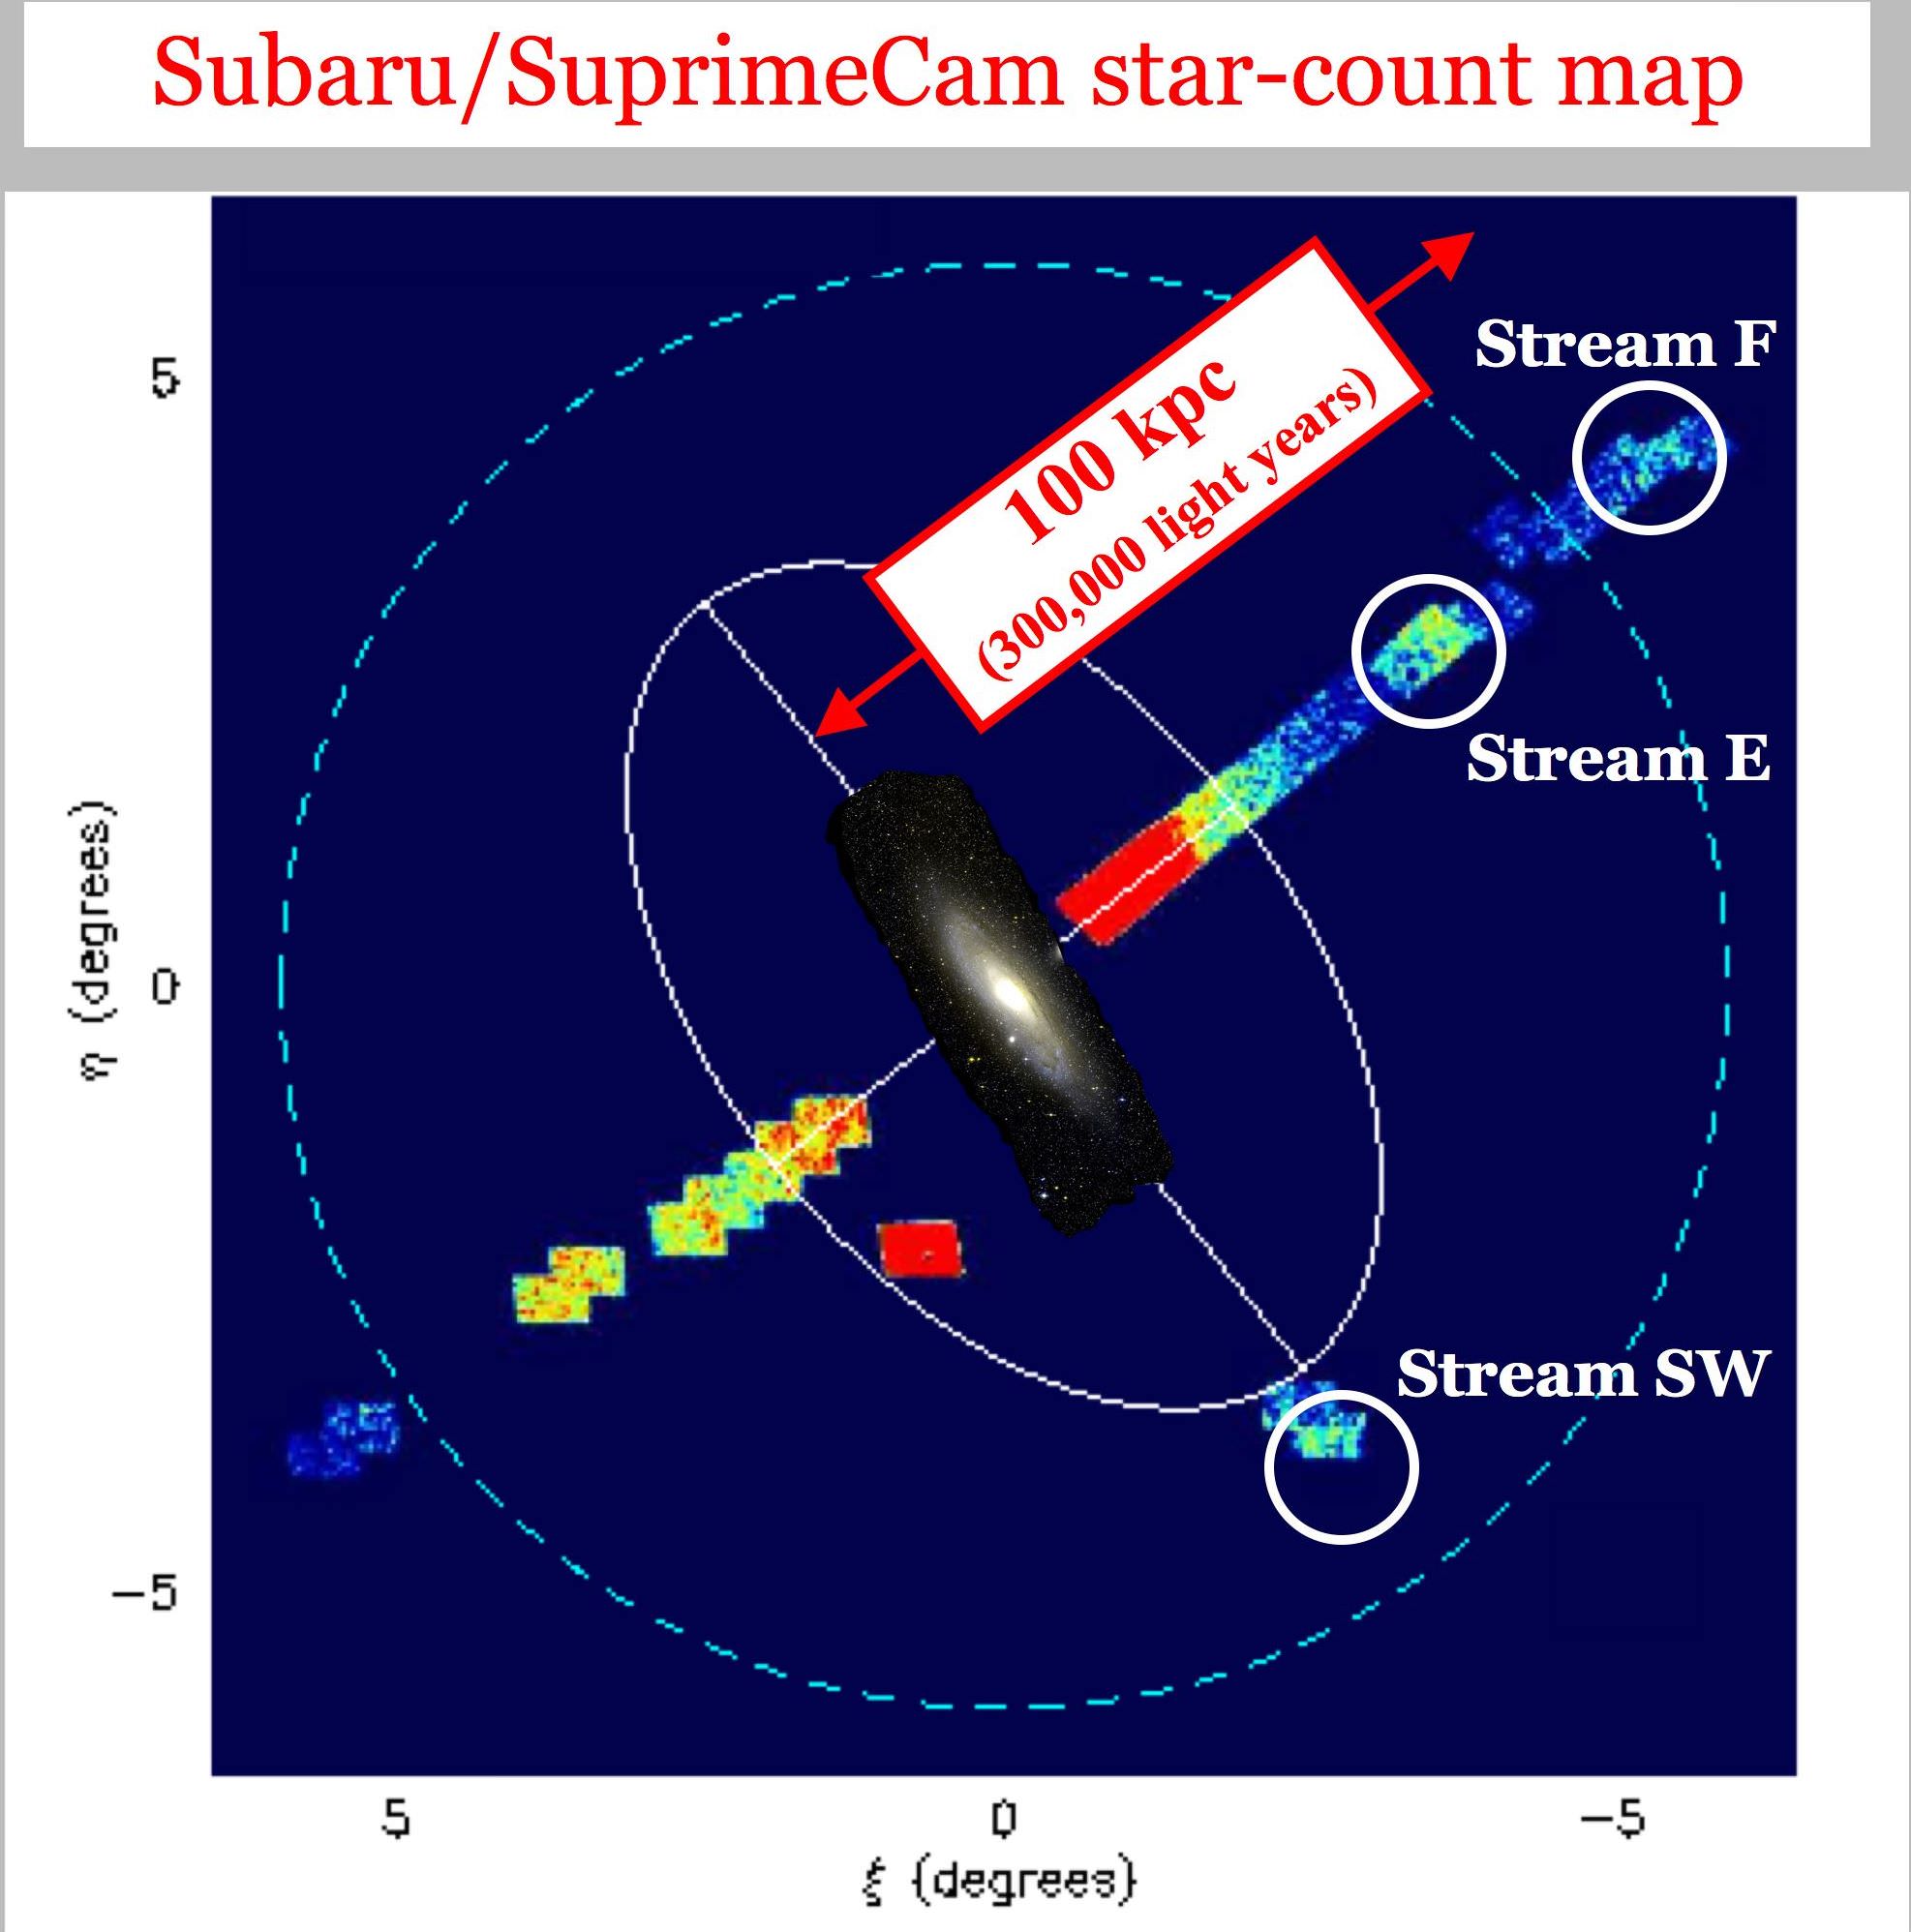
False-color map of the density of red giants in M31 (Star count map credit: Mikito Tanaka, Tohoku University)

[/caption]
An international team of astronomers has identified two new tidal streams in M31, the Andromeda galaxy. They are more-or-less intact remnants of dwarf galaxies that M31 has otherwise ripped to shreds.

One team – using the Suprime-Cam camera on Subaru – discovered two new dwarf galaxy shards by mapping the sky density of red giants in M31’s outskirts; the other – using the DEIMOS spectrograph on Keck II – separated the M31 red giant wheat from the Milky Way chaff.

In a project led by collaborators Mikito Tanaka and Masashi Chiba of Tohoku University, Japan, the astronomers used the Subaru 8-meter telescope and Suprime-Cam camera to map the density of red giants in large portions of M31, including the hitherto uncharted north side. This led to the discovery of two tidal streams to the northwest (streams E and F) at projected distances of 60 and 100 kiloparsecs (200,000 and 300,000 light-years) from M31’s nucleus. The study also confirmed a few previously known streams, including the little-studied diffuse stream to the southwest (stream SW), which lies at a projected distance of 60 to 100 kiloparsecs (200,000 to 300,000 light years) from M31’s nucleus.

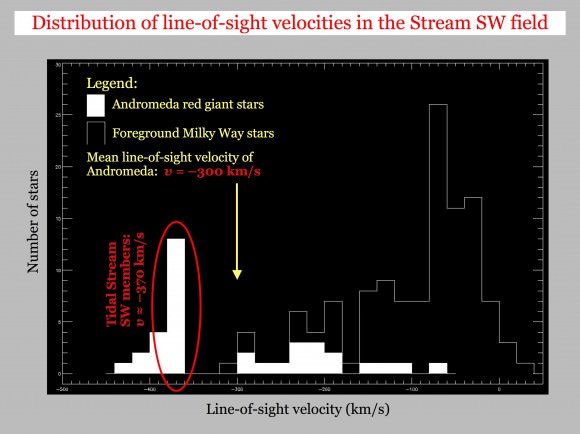
The Spectroscopic and Photometric Landscape of Andromeda’s Stellar Halo (SPLASH) collaboration, a large survey of red giants in M31 lead by Puragra Guhathakurta, professor of astronomy and astrophysics at the University of California, Santa Cruz, has followed up with a spectroscopic survey of several hundred red giants in Streams E, F, and SW, using the Keck II 10-meter telescope and DEIMOS spectrograph at the W. M. Keck Observatory in Hawaii. Analysis of the spectra from this survey yields estimates of the line-of-sight velocity of the stars, which in turn allows M31 red giants to be distinguished from foreground stars (in the Milky Way). The spectral data confirmed the presence of coherent groups of M31 red giants moving with a common velocity.

Distribution of line-of-sight velocities in the Stream SW field (Raja Guhathakurta)

Stars spread over the vast reaches of a halo in a big galaxy like the Milky Way or M31 are characterized by old age, few elements other than helium and hydrogen (i.e. low metallicities; astronomers call all elements other than hydrogen and helium “metals”), and high velocities. The exceptional nature of these halo stars, when compared to stars in a galaxy’s disk, reflects the early dynamics and element formation of the galaxy when its appearance differed significantly from what we see today. Consequently, the halo provides important insights into the processes involved in the formation and evolution of a massive galaxy. In the best Big Bang model we have today – ΛCDM (Lambda Cold Dark Matter) – the outer halos are built up through the merger and dissolution of smaller, dwarf, satellite galaxies. “This process of galactic cannibalism is an integral part of the growth of galaxies,” said Guhathakurta.

The smooth, well-mixed population of halo stars in these large galaxies represents the aggregate of the dwarf galaxy victims of this cannibalism process, while the dwarf galaxies that are still intact as they orbit their large parent galaxy are the survivors of this process.

“The merging and dissolution of a dwarf galaxy typically lasts for a couple billion years, so one occasionally catches a large galaxy in the act of cannibalizing one of its dwarf galaxy satellites,” Guhathakurta said. “The characteristic signature of such an event is a tidal stream: an enhancement in the density of stars, localized in space and moving as a coherent group through the parent galaxy.”

Tidal streams are important because they represent a link between the victims and survivors of galactic cannibalism – an intermediate stage between the population of intact dwarf galaxies and the well-mixed stars dissolved in the halo.

The Andromeda galaxy is a unique test bed for studying the formation and evolution of a large galaxy, said Guhathakurta, “Our external vantage point gives us a global perspective of the galaxy, and yet the galaxy is close enough for us to obtain detailed measurements of individual red giant stars within it.”

One of the next steps will be to measure the detailed elemental compositions (“chemical properties”, in astronomer-speak) of red giants in these newly discovered tidal streams in M31. Comparing the chemical properties of tidal streams, intact dwarf satellites, and the smooth halo will be of particular significance, Guhathakurta said. Mikito Tanaka put it this way: “Further observational surveys of an entire halo region in Andromeda will provide very useful information on galaxy formation, including how many and how massive individual dwarf galaxies as building blocks are and how star formation and chemical evolution proceeded in each dwarf galaxy.”

At the present time, detailed studies of the chemical properties of tidal streams, intact dwarf satellites, and smooth stellar halos are possible only in the Milky Way and M31 galaxies and their immediate surroundings. Existing telescopes and instruments are simply not powerful enough for astronomers to carry out such studies in more distant galaxies. This situation will improve greatly with the advent of the planned Thirty Meter Telescope later in this decade, Guhathakurta said.

Tanaka’s team published their survey results in a recent Astrophysics Journal (ApJ) paper (the preprint is arXiv:0908.0245), and Guhathakurta’s team presented their results on the newly discovered tidal streams earlier this month at the 215th meeting of the American Astronomical Society in Washington, D.C.; they hope to have an ApJ paper on these results published later this year. You can read an earlier SPLASH paper, “The SPLASH Survey: A Spectroscopic Portrait of Andromeda’s Giant Southern Stream”, published in ApJ (the preprint is arxiv:0909.4540).

Sources: University of California, Santa Cruz, National Astronomical Observatory of Japan.