What is the Largest Desert on Earth?

Antarctica
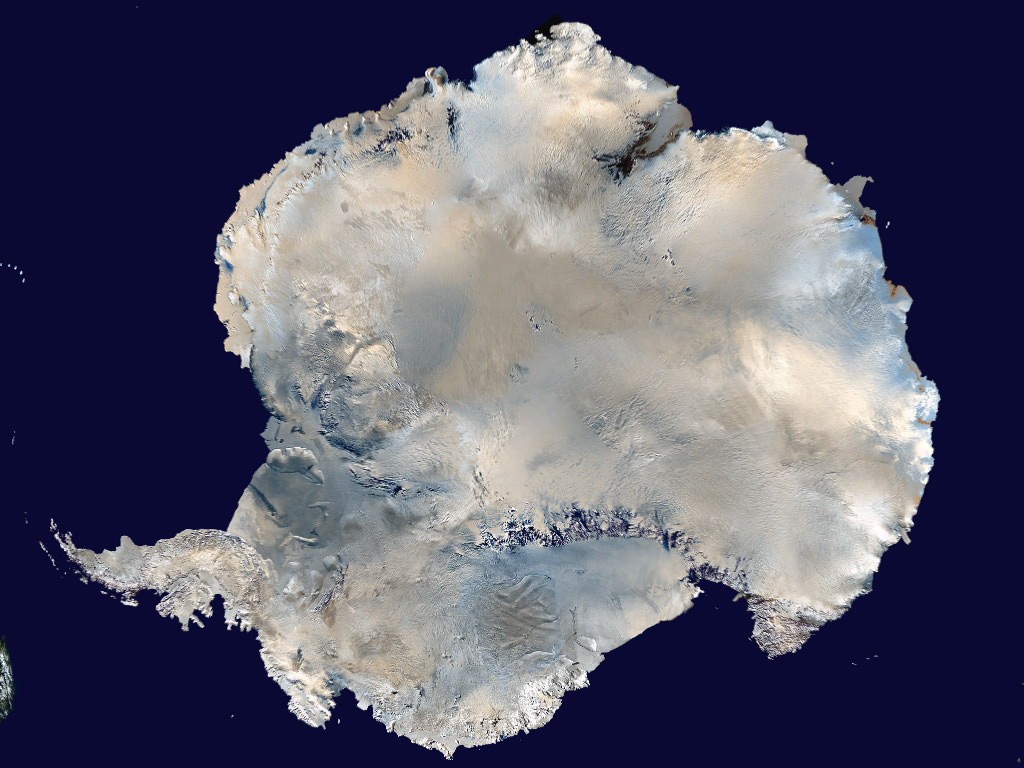
Composite satellite image of Antarctica, the location of the largest desert on Earth. Credit: NASA/Dave Pape

When you hear the word desert, what comes to mind? Chances are, you’d think of sun, sand, and very little in the way of rain. Perhaps cacti, vultures, mesas, and scorpions come to mind as well, or possibly camels and oases? But in truth, deserts come in all shapes and sizes, and vary considerably from one part of the world to the next.

Like all of Earth’s climates, it all comes down to some basic characteristics that they share – which in this case, involves being barren, dry, and hostile to life. For this reason, you might be surprised to learn that the largest desert in the world is actually in Antarctica. How’s that for a curveball?

Definition:

To break it down, a desert is a region that is simply very dry because its receives little to no water. To be considered a desert, an area must receive than 250 millimeters of annual precipitation. But precipitation can take the form of rain, snow, mist or fog – literally any form of water being transferred from the atmosphere to the earth.
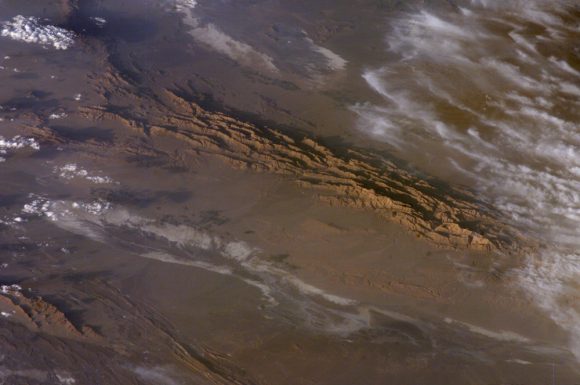
The Lut Desert of Iran, as observed from space by NASA's Earth Observatory. Credit: NASA
The Lut Desert of Iran, as observed by NASA’s Earth Observatory. It was here that the hottest temperature ever was recorded between 2003-9. Credit: NASA

Deserts can also be described as areas where more water is lost by evaporation than falls as precipitation. This certainly applies in regions that are subject to “desertification”, where increasing temperatures (i.e. climate change) result in river beds drying up, precipitation patterns changing, and vegetation dying off.

Deserts are often some of the hottest and most inhospitable places on Earth, as exemplified by the Sahara Desert in Africa, the Gobi desert in northern China and Mongolia, and Death Valley in California. But they can also be cold, windswept landscapes where little to no snow ever falls – like in the Antarctic and Arctic.

So in the end, being hot has little to do with it. In fact, it would be more accurate to say that deserts are characterized by little to no moisture and extremes in temperature. All told, deserts make up one-third of the surface of the Earth. But most of that is found in the polar regions.

Antarctica:

In terms of sheer size, the Antarctic Desert is the largest desert on Earth, measuring a total of 13.8 million square kilometers. Antarctica is the coldest, windiest, and most isolated continent on Earth, and is considered a desert because its annual precipitation can be less than 51 mm in the interior.
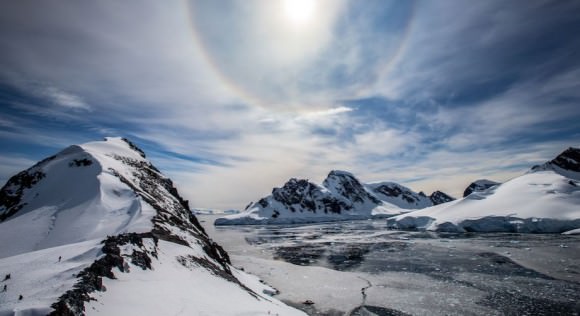
A Sun halo seen among the the landscape and ice flows of Antarctica. Credit and copyright: Alex Cornell.
A Sun halo seen among the the landscape and ice flows of Antarctica. Credit and copyright: Alex Cornell

It’s covered by a permanent ice sheet that contains 90% of the Earth’s fresh water. Only 2% of the continent isn’t covered by ice, and this land is strictly along the coasts, where all the life that is associated with the land mass (i.e. penguins, seals and various species of birds) reside. The other 98% of Antarctica is covered by ice which averages 1.6 km in thickness.

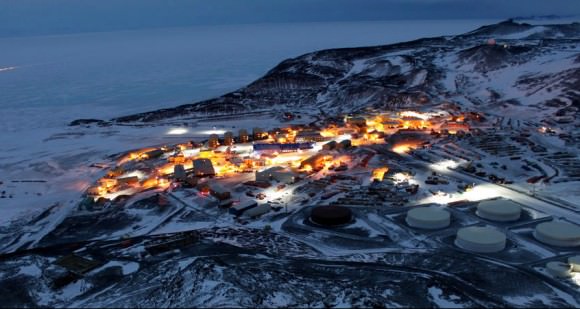
There are no permanent human residents, but anywhere from 1,000 to 5,000 researchers inhabit the research stations scattered across the continent – the largest being McMurdo Station, located on the tip of Ross Island. Beyond a limited range of mammals, only certain cold-adapted species of mites, algaes, and tundra vegetation can survive there.

Despite having very little precipitation, Antarctica still experiences massive windstorms. Much like sandstorms in the desert, the high winds pick up snow and turn into blizzards. These storms can reach speeds of up to 320 km an hour (200 mph) and are one of the reasons the continent is so cold.

In fact, the coldest temperature ever recorded was taken at the Soviet Vostok Station on the Antarctic Plateau. Using ground-based measurements, the temperature reached a historic low of -89.2°C (-129°F) on July 21st, 1983. Analysis of satellite data indicated a probable temperature of around -93.2 °C (-135.8 °F; 180.0 K), also in Antarctica, on August 10th, 2010. However, this reading was not confirmed.

McMurdo station at night. Credit: m.earthtripper.com
Antarctica’s McMurdo Station at night. Credit: m.earthtripper.com

Other Deserts:

Interestingly, the second-largest desert in the world is also notoriously cold – The Arctic Desert. Located above 75 degrees north latitude, the Arctic Desert covers a total area of about 13.7 million square km (5.29 million square mi). Here, the total amount of precipitation is below 250mm (10 inches), which is predominantly in the form of snow.

The average temperature in the Arctic Desert is -20 °C, reaching as low as -50 °C in the winter. But perhaps the most interesting aspect of the Arctic Desert is its sunshine patterns. During the summer months, the sun doesn’t set for a period of 60 days. These are then followed in the winter by a period of prolonged darkness.

The third largest desert in the world is the more familiar Sahara, with a total size of 9.4 million square km. The average annual rainfall ranges from very low (in the northern and southern fringes of the desert) to nearly non-existent over the central and the eastern part. All told, most of the Saraha receives less than 20 mm (0.79 in).

However, in northern fringe of the desert, low pressure systems from the Mediterranean Sea result in an annual rainfall of between 100 to 250 mm (3.93 – 9.84 in). The southern fringe of the desert – which extends from coastal Mauritania to the Sudan and Eritrea – receives the same amount of rainfall from the south. The central core of the desert, which is extremely arid, experiences an annual rainfall of less than 1 mm (0.04 in).

Temperatures are also quite intense in the Sahara, and can rise to more than 50 °C. Interestingly, this is not the hottest desert on the planet though. The hottest temperature ever recorded on Earth was 70.7 °C (159 °F), which was taken in the Lut Desert of Iran. These measurements were part of a global temperature survey conducted by scientists at NASA’s Earth Observatory during the summers of 2003 to 2009.

In short, deserts are not just sand dunes and places where you might come across Bedouins and Berbers, or a place you have to drive through to get to Napa Valley. They are common to every continent of the world, and can take the form of sandy deserts or icy deserts. In the end, the defining characteristic is their pronounced lack of moisture.

In that respect, the polar regions are the largest deserts in the world, with Antarctica narrowly beating out the Arctic for first place. And going by this definition – i.e. cold, arid, and with little to no precipitation – we’re sure to find some particularly big deserts elsewhere in Solar System. After all, what is Mars if not one big, cold, arid, and extremely dry climate?

We have written many articles about the Earth for Universe Today. Here is What Percent of the Earth’s Land Surface is Desert?, What is the Driest Place on Earth?, What is the Hottest Place on Earth?, What is the Earths’ Average Temperature?

Want more resources on the Earth? Here’s a link to NASA’s What is Antarctica?, and here’s NASA’s Visible Earth.

We have also recorded an episode of Astronomy Cast about Earth, as part of our tour through the Solar System – Episode 51: Earth.

Sources:

Arctic Melting Is Lasting Longer And Affecting More Ice: Study

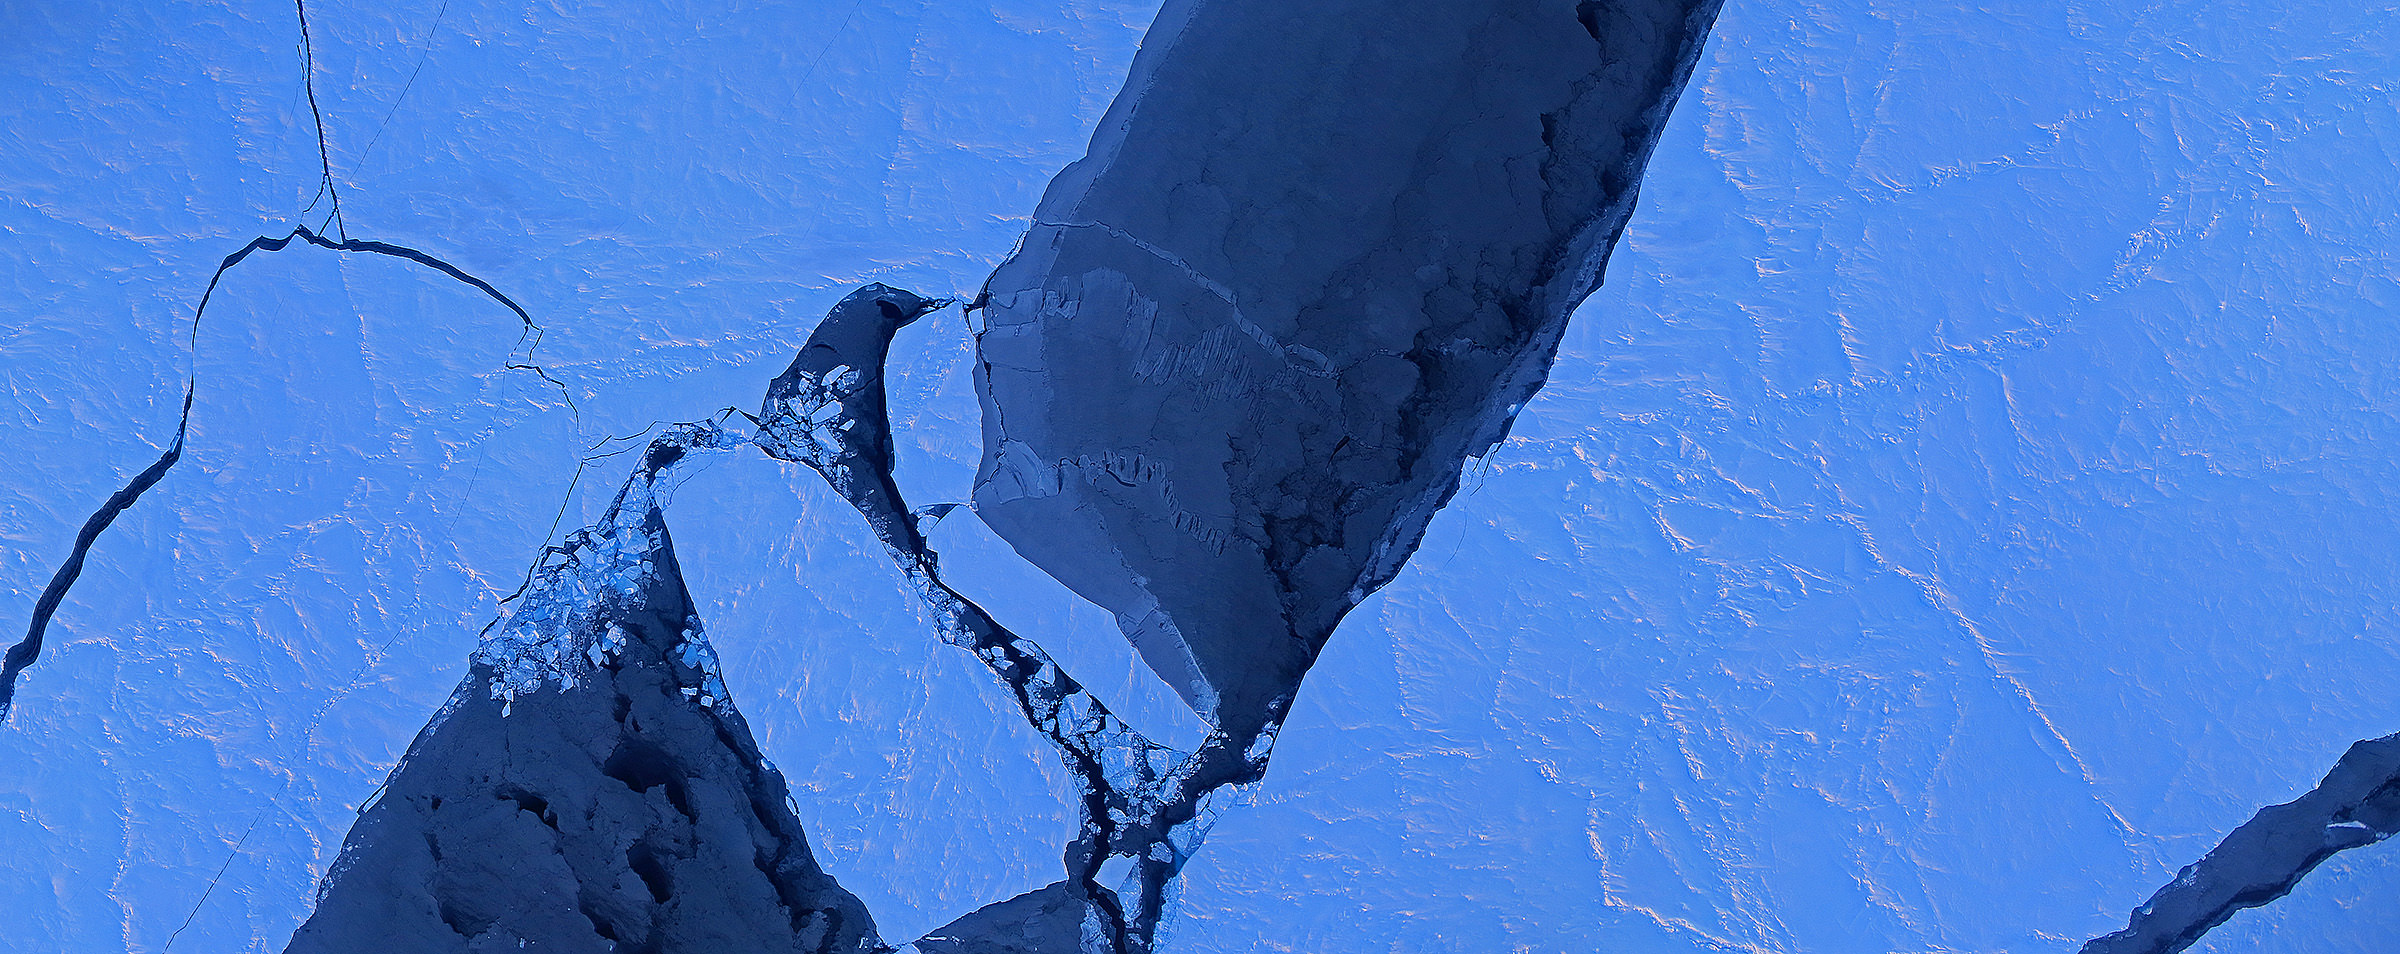
An image mosaic of ice breaking up in the Arctic Ocean's Canada Basin on March 28, 2014. Image taken by Operation IceBridge's Digital Mapping System. Credit: Digital Mapping System/NASA Ames

The Arctic melt season is averaging five days longer with each passing decade, a new study by NASA and the National Snow and Ice Data Center reveals. And with more ice-free days, the water (which is darker than the surrounding ice) is absorbing the sun’s heat and accelerating the process. This means the Arctic ice cap has shrank by as much as four feet.

The sobering news comes following a study of satellite data from 1979 to 2013. By the end of this century, scientists believe, there will be a fully melted Arctic Ocean during the entire summer. And the news also comes in the same week that the Intergovernmental Panel on Climate Change  (IPCC) released its own report on global warming.

“The Arctic is warming and this is causing the melt season to last longer,” stated Julienne Stroeve, a senior scientist at NSIDC, Boulder and lead author of a new study. “The lengthening of the melt season is allowing for more of the sun’s energy to get stored in the ocean and increase ice melt during the summer, overall weakening the sea ice cover.”

The research further revealed that solar radiation absorption depends on when the melt season begins; this is particularly true since the sun rises higher during the spring, summer and fall than in the winter. It’s still hard to predict when things will melt or freeze, however, since this depends on weather.

“There is a trend for later freeze-up, but we can’t tell whether a particular year is going to have an earlier or later freeze-up,” Stroeve said. “There remains a lot of variability from year to year as to the exact timing of when the ice will reform, making it difficult for industry to plan when to stop operations in the Arctic.”

Data was collected with NASA’s (long deceased) Nimbus-7 Scanning Multichannel Microwave Radiometer and instruments aboard Defense Meteorological Satellite Program spacecraft.

“When ice and snow begin to melt, the presence of water causes spikes in the microwave radiation that the snow grains emit, which these sensors can detect,” NASA stated. “Once the melt season is in full force, the microwave emissivity of the ice and snow stabilizes, and it doesn’t change again until the onset of the freezing season causes another set of spikes.”

The research has been accepted for publication in Geophysical Research Letters.

Source: NASA

NASA Scientists Soar Over a Mini Ice Cap

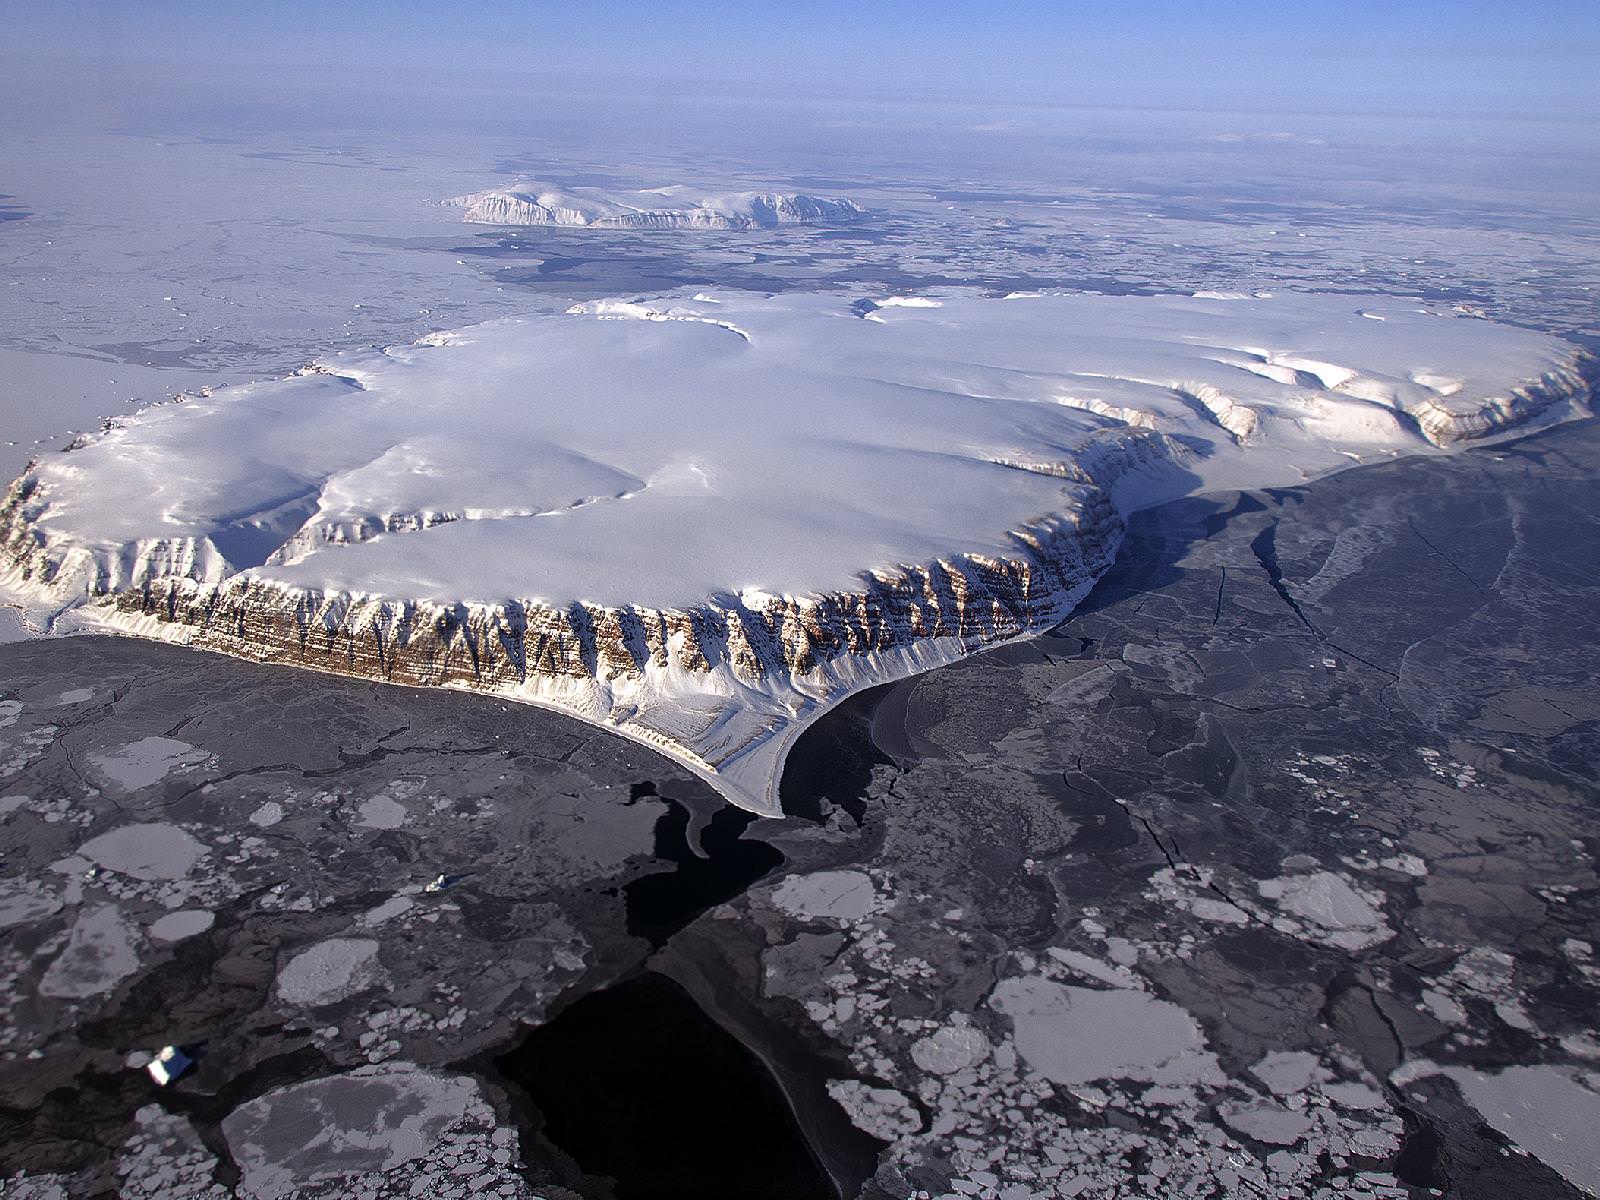
Saunders Island and Wolstenholme Fjord with Kap Atholl in the background photographed during a NASA IceBridge flight. (NASA/Michael Studinger)

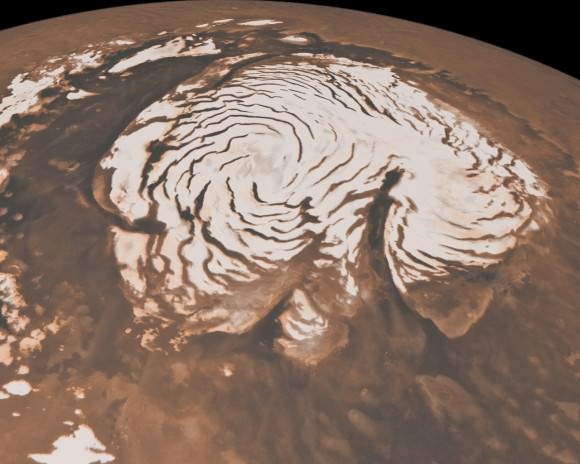
It’s quite a long way from Mars, but I can’t help but be reminded of the Red Planet’s ice-covered north pole when looking at this photo taken by Michael Studinger earlier this month, during a recent IceBridge survey flight over Greenland.

Called Saunders Island (also Appat Island) the 82-square-mile frozen slab of rock rises from the sea off the coast of northwestern Greenland, one of many islands within the Wolstenholme (Uummannaq) Fjord on the shore of Baffin Bay. Operation IceBridge, a six-year aerial survey of the changing ice coverage at our planet’s poles, is run by NASA to provide valuable ground-level information to supplement satellite data.

To me, the shape of the island’s steep rock faces and rugged inlets slice into its interior bear a striking resemblance to Mars’ ice cap.

Mars' north polar ice cap
Mars’ north polar ice cap

While Mars’ ice cap is shaped by very different processes — and obviously much bigger — you might see the connection too!

But rather than dark Martian dunes, sea ice can be seen surrounding the islands in varying thicknesses in the IceBridge photo above. Sea ice coverage in the fjord ranges from thicker, white ice in the background to thinner “grease” ice and leads with dark, open ocean water in the foreground.

The IceBridge P-3B airborne laboratory in a hangar at Wallops Flight Facility (NASA/George Hale)

As the amount of darker, ice-free water surfaces increase over the course of the year due to rising global temperatures, the more heat from solar radiation is collected in the ocean — thus speeding up the process of seasonal sea ice loss and overall Arctic warming.

Read more about the IceBridge mission here, and see a collection of more photos from this season’s flights here.

NASA’s Operation IceBridge images Earth’s polar ice in unprecedented detail to better understand processes that connect the polar regions with the global climate system. IceBridge utilizes a highly specialized fleet of research aircraft and the most sophisticated suite of innovative science instruments ever assembled to characterize annual changes in thickness of sea ice, glaciers, and ice sheets. In addition, IceBridge collects critical data used to predict the response of earth’s polar ice to climate change and resulting sea-level rise.


Stunning Aurora Video: Polar Spirits

Polar Lights by Ole Salomonsen

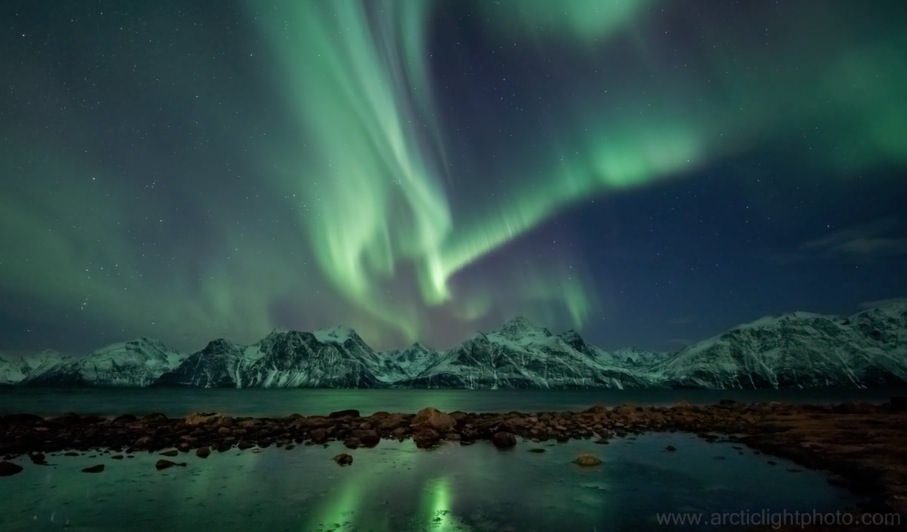
This year, there have been some epic auroral displays, and astrophotographer Ole C. Salomonsen has just released this new video which includes real-time recordings of these “polar spirits.”

“My main focus is on getting the auroras [to] show as close as possible to real-time speed given the time available in a short video,” Salomonsen wrote on Vimeo. “In the film I have tried to show the slower majestic dancing lights, as well as the more faster, dramatic and abstract shows, and finally the auroras in combination with city lights and urban elements.”

Simply stunning, and if you watch closely on the opening sequence you can actually see some whales breaching out in the fjord!

POLAR SPIRITS from Ole C. Salomonsen on Vimeo.

NASA Satellite Sees Ghostly Remains of Vanishing Arctic Sea Ice

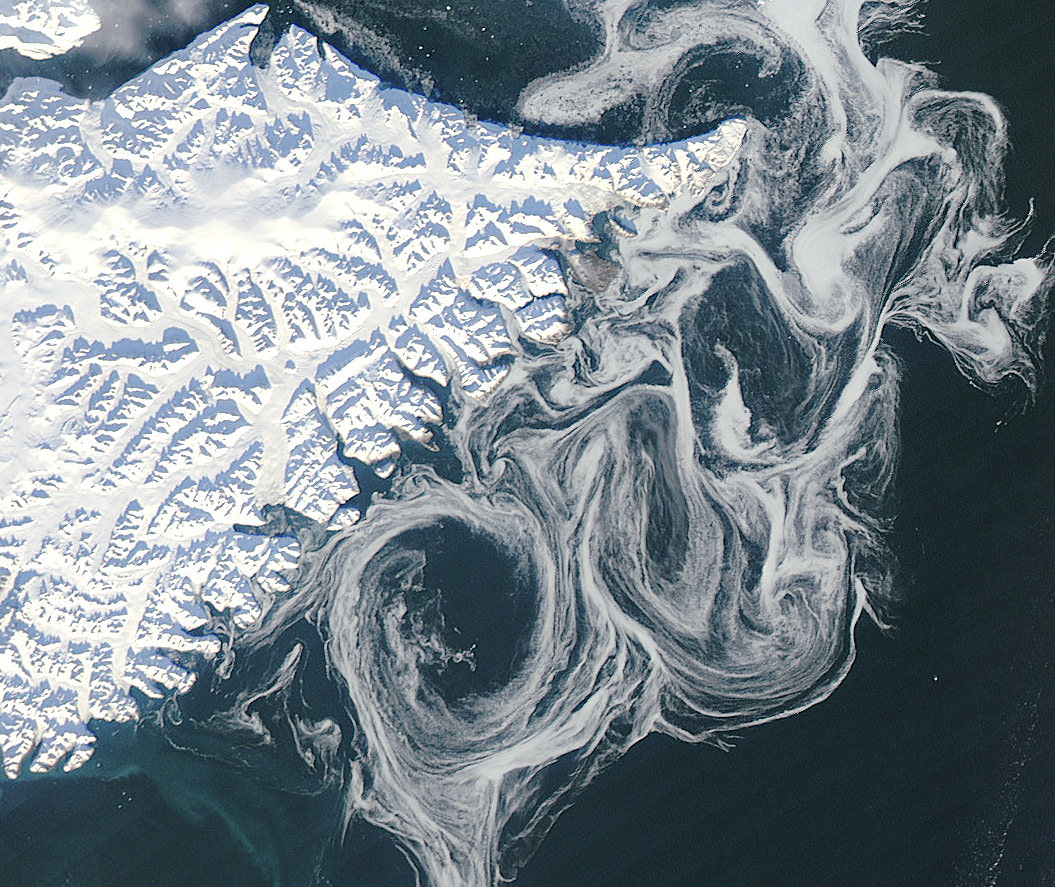
Sea ice swirls in ocean currents off the coast of Greenland (NASA/GSFC)

Spooky spectral swirls of last season’s sea ice drift in currents off the coast of eastern Greenland in this image from NASA’s Aqua satellite, acquired on October 17. Although sea ice in the Arctic will start forming again after September’s record low measurements, these ghostly wisps are likely made up of already-existing ice that has migrated south.

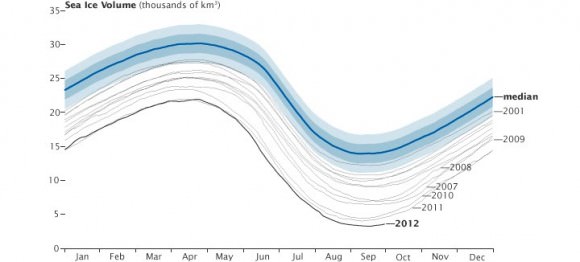
As global temperatures rise — both over land and in the ocean — thinner sea ice builds up during the Arctic winter and thus more of it melts during the summer, a pattern that will eventually lead to an ice-free Arctic if trends continue. The past several years saw sea ice in the Arctic below the 1979-2000 average, with this past September displaying the lowest volumes yet recorded.

The graph below, made from data modeled by the Polar Science Center at the University of Washington, show the chilling — or, perhaps, not-so-chilling — results of this century’s recent observations.

Along Greenland’s east coast, the Fram Strait serves as an expressway for sea ice moving out of the Arctic Ocean. The movement of ice through the strait used to be offset by the growth of ice in the Beaufort Gyre.

Until the late 1990s, ice would persist in the gyre for years, growing thicker and more resistant to melt. Since the start of the twenty-first century, however, ice has been less likely to survive its trip through the southern part of the Beaufort Gyre. As a result, less Arctic sea ice has been able to pile up and form multi-year ice.

Thin, free-drifting ice — as seen above — moves very easily with winds and currents.

Aqua is a NASA Earth Science satellite mission named for the large amount of information that the mission is collecting about the Earth’s water cycle, including evaporation from the oceans, water vapor in the atmosphere, clouds, precipitation, soil moisture, sea ice, land ice, and snow cover on the land and ice. Aqua was launched on May 4, 2002, and carries six Earth-observing instruments in a near-polar low-Earth orbit. MODIS, which acquired the image above, is a 36-band spectroradiometer that measures physical properties of the atmosphere, oceans and land.

Source: NASA Earth Observatory

NASA image courtesy Jeff Schmaltz, LANCE MODIS Rapid Response Team at NASA GSFC. Graph by Jesse Allen based on modeled ice volume data from the Polar Science Center, University of Washington. Caption portions by Michon Scott with information from Ted Scambos, National Snow and Ice Data Center.

Manhattan-Sized Ice Island Heads Out to Sea

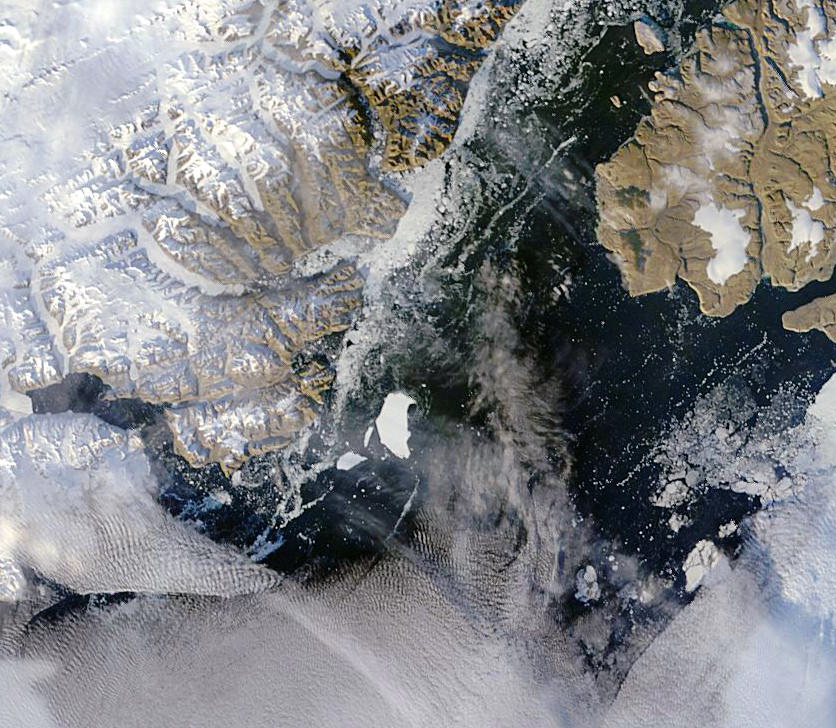
An “ice island” that calved from the Petermann Glacier in July is seen by NASA satellite (MODIS/Terra)

Remember that enormous slab of ice that broke off Greenland’s Petermann Glacier back in July? It’s now on its way out to sea, a little bit smaller than it was a couple of months ago — but not much. At around 10 miles long and 4.6 miles across (16.25 x 7.5 km) this ice island is actually a bit shorter than Manhattan, but is fully twice as wide.

The image above was acquired on September 14 by the Moderate Resolution Imaging Spectroradiometer (MODIS) aboard NASA’s Terra satellite.

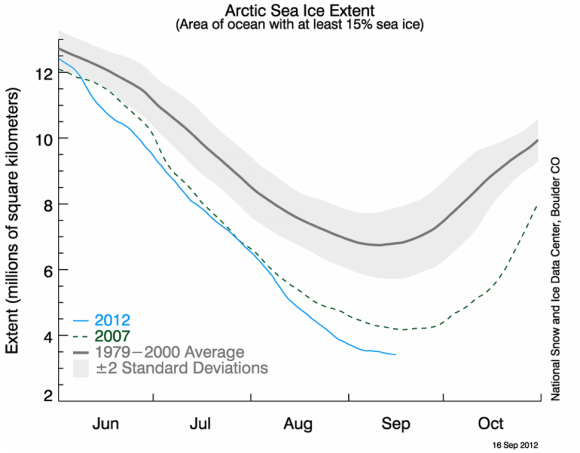
Although the calving of this particular ice island isn’t thought to be a direct result of increasing global temperatures, climate change is thought to be a major factor in this year’s drop in Arctic sea ice extent, which is now below 4.00 million square kilometers (1.54 million square miles). Compared to September conditions in the 1980s and 1990s, this represents a 45% reduction in the area of the Arctic covered by sea ice.

Arctic sea ice extent data for June-July 2012 (NSIDC)

This year sea ice in the Arctic Ocean dropped below the previous all-time record, set in 2007. 2012 also marks the first time that there has been less than 4 million square kilometers (1.54 million square miles) of sea ice since satellite observations began in 1979.

The animation below, released today by the NOAA, shows the 2012 time-series of ice extent using data from the DMSP SSMI/S satellite sensor:

Read more here.

Blue Marble 2012: The Arctic Edition

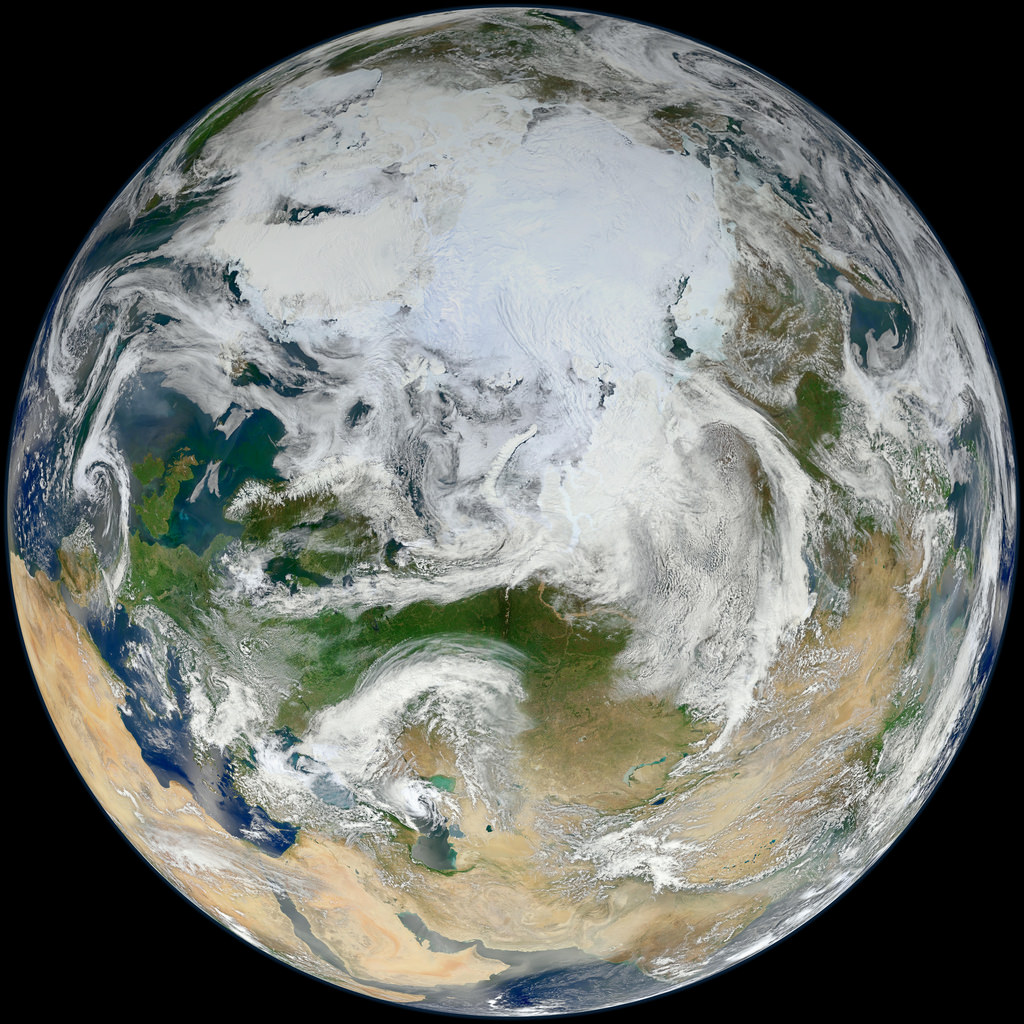
This latest portrait of Earth from NASA’s Suomi NPP satellite puts the icy Arctic in the center, showing the ice and clouds that cover our planet’s northern pole. The image you see here was created from data acquired during fifteen orbits of Earth.

In January of this year Suomi NPP images of Earth were used to create an amazing “Blue Marble” image that spread like wildfire across the internet, becoming one of the latest “definitive” images of our planet. Subsequent images have been released by the team at Goddard Space Flight Center, each revealing a different perspective of Earth.

See a full-sized version of the image above here.

NASA launched the National Polar-orbiting Operational Environmental Satellite System Preparatory Project (or NPP) on October 28, 2011 from Vandenberg Air Force Base. On Jan. 24, NPP was renamed Suomi National Polar-orbiting Partnership, or Suomi NPP, in honor of the late Verner E. Suomi. It’s the first satellite designed to collect data to improve short-term weather forecasts and increase understanding of long-term climate change.

Suomi NPP orbits the Earth about 14 times each day and observes nearly the entire surface of the planet.

Image credit: NASA/GSFC/Suomi NPP


Grab a seat for the Celestial Lights show!

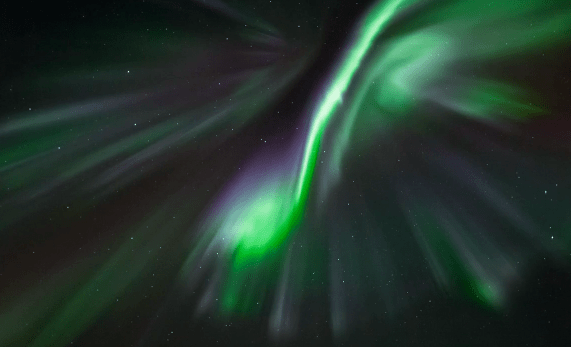
Ole's cameras capture shimmering sheets of aurora over the Arctic. (© Ole C. Salomonsen)


Painstakingly assembled from over 150,000 digital photos taken over the course of eight months, this stunning time-lapse video of aurora-filled Arctic skies is the latest creation by photo/video artist Ole C. Salomonsen. Take a moment, turn up the sound, sit back and enjoy the show!

This is Ole’s second video project. The footage was shot on location in parts of Norway, Finland and Sweden from September 2011 to April 2012, and shows the glorious effects that the Sun’s increasing activity has had on our planet’s upper atmosphere.

Ole writes on his Vimeo page:

The video is a merge of two parts; the first part contains some more wild and aggressive auroras, as well as a few Milky Way sequences, hence either auroras are moving fast because they are or they are fast due to motion of the Milky Way / stars. Still, some of the straight-up shots are very close to real-time speed — although auroras mostly are slower, she can also be FAST!

The second part has some more slow and majestic auroras, where I have focused more on composition and foreground. The music should give you a clear indication of where you are.

[/caption]

The music was provided by Norwegian composer Kai-Anders Ryan.

Ole’s “hectic” aurora season is coming to a close now that the Sun is rising above the horizon in the Arctic Circle, and he figured that it was a good time to release the video. It will also be available on 4K Digital Cinema on request.

“Hope you like the video, and that you by watching it are able to understand my fascination and awe for this beautiful celestial phenomenon,” says Ole.

You can follow Ole’s work on Facebook at facebook.com/arcticlightphoto, and check out his website here.

Video © Ole C. Salomonsen. Music by Kai-Anders Ryan.

Arctic Ozone Levels Reach All-Time Low

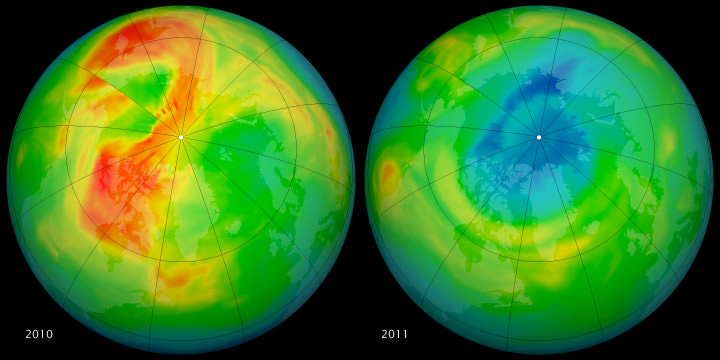
This set of images by the Ozone Monitoring Instrument (OMI) on NASA’s Aura satellite shows March 19, 2010 on the left, and the right shows the same date in 2011. March 2010 had relatively high ozone, while March 2011 has low levels. NASA image by Rob Simmon, with data courtesy of Ozone Hole Watch.

In the past, massive ozone loss over Antarctica has grabbed the headlines. But this year, measurements by several different sources show record levels of stratospheric ozone loss over the Arctic. Scientists say the main reason for the record ozone loss this year is that unusually cold stratospheric temperatures, which have endured later into the season than usual. Scientists say the unusual loss is not catastrophic, but something that needs to be monitored.

The World Meteorological Organization cautioned that people who live in northerly latitudes could get sunburned easier, noting that ozone-depleted air masses extended from the north pole to southern Scandinavia.

The record low temperatures were caused by unusually strong winds, known as the polar vortex, which isolated the atmospheric mass over the North Pole and prevented it from mixing with air in the mid-latitudes.

This has allowed for the formation of polar stratospheric clouds, and the catalytic chemical destruction of ozone molecules occurs on the surface of these clouds which form at 18-25 kilometers height when temperatures drop below -78 C.

[/caption]

This created conditions similar to those that occur every southern hemisphere winter over the Antarctic.
Measurements by ESA’s Envisat satellite, the Ozone Monitoring Instrument (OMI) on NASA’s Aura satellite, and France’s MetOp satellite, as well as observations made since January from the ground and from balloons show all show that 40% of ozone molecules have been destroyed over the Arctic.

Ozone is a protective atmospheric layer found at around 25 km altitude that acts as a sunlight filter shielding life on Earth from harmful ultraviolet rays, which can increase the risk of skin cancer and cataracts in humans and harm marine life.

Stratospheric temperatures in the Arctic usually do vary widely from winter to winter. Last year, temperatures and ozone above the Arctic were very high. The last unusually low stratospheric temperatures over the North Pole were recorded in 1997.

See this link from ESA that shows a animation comparison between 2010 and 2011.

“This depletion is not necessarily a big surprise,” said Paul Newman, an atmospheric scientist and ozone expert at NASA’s Goddard Space Flight Center. “The ozone layer remains vulnerable to large depletions because total stratospheric chlorine levels are still high, in spite of the regulation of ozone-depleting substances by the Montreal Protocol. Chlorine levels are declining slowly because ozone-depleting substances have extremely long lifetimes.”

Ozone “holes” do not form consistently over the North Pole like they do in Antarctica. “Last winter, we had very high lower stratospheric temperatures and ozone levels were very high; this year is just the opposite,” Newman said. “The real question is: Why is this year so dynamically quiet and cold in the stratosphere? That’s a big question with no good answer.”

Scientists will be watching in coming months for possible increases in the intensity of ultraviolet radiation (UV) in the Arctic and mid-latitudes, since ozone is Earth’s natural sunscreen. “We need to wait and see if this will actually happen,” Newman said. “It’s something to look at but it is not catastrophic.”

Scientists are also investigating why the 2011 and 1997 Arctic winters were so cold and whether these random events are statistically linked to global climate change. “In a changing climate, it is expected that on average stratospheric temperatures cool, which means more chemical ozone depletion will occur,” said Mark Weber from the University of Bremen.

Experts say that on a global scale, the ozone layer is still on a long-term course for recovery. But for decades to come, there remains a risk of major ozone losses on yearly or regional scales.

Sources: Nature, ESA, NASA, The Independant Science Daily Earth/Sky Blog

Scientists Predict Arctic Could Be Ice-Free Within Decades

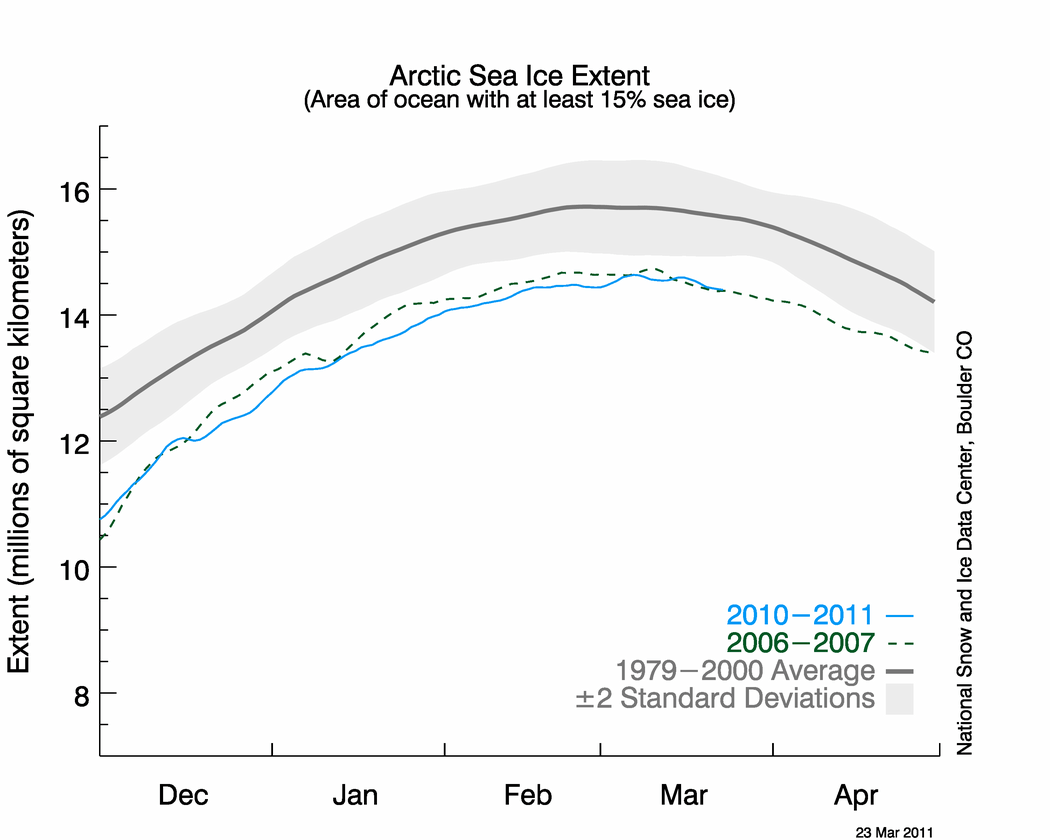
Sea ice data through mid- March 2011. Credit: National Snow and Ice Data Center

[/caption]

Bad news for what is now the beginning of the “melt season” in the Arctic. Right now, the sea ice extent maximum appears to be tied for the lowest ever measured by satellites as the spring begins, according to scientists at the University of Colorado Boulder’s National Snow and Ice Data Center. And because of the trend of how the amount of Arctic sea ice has been spiraling downward in the last decade, some scientists are predicting the Arctic Ocean may be ice free in the summers within the next several decades.

“I’m not surprised by the new data because we’ve seen a downward trend in winter sea ice extent for some time now,” said Walt Meier, a research scienitist with the NSIDC.

The seven lowest maximum Arctic sea ice extents measured by satellites all have occurred in the last seven years, and the from the latest data, the NSIDC research team believes the lowest annual maximum ice extent of 5,650,000 square miles occurred on March 7 of this year.

The maximum ice extent was 463,000 square miles below the 1979-2000 average, an area slightly larger than the states of Texas and California combined. The 2011 measurements were tied with those from 2006 as the lowest maximum sea ice extents measured since satellite record keeping began in 1979.

Virtually all climate scientists believe shrinking Arctic sea ice is tied to warming temperatures in the region caused by an increase in human-produced greenhouse gases being pumped into Earth’s atmosphere.

Meier said the Arctic sea ice functions like an air conditioner for the global climate system by naturally cooling air and water masses, playing a key role in ocean circulation and reflecting solar radiation back into space. In the Arctic summer months, sunlight is absorbed by the growing amounts of open water, raising surface temperatures and causing more ice to melt.

“I think one of the reasons the Arctic sea ice maximum extent is declining is that the autumn ice growth is delayed by warmer temperatures and the ice extent is not able to ‘catch up’ through the winter,” said Meier. “In addition, the clock runs out on the annual ice growth season as temperatures start to rise along with the sun during the spring months.”

Since satellite record keeping began in 1979, the maximum Arctic sea ice extent has occurred as early as Feb. 18 and as late as March 31, with an average date of March 6. Since the researchers determine the maximum sea ice extent using a five-day running average, there is small chance the data could change.

As of March 22, ice extent declined for five straight days. But February and March tend to be quite variable, so there is still a chance that the ice extent could expand again. Ice near the edge is thin and is highly sensitive to weather, scientists say, moving or melting quickly in response to changing winds and temperatures, and it often oscillates near the maximum extent for several days or weeks, as it has done this year.

In early April the NSIDC will issue a formal announcement on the 2011 maximum sea ice extent with a full analysis of the winter ice growth season, including graphics comparing 2011 to the long-term record.

Source: NSIDC, University of Colorado-Boulder