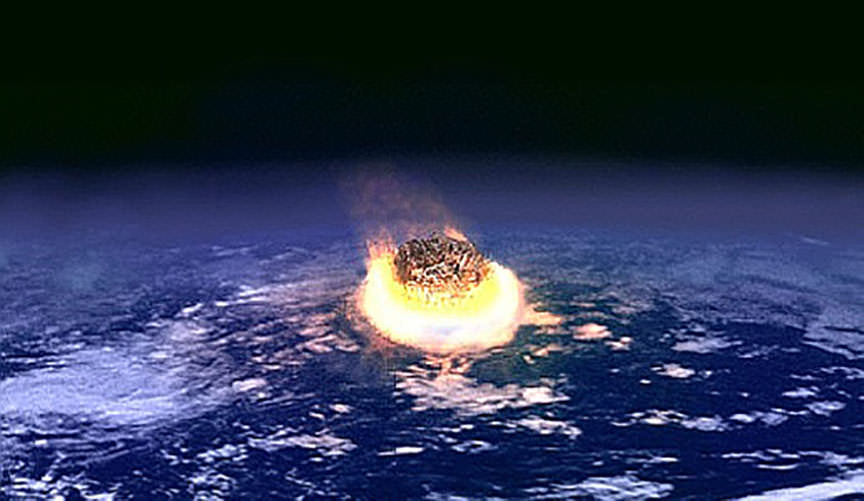
Everyone knows it was a large asteroid striking Earth that led to the demise of the dinosaurs. But how many near misses were there? Modern humans have been around for about 225,000 years, so we must have come close to death by asteroid more than once in our time. We would have had no clue.
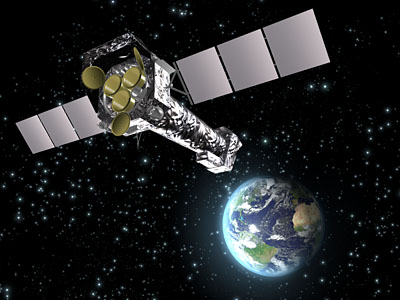
Of course, it’s the actual strikes that are cause for concern, not near misses. Efforts to predict asteroid strikes, and to catalogue asteroids that come close to Earth, have reached new levels. NASA’s newest tool in the fight against asteroids is called Scout. Scout is designed to detect asteroids approaching Earth, and it just passed an important test. Scout was able to give us 5 days notice of an approaching asteroid.
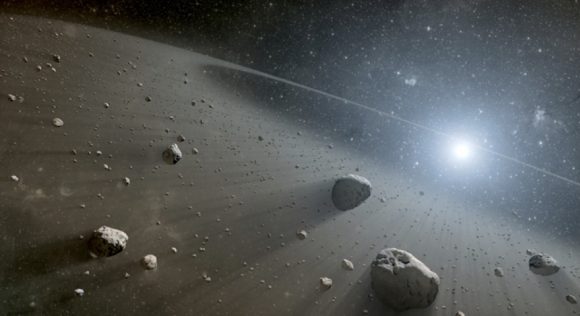
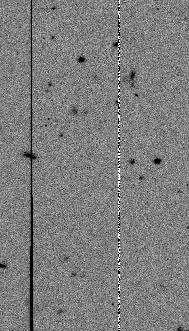
Here’s how Scout works. A telescope in Hawaii, the Panoramic Survey Telescope & Rapid Response System (Pan-STARRS) detected the asteroid, called 2016 UR36, and then alerted other ‘scopes. Three other telescopes confirmed 2016 UR36 and were able to narrow down its trajectory. They also learned its size, about 5 to 25 meters across.

After several hours, we knew that UR 36 would come close to us, but was not a threat to impact Earth. UR 36 would pass Earth at a distance of about 498,000 km. That’s about 1.3 times further away than the Moon.
The key part of this is that we had 5 days notice. And five days notice is a lot more than the few hours that we usually have. The approach of 2016 UR36 was the first test for the Scout system, and it passed the test.
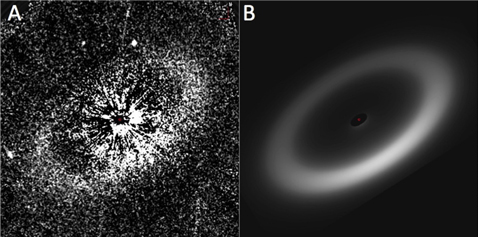
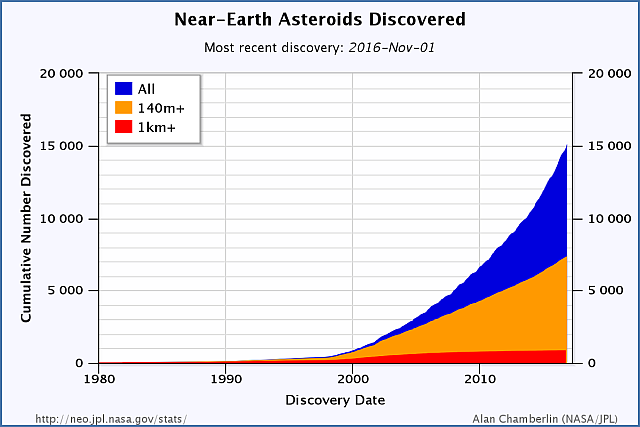
Asteroids that come close to Earth are called Near Earth Objects (NEOs) and finding them and tracking them has become a growing concern for NASA. In fact NASA has about 15,000 NEOs catalogued, and they’re still finding about 5 more every night.
Not only does NASA have the Scout system, whose primary role is to speed up the confirmation process for approaching asteroids, but they also have the Sentry program. Sentry’s role is a little different.
Sentry’s job is to focus on asteroids that are large enough to wipe out a city and cause widespread destruction. That means NEOs that are larger than about 140 metres. Sentry has over 600 large NEOs catalogued, and astronomers think there are a lot more of them out there.
NASA also has the Planetary Defense Coordination Office (PDCO), which has got to be the greatest name for an office ever. (Can you imagine having that on your business card?) Anyway, the PDCO has the over-arching role of preparing for asteroid impacts. The Office is there to make emergency plans to deal with the impact aftermath.
5 days notice for a small asteroid striking Earth is a huge step for preparedness. Resources can be mobilized, critical infrastructure can be protected, maybe things like atomic power plants can be shut down if necessary. And, of course, people can be evacuated.
We haven’t always had any notice for approaching asteroids. Look at the Chelyabinsk meteor from 2013. It was a 10,000 ton meteor that exploded over the Chelyabinsk Oblast, injuring 1500 people and damaging an estimated 3,000 building in 6 cities. If it had been a little bigger, and reached the surface of the Earth, the damage would have been widespread. 5 days notice would likely have saved a lot of lives.
Smaller asteroids may be too small to detect when they’re very far away. But larger ones can be detected when they’re still 10, 20, even 30 years away. That’s enough time to figure out how to stop them. And if you can reach them when they’re that far away, you only need to nudge them a little to deflect them away from Earth, and maybe to the Sun to be destroyed.
Large asteroids with the potential to cause widespread destruction are the attention-getters. Hollywood loves them. But it may be more likely that we face numerous impacts from smaller asteroids, and that they could cause more damage overall. Scout’s ability to detect these smaller asteroids, and give us several days notice of their approach, could be a life-saver.