Astronomy: The Next Generation

Future Tense
Future Tense

In some respects, the field of astronomy has been a rapidly changing one. New advances in technology have allowed for exploration of new spectral regimes, new methods of image acquisition, new methods of simulation, and more. But in other respects, we’re still doing the same thing we were 100 years ago. We take images, look to see how they’ve changed. We break light into its different colors, looking for emission and absorption. The fact that we can do it faster and to further distances has revolutionized our understanding, but not the basal methodology.

But recently, the field has begun to change. The days of the lone astronomer at the eyepiece are already gone. Data is being taken faster than it can be processed, stored in easily accessible ways, and massive international teams of astronomers work together. At the recent International Astronomers Meeting in Rio de Janeiro, astronomer Ray Norris of Australia’s Commonwealth Scientific and Industrial Research Organization (CSIRO) discussed these changes, how far they can go, what we might learn, and what we might lose.

Observatories
One of the ways astronomers have long changed the field is by collecting more light, allowing them to peer deeper into space. This has required telescopes with greater light gathering power and subsequently, larger diameters. These larger telescopes also offer the benefit of improved resolution so the benefits are clear. As such, telescopes in the planning stages have names indicative of immense sizes. The ESO’s “Over Whelmingly Large Telescope” (OWL), the “Extremely Large Array” (ELA), and “Square Kilometer Array” (SKA) are all massive telescopes costing billions of dollars and involving resources from numerous nations.

But as sizes soar, so too does the cost. Already, observatories are straining budgets, especially in the wake of a global recession. Norris states, “To build even bigger telescopes in twenty years time will cost a significant fraction of a nation’s wealth, and it is unlikely that any nation, or group of nations, will set a sufficiently high priority on astronomy to fund such an instrument. So astronomy may be reaching the maximum size of telescope that can reasonably be built.”

Thus, instead of the fixation on light gathering power and resolution, Norris suggests that astronomers will need to explore new areas of potential discovery. Historically, major discoveries have been made in this manner. The discovery of Gamma-Ray Bursts occurred when our observational regime was expanded into the high energy range. However, the spectral range is pretty well covered currently, but other domains still have a large potential for exploration. For instance, as CCDs were developed, the exposure time for images were shortened and new classes of variable stars were discovered. Even shorter duration exposures have created the field of asteroseismology. With advances in detector technology, this lower boundary could be pushed even further. On the other end, the stockpiling of images over long times can allow astronomers to explore the history of single objects in greater detail than ever before.

Data Access
In recent years, many of these changes have been pushed forward by large survey programs like the 2 Micron All Sky Survey (2MASS) and the All Sky Automated Survey (ASAS) (just to name two of the numerous large scale surveys). With these large stores of pre-collected data, astronomers are able to access astronomical data in a new way. Instead of proposing telescope time and then hoping their project is approved, astronomers are having increased and unfettered access to data. Norris proposes that, should this trend continue, the next generation of astronomers may do vast amounts of work without even directly visiting an observatory or planning an observing run. Instead, data will be culled from sources like the Virtual Observatory.

Of course, there will still be a need for deeper and more specialized data. In this respect, physical observatories will still see use. Already, much of the data taken from even targeted observing runs is making it into the astronomical public domain. While the teams that design projects still get first pass on data, many observatories release the data for free use after an allotted time. In many cases, this has led to another team picking up the data and discovering something the original team had missed. As Norris puts it, “much astronomical discovery occurs after the data are released to other groups, who are able to add value to the data by combining it with data, models, or ideas which may not have been accessible to the instrument designers.”

As such, Nelson recommends encouraging astronomers to contribute data to this way. Often a research career is built on numbers of publications. However, this runs the risk of punishing those that spend large amounts of time on a single project which only produces a small amount of publication. Instead, Nelson suggests a system by which astronomers would also earn recognition by the amount of data they’ve helped release into the community as this also increases the collective knowledge.

Data Processing
Since there is a clear trend towards automated data taking, it is quite natural that much of the initial data processing can be as well. Before images are suitable for astronomical research, the images must be cleaned for noise and calibrated. Many techniques require further processing that is often tedious. I myself have experienced this as much of a ten week summer internship I attended, involved the repetitive task of fitting profiles to the point-spread function of stars for dozens of images, and then manually rejecting stars that were flawed in some way (such as being too near the edge of the frame and partially chopped off).

While this is often a valuable experience that teaches budding astronomers the reasoning behind processes, it can certainly be expedited by automated routines. Indeed, many techniques astronomers use for these tasks are ones they learned early in their careers and may well be out of date. As such, automated processing routines could be programmed to employ the current best practices to allow for the best possible data.

But this method is not without its own perils. In such an instance, new discoveries may be passed up. Significantly unusual results may be interpreted by an algorithm as a flaw in the instrumentation or a gamma ray strike and rejected instead of identified as a novel event that warrants further consideration. Additionally, image processing techniques can still contain artifacts from the techniques themselves. Should astronomers not be at least somewhat familiar with the techniques and their pitfalls, they may interpret artificial results as a discovery.

Data Mining
With the vast increase in data being generated, astronomers will need new tools to explore it. Already, there has been efforts to tag data with appropriate identifiers with programs like Galaxy Zoo. Once such data is processed and sorted, astronomers will quickly be able to compare objects of interest at their computers whereas previously observing runs would be planned. As Norris explains, “The expertise that now goes into planning an observation will instead be devoted to planning a foray into the databases.” During my undergraduate coursework (ending 2008, so still recent), astronomy majors were only required to take a single course in computer programming. If Norris’ predictions are correct, the courses students like me took in observational techniques (which still contained some work involving film photography), will likely be replaced with more programming as well as database administration.

Once organized, astronomers will be able to quickly compare populations of objects on scales never before seen. Additionally, by easily accessing observations from multiple wavelength regimes they will be able to get a more comprehensive understanding of objects. Currently, astronomers tend to concentrate in one or two ranges of spectra. But with access to so much more data, this will force astronomers to diversify further or work collaboratively.

Conclusions
With all the potential for advancement, Norris concludes that we may be entering a new Golden Age of astronomy. Discoveries will come faster than ever since data is so readily available. He speculates that PhD candidates will be doing cutting edge research shortly after beginning their programs. I question why advanced undergraduates and informed laymen wouldn’t as well.

Yet for all the possibilities, the easy access to data will attract the crackpots too. Already, incompetent frauds swarm journals looking for quotes to mine. How much worse will it be when they can point to the source material and their bizarre analysis to justify their nonsense? To combat this, astronomers (as all scientists) will need to improve their public outreach programs and prepare the public for the discoveries to come.

Water on the Moon Could be Bad News for Future Lunar Astronomy

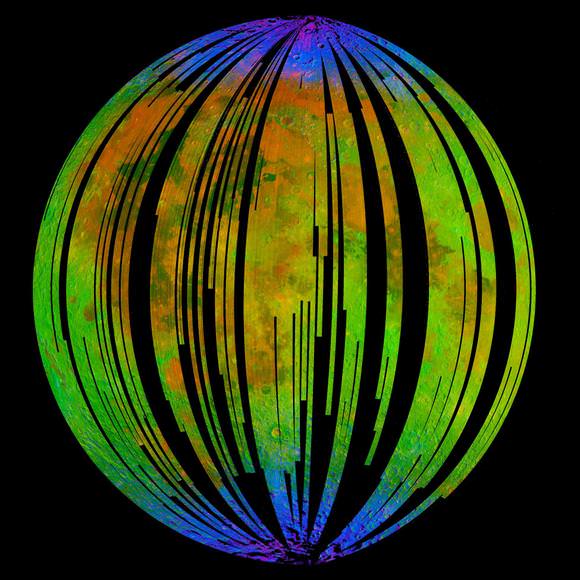
A false colour composite of the distribution of water and hydroxyl molecules over the lunar surface. Credit: ISRO/NASA/JPL-Caltech/Brown Univ./USGS

[/caption]

The recent discovery of water on the Moon may have a serious impact on future plans for lunar based astronomy. Space scientists from the Chinese Academy of Sciences have calculated that the scattering caused by molecules vaporized in sunlight could heavily distort observations from telescopes mounted on the Moon.

“Last year, scientists discovered a fine dew of water covering the Moon. This water vaporizes in sunlight and is then broken down by ultraviolet radiation, forming hydrogen and hydroxyl molecules. We recalculated the amount of hydroxyl molecules that would be present in the lunar atmosphere and found that it could be two or three orders higher than previously thought,” said Zhao Hua, who presented his team’s results at the European Planetary Science Congress in Rome.
The research has particular implications for the Chinese Lunar lander, Chang’E-3, which is planned to be launched in 2013. An ultraviolet astronomical telescope will be installed on the Chang’E-3 lander, which will operate on the sunlit surface of the Moon, powered by solar panels.

“At certain ultraviolet wavelengths, hydroxyl molecules cause a particular kind of scattering where photons are absorbed and rapidly re-emitted. Our calculations suggest that this scattering will contaminate observations by sunlit telescopes,” said Zhao.

The Moon’s potential as a site for building astronomical observatories has been discussed since the era of the Space Race. Lunar-based telescopes could have several advantages over astronomical telescopes on Earth, including a cloudless sky and low seisimic activity.

The far-side of the Moon could be an ideal site for radio astronomy, being permanently shielded from interference from the Earth. Radio observations would not be affected by the higher hydroxyl levels.

Source: European Planetary Science Conference

Transit

Transiting
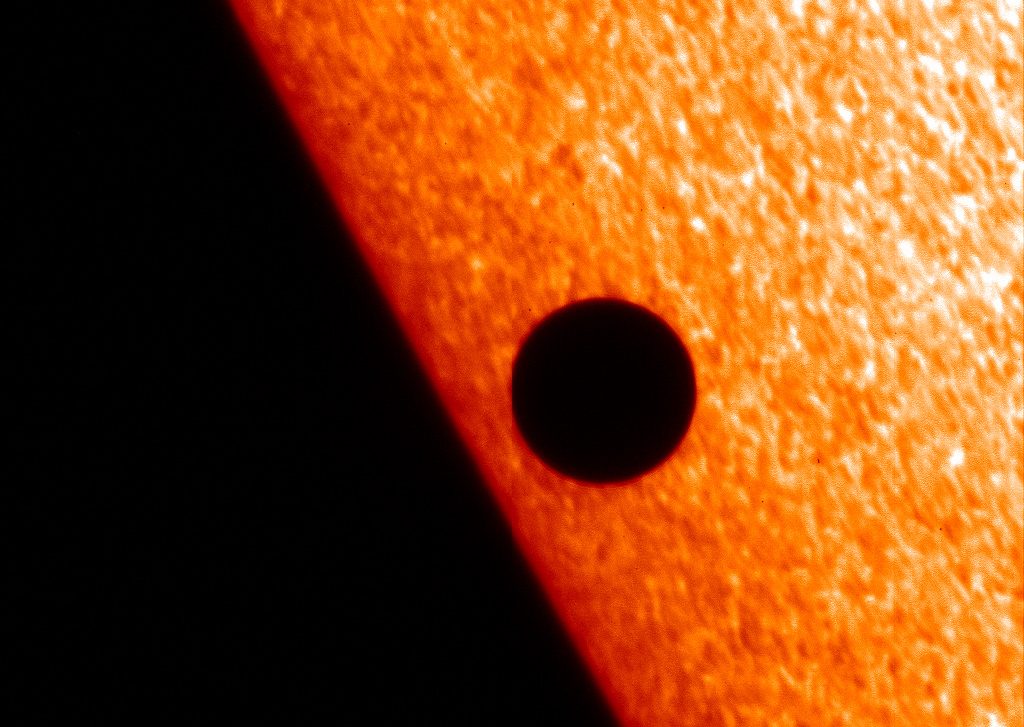
NASA's Hinode X-ray telescope captured Mercury in transit against the Sun's corona in Nov. 2006. Similar views are possible in H-alpha light. Credit: NASA

[/caption]

Although the word “transit” can have many meanings, here on Universe Today, we’re talking about astronomical transits. This is where one object in space moves directly in front of another, partly obscuring it from view.

The most famous example of an astronomical transit is a solar eclipse. From our vantage point on Earth, the Moon appears to pass directly in front of the Sun, obscuring it, and darkening the sky. When seen from space, the Moon casts a shadow on the surface of the Earth; only people within that shadowed area actually see the transit.

In order to have a transit, you need to have a closer object, a more distant object, and then an observer. When all three objects are lined up in a straight line, you’ll get a transit. There can be transits of Mercury and Venus across the surface of the Sun, or a transit of Earth across the Sun, seen from Jupiter. We can also see the transit of moons across the surface of their planets. Jupiter often has moons transiting in front of it.

Astronomers use the transit technique to discover extrasolar planets orbiting other stars. When a planet passes in front of a star, it dims the light from the star slightly. And then the star brightens again as the planet moves away. By carefully measuring the brightness of the star, astronomers are able to detect if they have planets orbiting them.

Transits are also helpful for studying the atmospheres of objects in the Solar System. Astronomers discovered that Pluto has a tenuous atmosphere by studying how it dimmed the light from a more distant star. As Pluto began transiting in front of the star, its atmosphere partly obscured the star, changing the amount of light observed. Astronomers were then able to work out the chemicals in Pluto’s atmosphere.

The next transit of Mercury will occur in 2016, and the next transit of Venus is scheduled to occur in 2012.

We have written many articles about astronomical transit for Universe Today. Here’s an article about the transit of Mercury, and here’s an article about the transit of Venus.

If you’d like more info about Astronomical Transit, check out NASA Homepage, and here’s a link to NASA’s Solar System Simulator.

We’ve also recorded related episodes of Astronomy Cast about the Eclipse. Listen here, Episode 160: Eclipses.

Source: Wikipedia

Win ‘Star Walk’ and ‘Solar Walk’ Astronomy Apps

I’ve had a couple of people excitedly show me the Star Walk astronomy app on their iPhones and ipads, and it really is great. You can hold your device up to the sky and it will show you a sky map of your exact position. Move your device around the sky, and it moves with you. It is a very high quality, dynamic and realistic stargazing guide, which — if you are a beginning or experienced astronomer — makes skywatching easy for everybody! There is also a “Solar Walk” app — which has very cool 3D images, so grab your 3D glasses to fully enjoy. See more about this app below.
Continue reading “Win ‘Star Walk’ and ‘Solar Walk’ Astronomy Apps”

Finding the Origin of Milky Way’s Ancient Stars

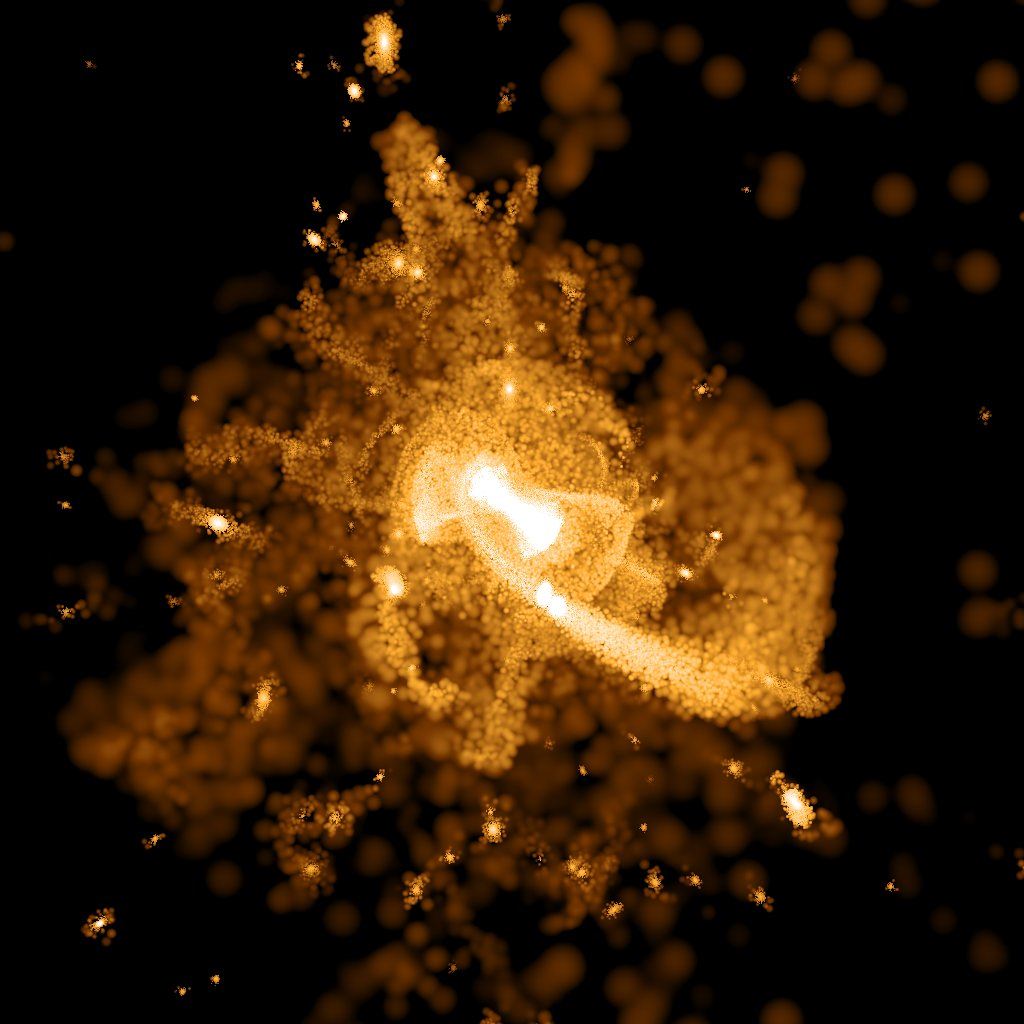
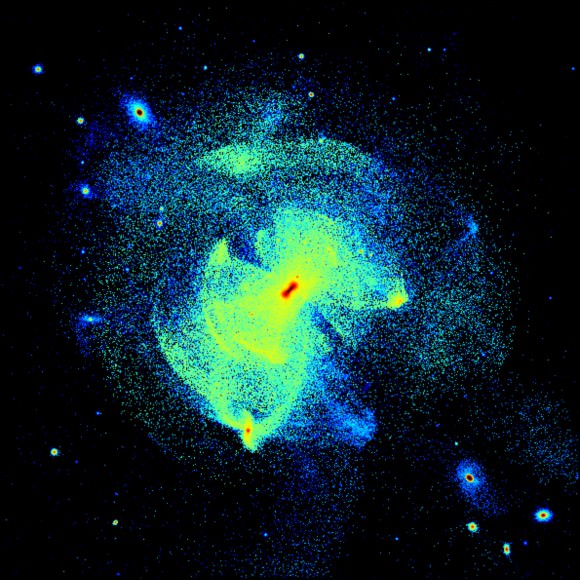
Simulation showing a Milky Way-like galaxy around five billion years ago, when most satellite galaxy collisions were happening. Credit: Andrew Cooper, John Helly (Durham University)

[/caption]

From the Royal Astronomical Society

Many of the Milky Way’s ancient stars are remnants of other smaller galaxies torn apart by violent galactic collisions around five billion years ago, according to researchers at Durham University, who publish their results in a new paper in the journal Monthly Notices of the Royal Astronomical Society.

Scientists at Durham’s Institute for Computational Cosmology and their collaborators at the Max Planck Institute for Astrophysics, in Germany, and Groningen University, in Holland, ran huge computer simulations to recreate the beginnings of our Galaxy.

The simulations revealed that the ancient stars, found in a stellar halo of debris surrounding the Milky Way, had been ripped from smaller galaxies by the gravitational forces generated by colliding galaxies.

Cosmologists predict that the early Universe was full of small galaxies which led short and violent lives. These galaxies collided with each other leaving behind debris which eventually settled into more familiar looking galaxies like the Milky Way.

The researchers say their finding supports the theory that many of the Milky Way’s ancient stars had once belonged to other galaxies instead of being the earliest stars born inside the Galaxy when it began to form about 10 billion years ago.

Simulation showing the stellar halo of a Milky Way-like galaxy in the present day. Credit: Andrew Cooper (Durham University)

Lead author Andrew Cooper, from Durham University’s Institute for Computational Cosmology, said: “Effectively we became galactic archaeologists, hunting out the likely sites where ancient stars could be scattered around the galaxy.

“Our simulations show how different relics in the Galaxy today, like these ancient stars, are related to events in the distant past.

“Like ancient rock strata that reveal the history of Earth, the stellar halo preserves a record of a dramatic primeval period in the life of the Milky Way which ended long before the Sun was born.”

The computer simulations started from shortly after the Big Bang, around 13 billion years ago, and used the universal laws of physics to simulate the evolution of dark matter and the stars.

These simulations are the most realistic to date, capable of zooming into the very fine detail of the stellar halo structure, including star “streams” – which are stars being pulled from the smaller galaxies by the gravity of the dark matter.

One in one hundred stars in the Milky Way belong to the stellar halo, which is much larger than the Galaxy’s familiar spiral disk. These stars are almost as old as the Universe.

Professor Carlos Frenk, Director of Durham University’s Institute for Computational Cosmology, said: “The simulations are a blueprint for galaxy formation.

“They show that vital clues to the early, violent history of the Milky Way lie on our galactic doorstep.

“Our data will help observers decode the trials and tribulations of our Galaxy in a similar way to how archaeologists work out how ancient Romans lived from the artefacts they left behind.”

The research is part of the Aquarius Project, which uses the largest supercomputer simulations to study the formation of galaxies like the Milky Way and was partly funded by the UK’s Science and Technology Facilities Council (STFC).

Aquarius was carried out by the Virgo Consortium, involving scientists from the Max Planck Institute for Astrophysics in Germany, the Institute for Computational Cosmology at Durham University, UK, the University of Victoria in Canada, the University of Groningen in the Netherlands, Caltech in the USA and Trieste in Italy.

Durham’s cosmologists will present their work to the public as part of the Royal Society’s 350th anniversary ‘See Further’ exhibition, held at London’s Southbank Centre until July 4th.

Listen to the Music of the Spheres

Pythagoras, the Greek mathematician and philosopher, is credited with saying, “There is geometry in the humming of the strings. There is music in the spacing of the spheres.” This idea of the “Music of the Spheres” has endured over the centuries, ultimately informing how Kepler visualized the movements of the planets, which led him to formulate his laws of planetary motion. The notion that the stars, planets and galaxies resonate with a mystical symphony is a rather appealing one.

If you’ve ever been curious about how this music would sound, I’d invite you to watch and listen to The Wheel of Stars. Jim Bumgardner, a software engineer specializing in visualizations who consults out of his home in Los Angeles, created this visualizer that utilizes data from the Hipparcos mission. The program puts the stars in the sky to an ethereal music of their own making.

As he describes on the site:

To make this, I downloaded public data from Hipparcos, a satellite launched by the European Space Agency in 1989 that accurately measured over a hundred thousand stars. The data I downloaded contains position, parallax, magnitude, and color information, among other things.

I used this information to plot the brightest stars, and cause them to revolve about Polaris (the North Star) very slowly, as the stars appear to do. Like the night sky, this is a sidereal time clock — it takes nearly 24 hours for the stars to fully rotate. You’ll notice some familiar constellations, such as the Big Dipper in there. As the stars cross zero and 180 degrees, indicated by the center line, the clock plays an individual note, or chime for each star. The pitch of the chime is based on the star’s BV measurement (which roughly corresponds to color or temperature). The volume is based on the star’s magnitude, or apparent brightness, and the stereo panning is based on the position on the screen (use headphones to hear it better).

Other projects that Bumgardner has developed include a music box that generates sound using trigonometry and harmonics and a camera that renders everything in ASCII code (yes, of course you can make yourself look like you’re in The Matrix). He also designed Coverpop, a program to which a user can give criteria that it uses to collects images and make a mosaic. All of these programs are more easily viewed and listened to than described, and are available on the Wheel of Stars site.

I interviewed Bumgardner about The Wheel of Stars via email. Here is what he had to say about the making of what he calls a “software toy”.

UT: What gave you the idea to make the Wheel of Stars?

JB: I’ve been interested in methods of producing automatic music since I studied music composition at CalArts. Among my interests are self-playing instruments like wind chimes, aeolian harps, player pianos and music boxes. A previous project which led directly to this one was my Whitney Music Box, based on the visual motion graphics of John Whitney.

So, already having the basic idea of using mathematical and random sources to trigger notes, in the style of a disc music box, it occurred to me that the stars themselves might make an interesting generator, and such a music box would make a very literal kind of “music of the spheres.”

UT: After looking at some of your other projects, I’m hard pressed as to exactly what to call the “Wheel of Stars.” It’s a toy, but more. It’s not really “just a software program,” or music visualizer, either. So, what do you call it?

JB: It’s a lot of things: It’s an aleatoric music composition which uses astronomical data for the “chance” element. It’s a software toy. It’s a work of art. It’s a musical clock. I think “software toy” is probably the best description from the above — a description I’ve applied to a lot of my projects. We hesitate to use the word “toy”, because we fear it belittles the project, but I think it imparts a healthy amount of playfulness in the description, and ultimately, these are works of play for me. I wrote a blog post which addresses this issue to some extent.

UT: I have to admit thinking, “This sounds what I have always imagined the “Music of the Spheres” to sound like.” You mention this in your description of the Wheel. This is probably a question you’ve had before, but I have to ask: was there any sort of influence from that age-old concept of the “Music of the Spheres” for the Wheel of Stars?

JB: Absolutely. My “Whitney Music Box” is another kind of music of the spheres, based as it is on basic trigonometry and harmonics. A lot of my work is concerned with circles, and I imagine I could go on making other kinds of “Music of the Spheres” for a long time to come.

I should also mention that the ethereal quality of the music is very much affected by my choice of audio sample. If I had used a Banjo sound, the effect would be quite different. I chose that particular sound because of my own preconceived notions of what a star should sound like. Probably a similar mental process to what Alexander Courage went through when he chose the opening notes for Star Trek.

UT: What would you like viewers/listeners to take away from the program/toy/visualizer?

JB: A little wonderment. A little more interest in the stars. Maybe do some research on Wikipedia, or pick up a good starter book like H.A. Rey’s “The Stars”. A very few listeners might be tempted to teach themselves how to program computers and make their own software toys. The “Processing” language is good place to start (processing.org).

UT: Have you had many planetariums or schools contact you to get it incorporated into their shows or curriculum?

JB: A couple nibbles, but nothing serious yet. I’d love to set up a large scale version of this piece — I think it would have a significant impact on the viewer.

UT: Did you design it with schools/planetariums in mind, or was it more for the pleasure of doing so?

JB: I made the piece because I was curious what it would sound like. Would it be totally random? Would there be hidden melodies or a secret message hidden in the stellar arrangement? Ultimately, I think I found a little bit of both. It’s quite different in character from what I would have gotten if the points where laid out with a number generator (and of course my choice of parameter mapping has a big effect on the outcome), but it’s not exactly morse code.

I also wanted to share it with people. The first version I made, in Processing, wasn’t easily sharable, so I ported it to Flash, so I could put it on the website.

UT: Any screen saver software planned for the future?

JB: I’ve prepared a stand-alone version which I email to folks upon request. It can be converted to a screen-saver with the right software. In my opinion, screensavers aren’t ideal for this kindof piece, because you don’t want your computer emitting sounds when you walk away (and can’t turn it off). But I think a stand-alone program that doesn’t require internet access, and which has higher quality sounds would be great.

UT: Do you plan to make any other astronomy-related programs like the Wheel of Stars?

JB: Yes. It occurs to me that a series of (8 or 9) short pieces based on astronomical data about the planets (their motions, and composition) might be interesting. However, at the moment, I’m pretty busy with other things.

UT: What other projects are you working on, astronomy-related or otherwise? I’ll cover the ASCII cam, Whitney Music Box and Coverpop and others in the article.

JB: I’m working on facilitating a showing of James Whitney’s extraordinary films “Lapis” and “Yantra” in Los Angeles next month (February 10th at the Silent Music Theater in Hollywood). We wlll be showing new digital transfers of these films, with live musical accompaniment. I also host and play piano at an Open Mic at Jones Coffee in Pasadena every month.

A couple of computer-related projects of interest: my recent music piece “Kasparov vs. Deep Blue” in which I programmed a chess computer to produce musical feedback showing what it is “thinking”, [See the video here] and my work simulating the automatic music algorithms of Athanasius Kircher. [a link to the paper can be found here].

Source: email interview with Jim Bumgardner. Cycling helmet nod to The Bad Astronomer

Accessible Astronomy: Touching the Night Sky

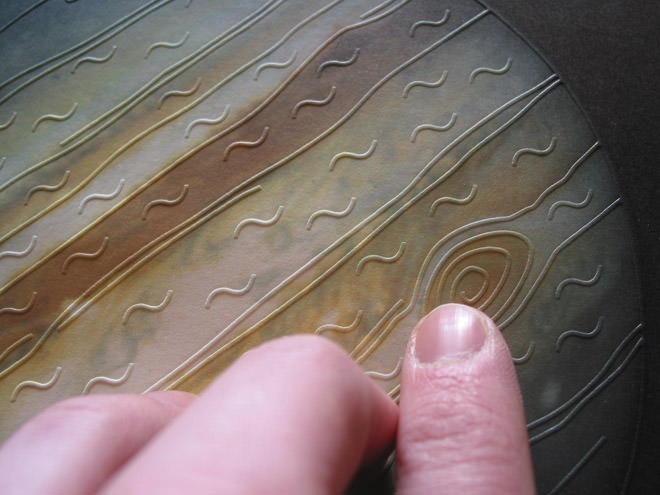
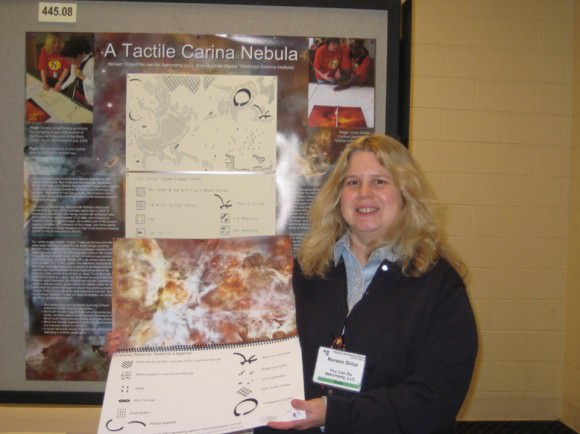
Caption: A page from “Touch the Universe.” Image courtesy of Noreen Grice.

The stunning images provided by space- and ground-based telescopes are visual wonders to behold. But those who are visually impaired can also enjoy astronomical images thanks to the work of Noreen Grice. For 25 years Grice has been working to make sure astronomy is accessible for everyone, including those who are blind or have low vision, as well as those who have impaired hearing. She has created of a series of books and other products that are designed to bring the universe to everyone.

Grice’s five astronomy books are accessible with text in both print and Braille along with pictures that are touchable. Using tactile overlays of line drawings of stars, planets, comets and other objects, real pictures come to life for the visually impaired. But they can also be shared by sighted people as well.

Listen to an interview with Noreen Grice by Carolyn Collins Petersen on the January 14th edition of 365 Days of Astronomy. Also visit Petersen’s website, The SpaceWriter, for additional info.

Her motivation came from a group of blind students who attended a planetarium show she presented in 1984 at the Boston Museum of Science, and she says those students opened her eyes to the need for accessibility in science education. “After the show was over, I asked them about their experience, and they told me the show ‘stunk,'” Grice said, “and it got me thinking — why can’t astronomy be accessible for everyone?”

She began by etching constellations, planets and star clusters, and galaxies on plastic by hand to use at the planetarium. But then she got the idea to try and create a book.

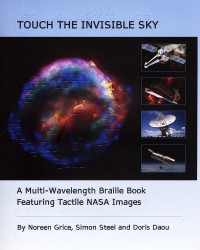
Touch the Invisible Sky by Noreen Grice, Simon Steel and Doris Daou

“For my first book, Touch the Stars, I wanted the pictures to be raised up and touchable, with the text imprinted in Braille,” Grice told Universe Today. “But when my second book came out, Touch the Universe, which was made using Hubble images, I felt like there was no way these pictures should just be line drawings because they are so colorful and beautiful. So from that point on that I’ve made the pictures in color and touchable, and the text is in both print and Braille.”

Grice said books that are just in Braille or are “touch only” books continue to make barriers for people. “One of the problems is that there are few resources for blind people, and those that are available are completely separate from books for the sighted,” she said. “I wanted to break down the barriers and bring people together so that everyone could use the same materials.”

That means that blind and sighted family members can enjoy Grice’s book together, and for students in a classroom, it means all students can use the same book, instead of having a “special” or different book for blind students.

“I want to break down barriers, and it is great that everyone in a classroom can use the same book,” she said. “Plus, it turns out our books are helpful for sighted people, as it makes it understandable for everyone, and provides a way to meet the needs of a variety of learning styles.”

Grice has worked in conjunction NASA and other astronomers and educators to create her books. Recently, she finished working on a book called Touch the Earth, which includes tactile images, and also has DVD for audio and sign language.

Noreen Grice at the AAS meeting, showing the Tactile Carina Nebula.

At the American Astronomical Society Meeting last week, Grice shared with astronomers the Tactile Carina Nebula, which was created from a large Hubble mosaic of images. By working with scientists Grice was able to include touchable variations for the different regions and objects in the image.

See this website for more info on the Tactile Carina Nebula.

Grice said she has had blind students contact her, or come up to her at National Federation of the Blind conventions who say because they read her books they have developed an interest in space and astronomy. “I know two students who are determined to be the first blind astronauts and another who wants to be an astronomer,” she said. “There is a whole universe out there, and I know that anyone can become a scientist and contribute to the scientific endeavor.”

Grice still works at the Boston Museum of Science and she shared that just recently a hearing impaired family came to the planetarium show. “I realized they were hearing impaired and told them we had captioning available,” Grice said. “It took me less than a minute to give them everything they needed, and they were so appreciative. The situation was a complete opposite of what it was in 1984, and it just confirmed that all my hard work in making the planetarium seamlessly accessible for everyone was worth it.”

For more information, check out You Can Do Astronomy, the website for Grice’s company

Measuring the Moon’s Eccentricity at Home

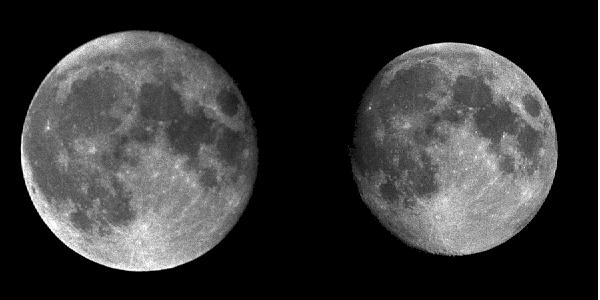
View of the moon at perigee and apogee

Caption: View of the moon at perigee and apogee

As a teacher, I’m always on the lookout for labs with simple setups appropriate for students. My current favorite is finding the speed of light with chocolate.

In a new paper recently uploaded to arXiv, Kevin Krisciunas from Texas A&M describes a method for determining the orbital eccentricity of the moon with a surprisingly low error using nothing more than a meter stick, a piece of cardboard and a program meant for fitting curves to variable stars.

This method makes use of the fact that the eccentricity can be determined from the ratio of the mean angular size of an object and one half of its amplitude. Thus, the main objective is to measure these two quantities.

Kevin’s strategy for doing this is to make use of a cardboard sighting hole which can slide along a meter stick. By peering through the hole at the moon, and sliding the card back and forth until the angular size of the hole just overlaps the moon. From there, the diameter of the hole divided by the distance down the meter stick gives the angular size thanks to the small angle formula (? = d/D in radians if D >> d).

To prevent systematic errors in misjudging as the card is slid forward until the size of the hole matches the moon, it is best to also approach it from the other direction; Coming from in from the far end of the meter stick. This should help reduce errors and in Kevin’s attempt, he found that he had a typical spread of ± 4 mm when doing so.

At this point, there is still another systematic error that must be taken into account: The pupil has a finite size comparable to the sighting hole. This will cause the actual angular size to be underestimated. As such, a correction factor is necessary.

To derive this correction factor, Kevin placed a 91 mm disk at a distance of 10 meters (this should produce a disk with the same angular size as the moon when viewed from that distance). To produce the best match, the slip of cardboard with the sighting hole should need to be placed at 681.3 mm on the meter stick, but due to the systematic error of the pupil, Kevin found it needed to be placed at 821 mm. The ratio of the observed placement to the proper placement provided the correction factor Kevin used (1.205). This would need to be calibrated for each individual person and would also depend on the amount of light during the time of observation since this also affects the diameter of the pupil. However, adopting a single correction factor produces satisfactory results.

This allows for properly taken data which can then be used to determine the necessary quantities (the mean angular size and 1/2 the amplitude). To determine these, Kevin used a program known as PERDET which is designed for fitting sinusoid curves to oscillations in variable stars. Any program that could fit such curves to data points using a ?2 fit or a Fourier analysis would be suitable to this end.

From such programs once the mean angular size and half amplitude are determined, their ratio provides the eccentricity. For Kevin’s experiment, he found a value of 0.039 ± 0.006. Additionally, the period he determined from perigee to perigee was 27.24 ± 0.29 days which is in excellent agreement with the accepted value of 27.55 days.

Measuring the Coronal Temperature with Iron

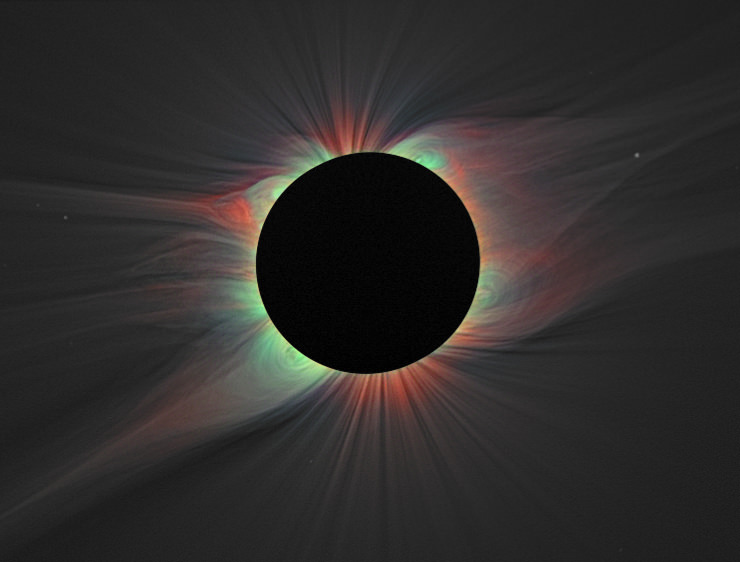
This image of the solar corona contains a color overlay of the emission from highly ionized iron lines and white light taken of the 2008 eclipse. Red indicates iron line Fe XI 789.2 nm, blue represents iron line Fe XIII 1074.7 nm, and green shows iron line Fe XIV 530.3 nm. This is the first such map of the 2-D distribution of coronal electron temperature and ion charge state. Credit: Habbal, et al.

Astronomers presenting at this week’s AAS conference have reported on new research measuring the temperature of the solar corona. The work combines observations of the Sun’s outer reaches from observations during total solar eclipses in 2006, 2008, and 2009. It utilized mapping of various abundances of ionized iron to build a two dimensional temperature map.

Although many introductory science classes paint temperature as a fixed number, in reality, it’s the average of a range of temperatures which is a way of quantifying the kinetic energy of the particles in question. Individual particles may be hotter (higher kinetic energy) while others may be cooler (lower kinetic energy). As these atoms move around, they can collide and these collisions will knock off electrons causing the atoms to become ionized. The degree of ionization will be indicative of just how energetic the collision was.

Those ionized atoms can then be identified spectroscopically or by using a filter to search for the wavelength at which those atoms will emit light as new electrons settle down into the previously vacated orbitals. By measuring the relative amounts of ionization astronomers can then reconstruct the range of kinetic energies in the gas and thus, temperature range which can, in turn, be used to determine the average temperature.

This is the method an international team of astronomers used to study the sun’s corona. Since light atoms don’t work well for this method (they become fully ionized or just can’t show a large range of ionization like atoms with more electrons), the astronomers chose to study the Sun’s corona through various states of iron ionization. In doing so they mapped several ionization states, including capturing for the first time, the elusive Fe IX lines (iron with 8 electrons knocked off) at 789.2 nm.

One interesting finding was that the region of emission extended to three solar radii (or 1.5 times the diameter). After this distance, the collision rate drops off and can no longer cause the ionization of atoms (however, radiative processes caused by photons from the sun can still ionize the atoms, but this is no longer indicative of the temperature of the atoms). This was further than originally anticipated.

Another result of their work showed that there is a strong correspondence between the amounts of various ions coming from the sun and that same ratio in interplanetary space as measured by the SWICS on the Advanced Composition Explorer. This connection will better help astronomers understand the working of our Sun as well as how its emissions may impact the Earth.

The full results of this work are to be published in the January 10 issue of the Astrophysical Journal.

Spitzer Peers Into the Small Magellanic Cloud

Spitzer Image of the Small Magellanic Cloud

This week at the AAC Conference, astronomers released a new image of the Small Magellanic Cloud (SMC, a dwarf galaxy just outside our Milky Way) from Spitzer. The purpose of the image was to study “the life cycle of dust in this galaxy.” In this life cycle, clouds of gas and dust collapse to form new stars. As those stars die, they create new dust in their atmosphere which will enrich the galaxy and, when the stars give off that dust, will be made available future generations of stars. The rate at which this process occurs determines how fast the galaxy will evolve. This research has shown that the SMC is far less evolved than our on galaxy and only has 20% of the heavy elements that our own galaxy has. Such unevolved galaxies are reminiscent of the building blocks of larger galaxies.

As with most astronomical images, this new image is taken in different filters which correspond to different wavelengths of light. The red is 24 microns and traces mainly cool dust which is part of the reservoir from which new star formation can occur. Green represents the 8 micron wavelength and traces warmer dust in which new stars are forming. The blue is even warmer at 3.6 microns and shows older stars which have already cleared out their local region of gas and dust. By combining the amount of each of these, astronomers are able to determine the current rate at which evolution is taking place in order to understand how the evolution of the SMC is progressing.

The new research shows that the tail (lower right in this image) is tidal in nature as it’s being tugged on by gravitational interactions with the Milky Way. This tidal interaction has caused new star formation in the galaxy. Surprisingly, the team of researchers also indicated that their work may indicate that the Magellanic Clouds are not gravitational bound to the Milky Way and may just be passing.

More images can be found at the JPL website.