An Astronomical Perspective on Climate Change

Ice cores and deep sea bed cores provide the best available record of changes in global temperature and CO2 content of the atmosphere going back 800,000 years. The data shows a clear periodicity in global temperatures which is thought to be linked to the Milankovitch cycle.

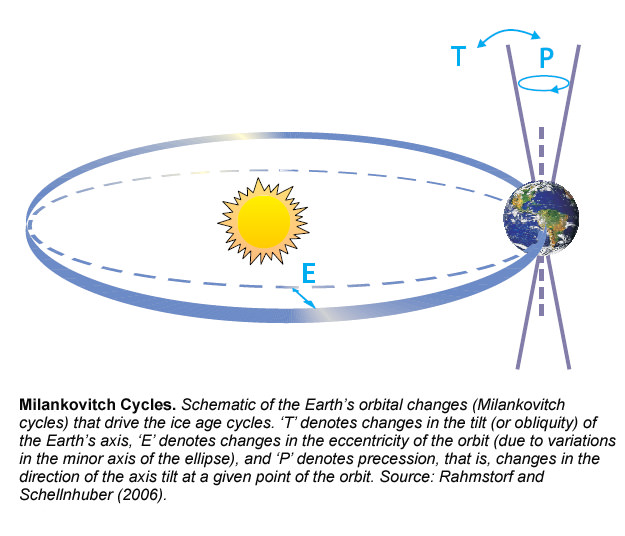
Back in 1920, Milutin Milankovitch, a Serbian mathematician, proposed that fine changes in Earth’s orbit around the Sun could explain an approximately 100,000 year cycle in glaciation seen from geological evidence. The tilt of the Earth’s axis swings slightly over a 41,000 year cycle – the eccentricity of Earth’s orbit moves from almost circular to more elliptical and back again over a 413,000 year cycle – and overlaying that you have not only the precession of the equinoxes, which is an inherent wobble in the Earth’s axial spin over a 26,000 year cycle, but also a precession of the whole of Earth’s orbit over a 23,000 year cycle.

Ice core data does show a rough concordance between glaciation and the synchronicity of these orbital cycles. Even though there’s no significant change in the mean amount of solar radiation reaching the Earth over the period of its annual orbit – the orbital changes can lead to increased polar shadowing and cooling.

Once ice does start advancing from the poles, a positive feedback loop can develop – since more ice increases the albedo of Earth’s surface and reflects more of the Sun’s heat back into space, thus reducing mean global temperatures.
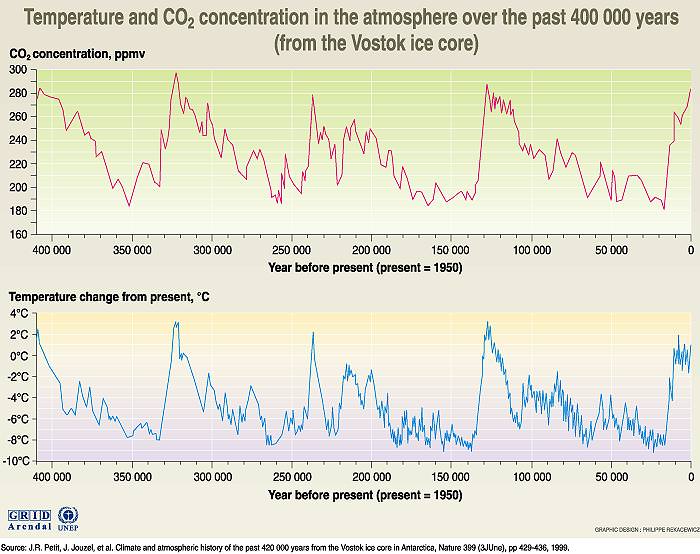
ice coreIt’s thought that what limits the ice advancing is increasing CO2 in the atmosphere – which can be measured from trapped bubbles of air in the ice cores. More ice formation leads to less exposed land area for photosynthesis and silicate rock weathering to remove CO2 from the atmosphere. So the more ice that’s formed, the more CO2 accumulates in the atmosphere – which causes mean global temperatures to rise, which limits ongoing ice formation.

Of course the opposite is true in an ice-melting phase. Ice melting also follows a positive feedback loop since less ice means less albedo, meaning less solar radiation is reflected back into space and mean global temperatures rise. But again, CO2 becomes the limiting factor. With more exposed land, more CO2 is drawn from the atmosphere by photosynthesizing forests and rock weathering. A consequent drop in atmospheric CO2 cools the planet and hence limits ongoing ice melting.

But there lies the rub. We are in an ice-melting phase of the Milankovitch cycle now, where the Earth’s orbit is closer to circular and the Earth’s tilt is closer to perpendicular. But CO2 levels aren’t declining – partly because we’ve chopped a lot of trees and forests down, but mostly because of anthropogenic CO2 production. Without the limiting factor of declining CO2 we’ve seen in previous Milankovitch cycles, presumably the ice is just going to keep on melting as the albedo of the Earth surface declines.

Projected changes in coastlines with 170 metre sea level riseSo you might want to rethink that next coastal real estate purchase – or hope for the best from Copenhagen.

Declassified Ice Loss Images

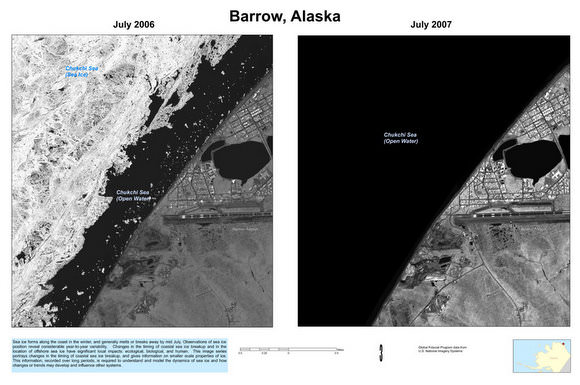
Ice loss in Barrow Alaska from 2006 to 2007. Credit: US Geological Survey

[/caption]
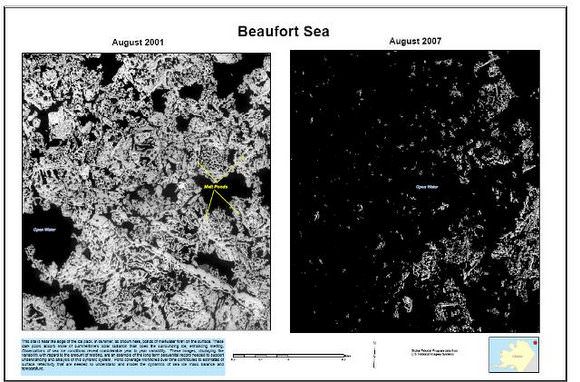
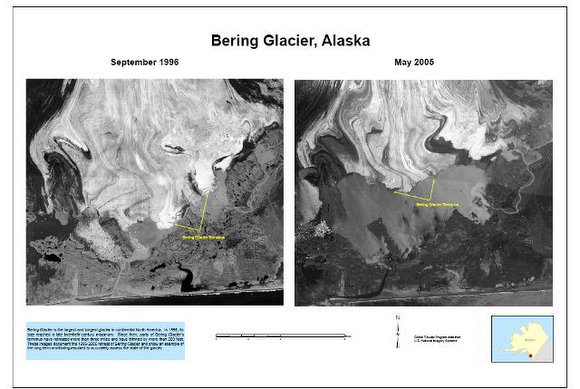
Last week the US government released more than a thousand intelligence images of Arctic ice that have been used to help scientists study the impact of climate change. The images were taken by spy satellites, as part of the Medea program, which lets scientists request spy pictures from environmentally sensitive locations around the world. After they were taken, the Bush Administration released the photographs to the scientists but deemed them “unsuitable for public release.” Earlier this month, the National Academy of Sciences recommended the Obama Administration declassify the photos, which they did within a few hours of the recommendation.

Various blogs are saying these dramatic images are faked, but since they are available through the US Geological Survey , that hardly seems likely. Over 700 images show changes of sea ice in various recent years from six sites around the Arctic Ocean, with an additional 500 images of 22 sites in the United States.

Ice loss in the Beaufort Sea. Credit: USGS

Scientists request ice pictures to be taken by intelligence satellites because the resolution is much greater, in some cases, than other available satellite images. According to Reuters, the newly declassified Arctic images have a resolution of about 1 yard (1 meter), a vast improvement on previously available pictures of sea ice which have a resolution between 15 and 30 meters.

Ice loss at the Bering Glacier. Credit: USGS

Sources: Reuters, USGS, TrueSlant

Past Climate Change Cannot Be Tied to Earth Passing Through Galactic Plane

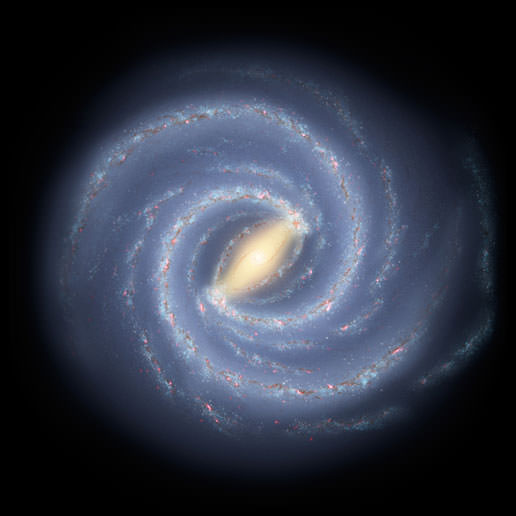
The latest map of the Milky Way shows only two arms. Credit: NASA/ Spitzer Space Telescope

[/caption]

Earth’s climate has changed over time, but the cause for the changes has been hotly debated. One idea (Shaviv and Veizer,2003), suggested that perhaps two-thirds to three-fourths of the variance in Earth’s temperature over the past 500 million years may be attributable to when our solar system passes through the spiral arms of the Milky Way galaxy. The evidence seemed to fit: there appears to be a 140 million year cycle of global climate change, and that correlates when our solar system seems to move between spiral arms, too. Or at least it used to. Since 2003 we have revised our map of the galaxy, which changes the estimation of when Earth transits through the spiral arms.

“Although previous work found a correlation between the 140 Myr climate cycle on Earth and the intersection with spiral arms,” write researchers Adrian Melott, Andrew Overholt, and Martin Pohl, “with new data on the structure of the galaxy, this correlation disappears.”

On Earth, the 140 million year cycle is estimated from the timing of ice ages and abundances of fossils.

The basic idea of the earlier research was that when the solar system journeys through the Milky Way’s spiral arms the event rate of cosmic rays in the Earth’s atmosphere greatly increases, since the number of supernovae in spiral arms is clearly much larger than in between the arms. This could affect cloud formation on Earth and therefore strength of greenhouse effect.

But that assumed the Milky Way had four arms, and was less massive than new calculations show. In 2008, new information from the Spitzer Space Telescope helped astronomers conclude that the Milky Way consisted of two spiral arms and a large central bar. Additionally, in 2009 Spitzer data helped scientists conclude that our galaxy is much more massive than originally thought, and is moving faster than originally estimated.

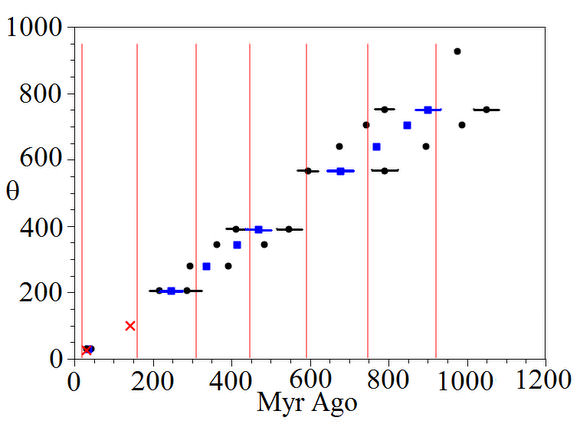
Red vertical lines represent the midpoints of the last seven ice ages, which don't correlate with the passage of the solar system through the galactic plane. Credit Melott, Overholt and Pohl.

So just when has Earth passed through the galactic arms? With changing estimations of mass and smaller number of arms, no one can be absolutely sure. But Melott and his team have compared the times of transit between regions of the new galactic map with changes in Earth’s climate and found that the 140 million year correlations no longer apply.

The team also says the 140 million year cycle cannot be made to match up with any cyclical movement of the solar system through the galaxy.

“The only periodic trend that can be found with the new data is the relative orbital period of our solar system,” the team writes in their paper, “relative to the previously assumed pattern speed around the galactic plane, which is slightly larger than 500 Myr. Though one could create varying periodic trends by changing this pattern speed, the orbital period relative to the galactic pattern could never reach the 140 Myr time as this is less than the orbital period itself, meaning the pattern and the Sun would be required to move in opposite directions.”

So, the researchers conclude, the solar system passing through the plane of the galactic arms could have no direct tie with past climate change on Earth.

The team’s paper can be read here.

Graphic caption: Red vertical lines represent the midpoints of the last seven ice ages, which don’t correlate with the passage of the solar system through the galactic plane. Credit Melott, Overholt and Pohl.

Source: arXiv, Technology Review Blog

More Atmospheric CO2 Today Than in the Past 2.1 Millions Years

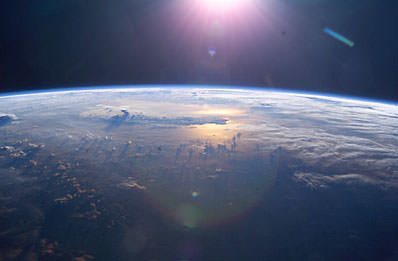
Earth from space. Credit: NASA

[/caption]
Researchers have been able to determine the atmospheric carbon dioxide levels over the past 2.1 million years in the sharpest detail yet by analyzing the shells of single–celled plankton. Their findings shed new light on CO2’s role in the earth’s cycles of cooling and warming, confirming many researchers’ suspicions that higher carbon dioxide levels coincided with warmer intervals during the study period. But it also rules out a drop in CO2 as the cause for earth’s ice ages growing longer and more intense some 850,000 years ago.

The study, published in the June 19 issue of the journal Science shows that peak CO2 levels over the last 2.1 million years averaged only 280 parts per million; but today, CO2 is at 385 parts per million, or 38% higher. This finding means that researchers will need to look back further in time for an analog to modern day climate change.

Bärbel Hönisch diving for plankton in an early phase of the study.  Credit: Steve Doo
Bärbel Hönisch diving for plankton in an early phase of the study. Credit: Steve Doo

In the study, Bärbel Hönisch, a geochemist at Lamont-Doherty Earth Observatory, and her colleagues reconstructed CO2 levels by analyzing the shells of single-celled plankton buried under the Atlantic Ocean, off the coast of Africa. By dating the shells and measuring their ratio of boron isotopes, they were able to estimate how much CO2 was in the air when the plankton were alive. This method allowed them to see further back than the precision records preserved in cores of polar ice, which go back only 800,000 years.

Around 850,000 years ago, the climate cycles on Earth switched from being dominated by 40,000 year cycles, to the stronger 100,000 year cycles of the more recent times. The time period from 800 – 1,000 kyr ago is called the mid-Pleistocene transition, and since the rhythms of the Earth’s orbit didn’t change, some scientists have attributed that shift to falling CO2 levels. But the study found that CO2 was flat during this transition and unlikely to have triggered the change.

“Previous studies indicated that CO2 did not change much over the past 20 million years, but the resolution wasn’t high enough to be definitive,” said Hönisch. “This study tells us that CO2 was not the main trigger, though our data continues to suggest that greenhouse gases and global climate are intimately linked.”

The timing of the ice ages is believed to be controlled mainly by the earth’s orbit and tilt, which determines how much sunlight falls on each hemisphere. Two million years ago, the earth underwent an ice age every 41,000 years. But some time around 850,000 years ago, the cycle grew to 100,000 years, and ice sheets reached greater extents than they had in several million years—a change too great to be explained by orbital variation alone.

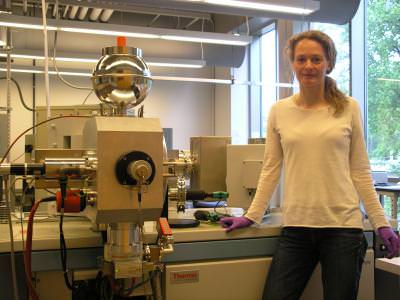
Barbel Honisch with a mass spectrometer used to measure boron isotopes to reconstruct past CO2.  Credit: Lamont-Doherty Earth Observatory
Barbel Honisch with a mass spectrometer used to measure boron isotopes to reconstruct past CO2. Credit: Lamont-Doherty Earth Observatory

A global drawdown in CO2 is just one theory proposed for the transition. A second theory suggests that advancing glaciers in North America stripped away soil in Canada, causing thicker, longer lasting ice to build up on the remaining bedrock. A third theory challenges how the cycles are counted, and questions whether a transition happened at all.

The low carbon dioxide levels outlined by the study through the last 2.1 million years make modern day levels, caused by industrialization, seem even more anomalous, says Richard Alley, a glaciologist at Pennsylvania State University, who was not involved in the research.

“We know from looking at much older climate records that large and rapid increase in C02 in the past, (about 55 million years ago) caused large extinction in bottom-dwelling ocean creatures, and dissolved a lot of shells as the ocean became acidic,” he said. “We’re heading in that direction now.”

The idea to approximate past carbon dioxide levels using boron, an element released by erupting volcanoes and used in household soap, was pioneered over the last decade by the paper’s coauthor Gary Hemming, a researcher at Lamont-Doherty and Queens College. The study’s other authors are Jerry McManus, also at Lamont; David Archer at the University of Chicago; and Mark Siddall, at the University of Bristol, UK.

Source: EurekAlert

Be A Carbon Hero

molly-lake-07-07-192.thumbnail.jpg

NASA is quite proud of its spinoffs technology developed for the space agency’s needs in space that in turn contribute to commercial innovations that improve life here on Earth. And rightly so. Just as a quick example, improvements in spacesuits have led to better protection for firefighters, scuba divers and people working in cold weather. But the list of NASA spinoffs is quite extensive.

Just like NASA, the European Space Agency (ESA) has a Technology Transfer office to help inventors and businesses use space technology for non-space applications. The latest invention touted as an ESA spinoff is a small hand-held device called a Carbon Hero that might help make people more aware of the carbon footprint they are leaving behind due to vehicle emissions.

Used in conjunction with a cell phone, the Carbon Hero receives data from navigation satellites to determine the mode of transportation being used. The device’s algorithm is able to use the speed and position of the user to determine how they are traveling, and how much CO2 they are generating. The user doesn’t have to enter any information, the data is computed automatically.

The user would get feedback on the environmental impact of different types of transportation – whether by train, plane, bike or by foot. The Carbon Hero lets the user compare one kind of travel with another and calculate the environmental benefits daily, weekly and monthly.

“If you go on a diet you want to see if all that effort has made a difference so you weigh yourself. The beauty of our system is that it’s easy; you have a “weighing scale” on you all the time giving you your carbon footprint. When you make the effort to walk instead of taking the car you can immediately see the result, so it feels more worthwhile doing it and you are more likely to stick with it,” says Andreas Zachariah, a graduate student from the Royal College of Art in London and inventor of Carbon Hero.

The device has been tested using the GPS system, but will be fully operational after Galileo, the European global navigation system is fully up and running.

Learn more about ESA’s Technology Transfer Programme Office.

Learn more about NASA Spinoffs.

Original News Source: ESA Press Release

Are We Living in a New Geologic Epoch?

globe_east_540.thumbnail.jpg

Have humans changed our planet Earth so much in the past 200 years that we are now living in a new geological age? A group of geologists believes this is the case. They have formally proposed designating a new geologic epoch, the Anthropocene, which would encompass the past 200 years or so of geologic history. The action is appropriate, they say, because during the past 2 centuries, human activity has caused most of the major changes in Earth’s topography and climate.

Like rings in a tree, each layer in Earth’s geologic record reflects the conditions of the time it was deposited and offers a glimpse into Earth’s past. In this geologic history that is written in the rocks and soil of our planet, researchers have differentiated the layers into classifications of time called eons, eras, periods, epochs, and ages that reflect characteristic conditions. For example, the Carboniferous period, which lasted from 360 million to 300 million years ago, is known for the vast deposits of coal that formed from jungles and swamps. Even some of the longer stretches have been named based on biology, such as the Paleozoic (“old life”) and the Cenozoic (“recent life”).

Earth has been has always been subject to the same kinds of physical forces–wind, waves, sunlight–throughout the planet’s existence. But the life that has arisen on the planet has had a much more varied impact such as the rise of plants that has shaped the planet in dramatic ways. But in the past 200 years, ever since the human population has reached 1 billion, our influences have affected the composition of Earth’s strata, altering the physical and chemical nature of ocean sediments, ice cores and surface deposits. Some of these influences are the use of fossil fuels and the growth of large cities.

British Geologist Jan Zalasiewicz and several colleagues argue that the International Commission on Stratigraphy should officially mark the end of the current epoch. That would be the Holocene (“entirely recent”), which started after the end of the last ice age, about 10,000 years ago. The new epoch would be the Anthropocene.

The evidence the geologists cite include the dramatic increase in lead concentration in the soil and water since about 1800 and the increase of carbon dioxide in the atmosphere. They claim that human processes now vastly outpace the equivalent natural forces. “A reasonable case can be made for the Anthropocene as a valid formal unit,” Zalasiewicz says.

The argument has merit, says American geologist Richard Alley. “In land, water, air, ice, and ecosystems, the human impact is clear, large, and growing,” he says. “A geologist from the far distant future almost surely would draw a new line, and begin using a new name, where and when our impacts show up.”

Original News Source: AAAS ScienceNow

Study Shows More Antarctic Ice Loss

antarctica.thumbnail.jpg

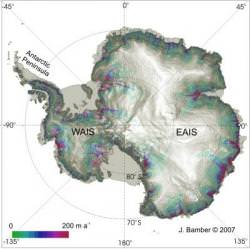
Increasing amounts of ice mass have been lost from West Antarctica and the Antarctic peninsula over the past ten years, according to a 10-year study from the University of Bristol, England. But at the same time, however, the ice mass in East Antarctica has been roughly stable, with neither loss nor accumulation over the past decade.

Professor Jonathan Bamber at the University of Bristol and colleagues estimated a loss of 132 billion tons of ice in 2006 from West Antarctica “up from about 83 billion tons in 1996” and a loss of about 60 billion tons in 2006 from the Antarctic Peninsula.

“To put these figures into perspective,” Bamber said, “four billion tons of ice is enough to provide drinking water for the whole of the UK population for one year.”

The data comes from satellite imagery that cover 85% of Antarctica’s coastline, which the researchers compared with simulations of snow accumulation over the same period, using a regional climate model.

“Over the 10 year time period of the survey, the ice sheet as a whole was certainly losing mass,” said Bamber, “and the mass loss increased by 75% during this time. Most of the mass loss is from the Amundsen Sea sector of West Antarctica and the northern tip of the Peninsula where it is driven by ongoing, pronounced glacier acceleration.”

In East Antarctica, the mass balance, which accounts for addition to the ice sheet due to snowfall and the subtraction of ice due to changes in the glacier, is near zero. But the thinning of its potentially vulnerable marine sectors suggests this may change in the near future.

As to the differences in the West and East Antarctic ice sheets, Bamber said, “The West Antarctic Ice Sheet is a “marine based” ice sheet resting on bedrock below sea level with bed slopes inclined downward inland. It has been suggested that this makes the WAIS more susceptible to change caused by the ocean than the East Antarctic Ice Sheet.”

The study conclude that the Antarctic ice sheet mass budget is more complex than indicated by the evolution of its surface mass balance or climate-driven predictions.

Changes in glacier dynamics are significant and may in fact dominate the ice sheet mass budget. This conclusion is contrary to model simulations of the response of the ice sheet to future climate change, which conclude that it will grow due to increased snowfall.

Satellite data was obtained from ERS-1, ERS-2, RADARSAT and ALOS.

Original News Source: University of Bristol Press Release