It Turns Out Primordial Gravitational Waves Weren’t Found

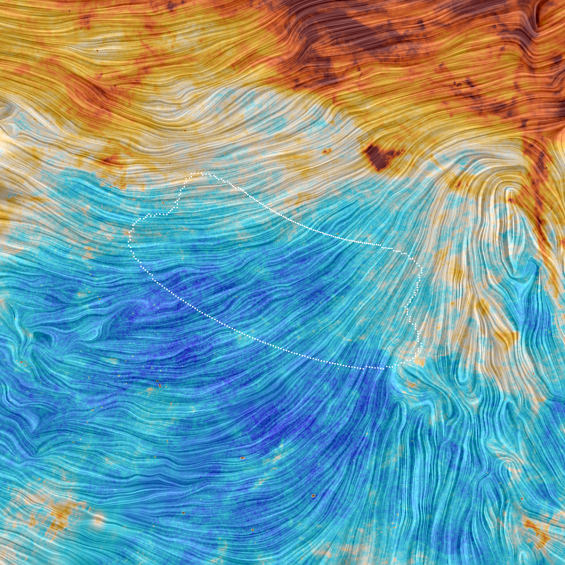
Planck view of BICEP2 field. Credit: ESA/Planck Collaboration. Acknowledgment: M.-A. Miville-Deschênes, CNRS – Institut d'Astrophysique Spatiale, Université Paris-XI, Orsay, France.

Last March, international researchers from the Background Imaging of Cosmic Extragalactic Polarization (BICEP2) telescope at the South Pole claimed that they detected primordial “B-mode” polarization of the cosmic microwave background (CMB) radiation. If confirmed, this would have been an incredibly important discovery for astrophysics, as it would constitute evidence of gravitational waves due to cosmic inflation in the first moments of the universe. Nevertheless, as often happens in science, the situation turns out to be more complicated than it initially appeared.

In a joint analysis of data from BICEP2/Keck Array in the South Pole and the space-based Planck telescope, scientists from both collaborations now have a more complete picture and argue that the interpretation of the evidence is muddier than they had previously thought. Their paper will appear in the arXiv pre-print server in a few days and is submitted for publication in the journal Physical Review Letters. [Update: the paper is now available on the arXiv.] The European Space Agency issued a press release about the paper on Friday after a summary of it was leaked and briefly posted on a French website.
Courtesy: Jet Propulsion Laboratory

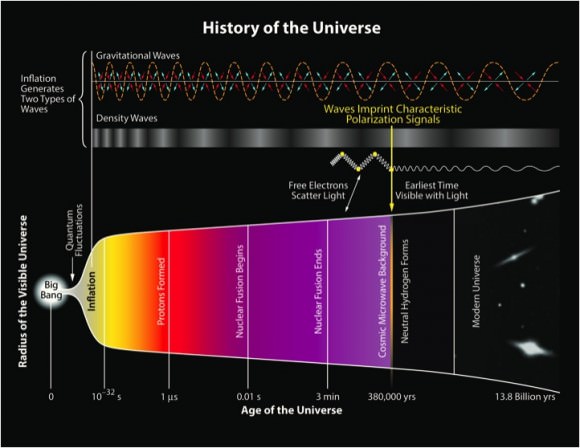
According to inflationary theory, the universe expanded for a brief period at an exponential rate 10-36 seconds after the Big Bang. As a result, models of inflation predict that this rapid acceleration would create ripples in space, generating gravitational waves that would remain energetic enough to leave an imprint on the last-scattered photons, the CMB radiation, approximately 380,000 years later. The CMB spectrum, the “afterglow of the hot Big Bang,” has rich structure in it and has been measured to a “ridiculous level of precision,” according to Professor Martin White (University of California, Berkeley), who gave a plenary talk on cosmology results from Planck at the recent American Astronomical Society meeting.

The twists in the polarization signal of the CMB, known as B-modes (shown below) and quantified by a nonzero tensor-to-scalar ratio r, would be evidence in favor of inflation but they are much more difficult to detect. Scientists are trying to decipher a signal on the level of parts per trillion of ambient temperature, mere fractions of a nano-degree! Since inflation would explain why the universe appears to have no overall curvature, why it approximately appears the same in all directions, and why it has structures of galaxies in it, BICEP2’s result last year—the first claimed detection of cosmic inflation—excited physicists around the world. But last summer, Planck scientists presented a map of polarized light from interstellar dust grains and argued that the polarization signal BICEP2 detected could be due to “foreground” dust in our own Milky Way galaxy rather than due to primordial gravitational waves in the distant universe. The hotly debated controversy remained unresolved and led to the new joint analysis by scientists from both teams.
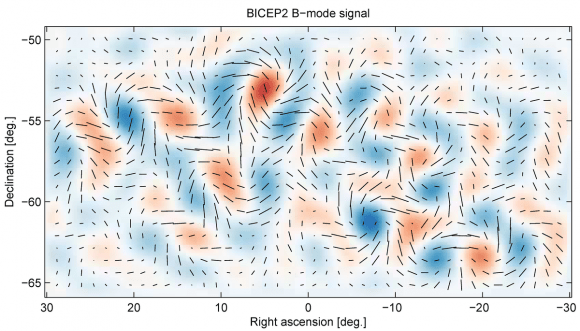
Courtesy: BICEP2
Courtesy: BICEP2

BICEP2 is sensitive to low frequencies (150 GHz) while Planck is more sensitive to higher ones (353 GHz). As Professor Brian Keating (University of California, San Diego), a member of the BICEP2 collaboration, puts it, “it’s as if you’re listening to an opera, but BICEP2 could only hear the tenors and Planck could only hear the sopranos.” Unfortunately, the joint analysis produced only an upper limit to the value of r, meaning that the evidence for B-mode polarization due to inflation remains elusive for now. “It’s probably at best an admixture of Milky Way dust and gravitational waves,” says Keating. [Full disclosure: until last year, Ramin Skibba was a research scientist in the same department but in a different field as Keating at UC San Diego.]

This result must seem disappointing to BICEP2 scientists, but science often works this way, especially for such a difficult phenomenon to study. The signal is strong, but the interpretation is more complicated than it first appeared. On a positive note, the analysis shows that CMB researchers are faced with a foreground challenge rather than one due to the Earth’s atmosphere or to their detectors.
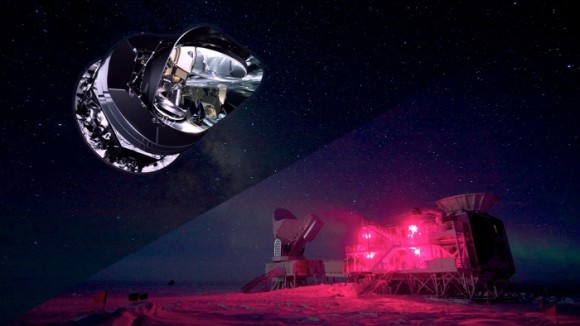
Illustration by Andy Freeberg, SLAC / South Pole Telescope photo by Keith Vanderlinde

Although Planck will have additional polarization measurements and more assessments of systematic uncertainties in a later data release, they will not be able to settle this debate for now. But new experiments will come online soon, including a BICEP3, and they will produce more precise measurements that could effectively remove the contribution from dust. The signal is tractable, and scientists are looking forward to the day when they can declare with strong statistical significance that they have finally discovered evidence of inflation.

Like a BOSS: How Astronomers are Getting Precise Measurements of the Universe’s Expansion Rate

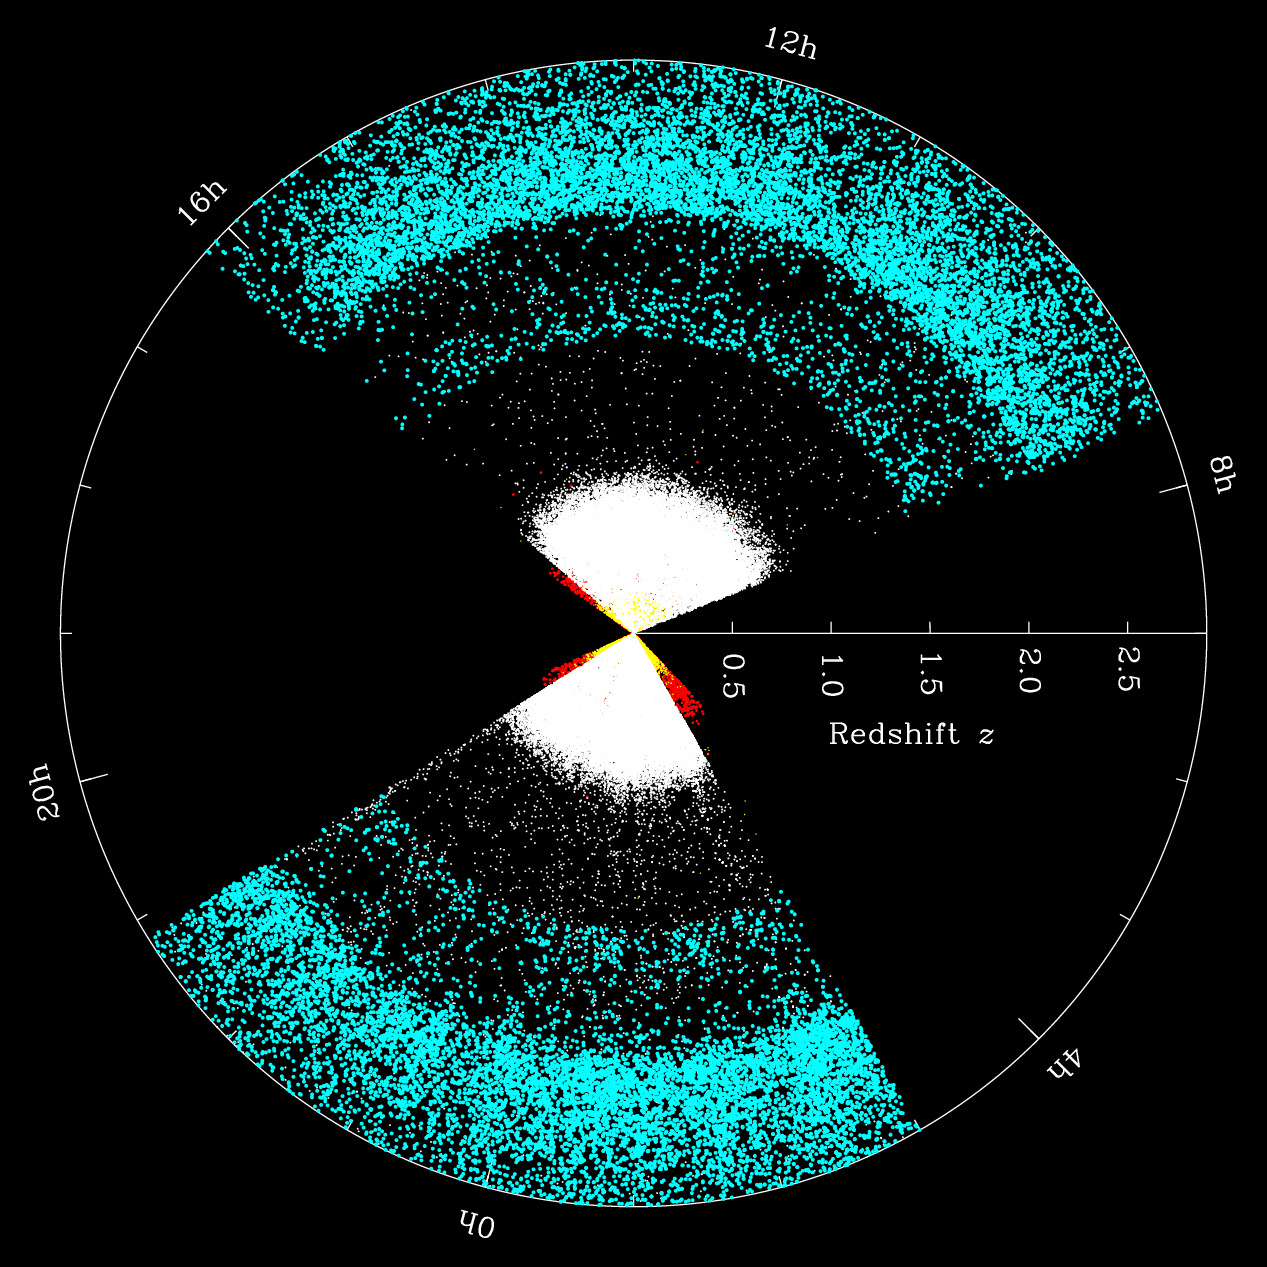
Distribution of galaxies and quasars in a slice of BOSS out to a redshift of 3, or 11 billion years in the past. Credit: SDSS-III

Astrophysicists studying the expansion of the Universe with the largest galaxy catalogs ever assembled are ushering in an exciting era of precision cosmology. Last week, the Sloan Digital Sky Survey (SDSS) issued its final public data release, and scientists working in its largest program, the Baryon Oscillation Spectroscopic Survey (BOSS) also presented their final results at the American Astronomical Society meeting in Seattle, Washington.

By mapping over 10,000 square degrees — 25% of the sky — BOSS is “measuring our universe’s accelerated expansion with the world’s largest extragalactic redshift survey,” according to SDSS-III Director Daniel Eisenstein of the Harvard-Smithsonian Center for Astrophysics. The BOSS results include new and precise measurements of the universe’s expansion rate (called the “Hubble constant”) and matter density, which includes dark matter, stars, gas, and dust.

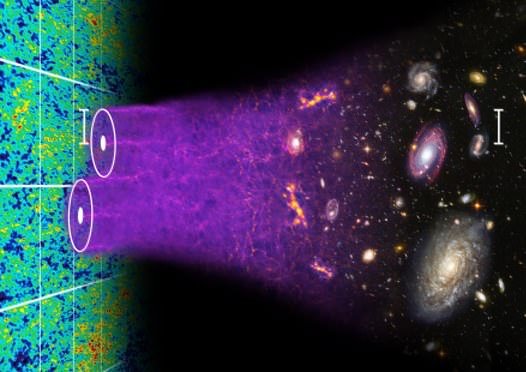
BOSS conducted its observations at 2.5-meter Sloan Foundation Telescope at Apache Point Observatory in New Mexico, producing spectra and spatial positions for 1.5 million galaxies and 300,000 quasars in a volume equivalent to a cube with length 8.5 billion light-years on a side (see image above). Astronomers used this rich dataset to map the objects’ distributions and to detect the characteristic scale imprinted by baryon acoustic oscillations in the early universe. Sound waves propagate outward with time, like ripples spreading in a pond, and are indicated by a large-scale clustering signal in the positions of galaxies relative to each other (see illustration below). By analyzing this signal at different times, it is possible to study the behavior of the mysterious “dark energy” causing the accelerating expansion of the universe.

An illustration of the concept of baryon acoustic oscillations, imprinted in the early universe and seen today in galaxy surveys. (courtesy:  Chris Blake and Sam Moorfield)
An illustration of the concept of baryon acoustic oscillations, imprinted in the early universe and seen today in galaxy surveys. (courtesy: Chris Blake and Sam Moorfield)

In BOSS’s final results, hundreds of scientists in the international collaboration measured this scale with unprecedented precision. In particular, Ashley Ross from Ohio State University presented results that demonstrated the power of combining an analysis of the transverse and line-of-sight distributions of galaxies. In a paper by Eric Aubourg and collaborators, BOSS astronomers measured the cosmic distance scale of galaxies in the “local” universe and of quasars in the distance universe with impressively small systematic errors—at less than the 1% level—when combined with cosmic microwave background constraints. Their cosmological analysis yields a measurement of the Hubble constant and of the matter density of the universe consistent with a “flat” cold dark matter cosmology with a cosmological constant (see below). Cosmological models including curvature, evolving dark energy, or massive neutrinos are not completely ruled out but are less supported by the data than before. Other results from the collaboration will be submitted for publication in the coming months.

Cosmological constraints on the Hubble parameter h, matter density Ωm, and curvature parameter Ωk from BOSS's baryon acoustic oscillations (BAO) combined with supernovae (SN) and Planck results. (Courtesy: Aubourg et al. 2014)
Cosmological constraints on the Hubble parameter h, matter density Ωm, and curvature parameter Ωk from BOSS’s baryon acoustic oscillations (BAO) combined with supernovae (SN) and Planck results. (Courtesy: Aubourg et al. 2014)

The BOSS dataset “represents the gold standard in mapping out the network of galaxies that comprises the large-scale structure of the Universe…The data enables us to trace, with greater precision than ever before, the presence of dark energy, the behaviour of gravity on cosmic scales, and the effect of massive neutrinos,” says Chris Blake of Swinburne University, not affiliated with the collaboration.

Where will the BOSS team go from here? The collaboration has begun work on SDSS-IV, whose six-year mission includes an ambitious extended BOSS (eBOSS) survey. According to eBOSS Targeting Coordinator Jeremy Tinker of New York University, eBOSS observations of over 700,000 quasars will precisely measure the distance scale “at a much higher redshift regime that is not covered by current large-scale surveys.”

You can read more about BOSS and updates about the three other componenets of the SDSS in our previous article here.
SDSS website

(Full disclosure: Ramin Skibba had been a member of the BOSS collaboration during 2010-2012.)

What Is This Empty Hole In Space?

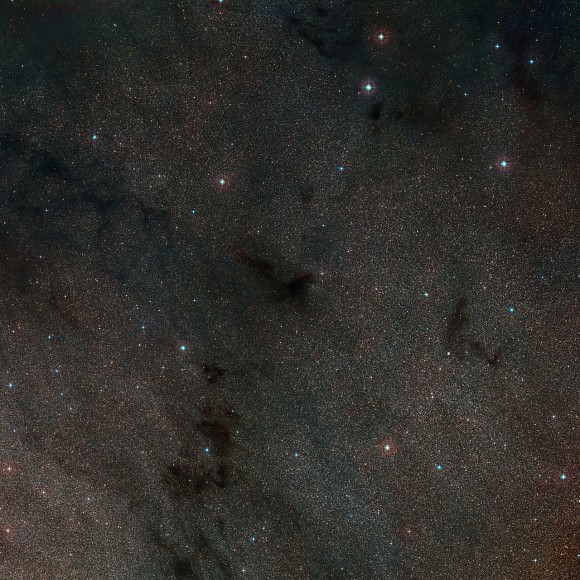
The dark nebula LDN 483 imaged by ESO's La Silla Observatory in Chile (ESO)

What may appear at first glance to be an eerie, empty void in an otherwise star-filled scene is really a cloud of cold, dark dust and molecular gas, so dense and opaque that it obscures the distant stars that lie beyond it from our point of view.

Similar to the more well-known Barnard 68, “dark nebula” LDN 483 is seen above in an image taken by the MPG/ESO 2.2-meter telescope’s Wide Field Imager at the La Silla Observatory in Chile.

While it might seem like a cosmic no-man’s-land, no stars were harmed in the making of this image – on the contrary, dark nebulae like LDN 483 are veritable maternity wards for stars. As their cold gas and dust contracts and collapses new stars form inside them, remaining cool until they build up enough density and gravity to ignite fusion within their cores. Then, shining brightly, the young stars will gradually blast away the remaining material with their outpouring wind and radiation to reveal themselves to the galaxy.

The process may take several million years, but that’s just a brief flash in the age of the Universe. Until then, gestating stars within LDN 483 and many other clouds like it remain dim and hidden but keep growing strong.

Wide-field view of the LDN 483 region. (Credit: ESO and Digitized Sky Survey 2)

Located fairly nearby, LDN 483 is about 700 light-years away from Earth in the constellation Serpens.

Source: ESO

Hearing the Early Universe’s Scream: Sloan Survey Announces New Findings

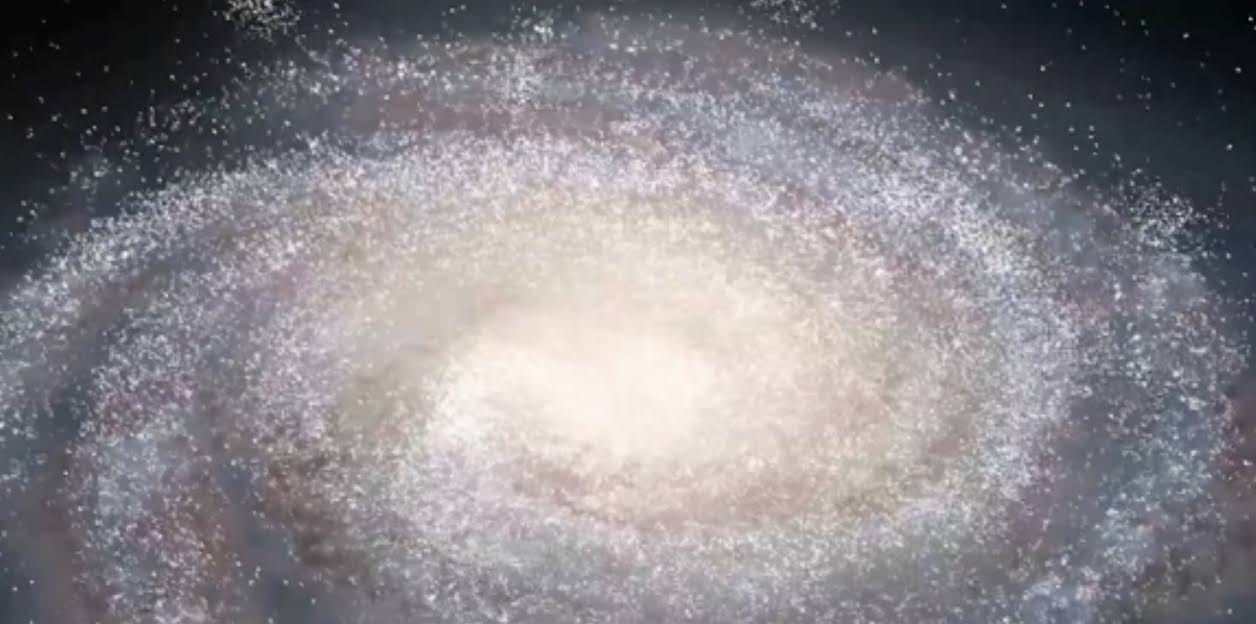
A still photo from an animated flythrough of the universe using SDSS data. This image shows our Milky Way Galaxy. The galaxy shape is an artist’s conception, and each of the small white dots is one of the hundreds of thousands of stars as seen by the SDSS. Image credit: Dana Berry / SkyWorks Digital, Inc. and Jonathan Bird (Vanderbilt University)

Imagine a single mission that would allow you to explore the Milky Way and beyond, investigating cosmic chemistry, hunting planets, mapping galactic structure, probing dark energy and analyzing the expansion of the wider Universe. Enter the Sloan Digital Sky Survey, a massive scientific collaboration that enables one thousand astronomers from 51 institutions around the world to do just that.

At Tuesday’s AAS briefing in Seattle, researchers announced the public release of data collected by the project’s latest incarnation, SDSS-III. This data release, termed “DR12,” represents the survey’s largest and most detailed collection of measurements yet: 2,000 nights’ worth of brand-new information about nearly 500 million stars and galaxies.

One component of SDSS is exploring dark energy by “listening” for acoustic oscillation signals from the the acceleration of the early Universe, and the team also shared a new animated “fly-through” of the Universe that was created using SDSS data.

The SDSS-III collaboration is based at the powerful 2.5-meter Sloan Foundation Telescope at the Apache Point Observatory in New Mexico. The project itself consists of four component surveys: BOSS, APOGEE, MARVELS, and SEGUE. Each of these surveys applies different trappings to the parent telescope in order to accomplish its own, unique goal.

BOSS (the Baryon Oscillation Spectroscopic Survey) visualizes the way that sound waves produced by interacting matter in the early Universe are reflected in the large-scale structure of our cosmos. These ancient imprints, which date back to the first 500,000 years after the Big Bang, are especially evident in high-redshift objects like luminous-red galaxies and quasars. Three-dimensional models created from BOSS observations will allow astronomers to track the expansion of the Universe over a span of 9 billion years, a feat that, later this year, will pave the way for rigorous assessment of current theories regarding dark energy.

At the press briefing, Daniel Eistenstein from the Harvard-Smithsonian Center for Astrophysics explained how BOSS requires huge volumes of data and that so far 1.4 million galaxies have been mapped. He indicated the data analyzed so far strongly confirm dark energy’s existence.

This tweet from the SDSS twitter account uses a bit of humor to explain how BOSS works:

APOGEE (the Apache Point Observatory Galactic Evolution Experiment) employs a sophisticated, near-infrared spectrograph to pierce through thick dust and gather light from 100,000 distant red giants. By analyzing the spectral lines that appear in this light, scientists can identify the signatures of 15 different chemical elements that make up the faraway stars – observations that will help researchers piece together the stellar history of our galaxy.

MARVELS (the Multi-Object APO Radial Velocity Exoplanet Large-Area Survey) identifies minuscule wobbles in the orbits of stars, movements that betray the gravitational influence of orbiting planets. The technology itself is unprecedented. “MARVELS is the first large-scale survey to measure these tiny motions for dozens of stars simultaneously,” explained the project’s principal investigator Jian Ge, “which means we can probe and characterize the full population of giant planets in ways that weren’t possible before.”

At the press briefing, Ge said that MARVELS observed 5,500 stars repeatedly, looking for giant exoplanets around these stars. So far, the data has revealed 51 giant planet candidates as well as 38 brown dwarf candidates. Ge added that more will be found with better data processing.

A still photo from an animated flythrough of the universe using SDSS data. This image shows a small part of the large-scale structure of the universe as seen by the SDSS -- just a few of many millions of galaxies. The galaxies are shown in their proper positions from SDSS data. Image credit: Dana Berry / SkyWorks Digital, Inc.
A still photo from an animated flythrough of the universe using SDSS data. This image shows a small part of the large-scale structure of the universe as seen by the SDSS — just a few of many millions of galaxies. The galaxies are shown in their proper positions from SDSS data. Image credit: Dana Berry / SkyWorks Digital, Inc.

SEGUE (the Sloan Extension for Galactic Understanding and Exploration) rounds out the quartet by analyzing visible light from 250,000 stars in the outer reaches of our galaxy. Coincidentally, this survey’s observations “segue” nicely into work being done by other projects within SDSS-III. Constance Rockosi, leader of the SDSS-III domain of SEGUE, recaps the importance of her project’s observations of our outer galaxy: “In combination with the much more detailed view of the inner galaxy from APOGEE, we’re getting a truly holistic picture of the Milky Way.”

One of the most exceptional attributes of SDSS-III is its universality; that is, every byte of juicy information contained in DR12 will be made freely available to professionals, amateurs, and lay public alike. This philosophy enables interested parties from all walks of life to contribute to the advancement of astronomy in whatever capacity they are able.

As momentous as the release of DR12 is for today’s astronomers, however, there is still much more work to be done. “Crossing the DR12 finish line is a huge accomplishment by hundreds of people,” said Daniel Eisenstein, director of the SDSS-III collaboration, “But it’s a big universe out there, so there is plenty more to observe.”

DR12 includes observations made by SDSS-III between July 2008 and June 2014. The project’s successor, SDSS-IV, began its run in July 2014 and will continue observing for six more years.

Here is the video animation of the fly-through of the Universe:

New Simulation Models Galaxies Like Never Before

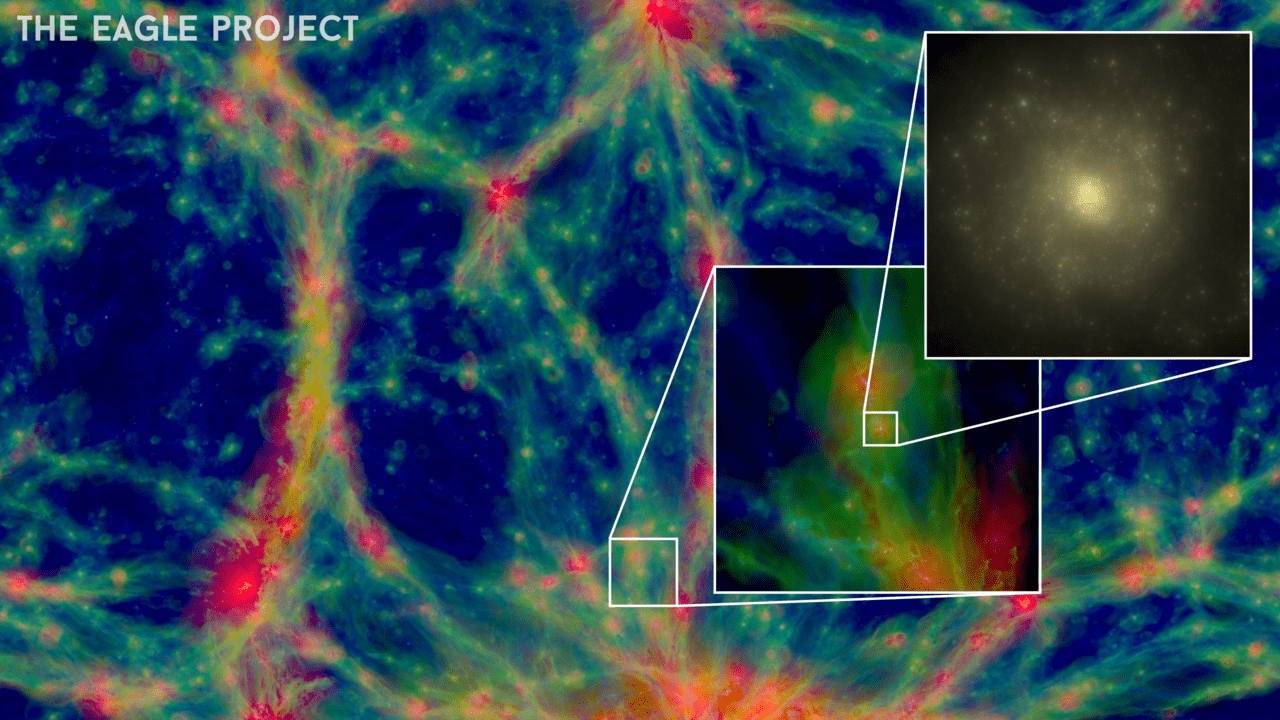
Zooming into an EAGLE galaxy. Credit: EAGLE Project Consortium/Schaye et al.

Astronomy is, by definition, intangible. Traditional laboratory-style experiments that utilize variables and control groups are of little use to the scientists who spend their careers analyzing the intricacies our Universe. Instead, astronomers rely on simulations – robust, mathematically-driven facsimiles of the cosmos – to investigate the long-term evolution of objects like stars, black holes, and galaxies. Now, a team of European researchers has broken new ground with their development of the EAGLE project: a simulation that, due to its high level of agreement between theory and observation, can be used to probe the earliest epochs of galaxy formation, over 13 billion years ago.

The EAGLE project, which stands for Evolution and Assembly of GaLaxies and their Environments, owes much of its increased accuracy to the better modeling of galactic winds. Galactic winds are powerful streams of charged particles that “blow” out of galaxies as a result of high-energy processes like star formation, supernova explosions, and the regurgitation of material by active galactic nuclei (the supermassive black holes that lie at the heart of most galaxies). These mighty winds tend to carry gas and dust out of the galaxy, leaving less material for continued star formation and overall growth.

Previous simulations were problematic for researchers because they produced galaxies that were far older and more massive than those that astronomers see today; however, EAGLE’s simulation of strong galactic winds fixes these anomalies. By accounting for characteristic, high-speed ejections of gas and dust over time, researchers found that younger and lighter galaxies naturally emerged.

After running the simulation on two European supercomputers, the Cosmology Machine at Durham University in England and Curie in France, the researchers concluded that the EAGLE project was a success. Indeed, the galaxies produced by EAGLE look just like those that astronomers expect to see when they look to the night sky. Richard Bower, a member of the team from Durham, raved, “The universe generated by the computer is just like the real thing. There are galaxies everywhere, with all the shapes, sizes and colours I’ve seen with the world’s largest telescopes. It is incredible.”

The upshots of this new work are not limited to scientists alone; you, too, can explore the Universe with EAGLE by downloading the team’s Cosmic Universe app. Videos of the EAGLE project’s simulations are also available on the team’s website.

A paper detailing the team’s work is published in the January 1 issue of Monthly Notices of the Royal Astronomical Society. A preprint of the results is available on the ArXiv.

NASA’s NuSTAR Scans the Sun with X-ray Vision

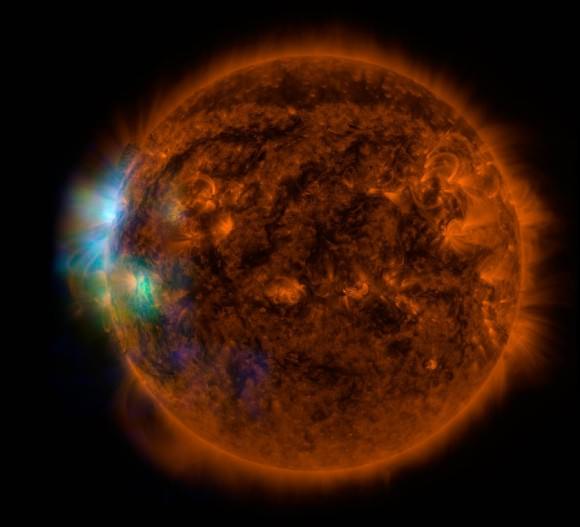
The west limb of the Sun imaged by NuSTAR and SDO shows areas of high-energy x-rays above particularly active regions (NASA/JPL-Caltech/GSFC)

What if you had x-ray vision like Superman? Or if those funny-looking glasses they advertised in comic books in the 60s actually worked?* Then with those our Sun might look something like this, lighting up with brilliant flares of high-energy x-rays as seen by NASA’s super-sensitive NuSTAR Space Telescope (with a little help from SDO.)

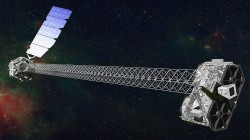
The NuStar Space Telescope launched into Earth orbit by a Orbital Science Corp. Pegasus rocket, 2012. The Wolter telescope design images throughout a spectral range from 5 to 80 KeV. (Credit: NASA/Caltech-JPL)
The NuStar Space Telescope launched aboard a Orbital Sciences Pegasus rocket, on June 13, 2012. (Credit: NASA/Caltech-JPL)

Of course NASA’s orbiting NuSTAR x-ray telescope is not like a typical medical imaging system. Instead of looking for broken bones, NuSTAR (short for Nuclear Spectroscopic Telescope Array) is made to detect high-energy particles blasting across the Universe from exotic objects like supermassive black holes, pulsars, and supernovae.

Read more: Stars Boil Before They Blow Up, Says NuSTAR

But astronomers suggested turning NuSTAR’s gaze upon our own Sun to see what sorts of x-ray activity may be going on there.

“At first I thought the whole idea was crazy,” said Fiona Harrison, a Professor of Physics and Astronomy at Caltech and PI for the NuSTAR mission. “Why would we have the most sensitive high energy X-ray telescope ever built, designed to peer deep into the universe, look at something in our own back yard?”

As it turns out NuSTAR was able to reveal some very interesting features on the Sun, showing where the corona is being heated to very high temperatures. The image above shows NuSTAR’s first observations, overlaid onto data acquired by NASA’s Solar Dynamics Observatory.

NuSTAR data is shown in green and blue, revealing high-energy emission around – but not exactly aligned with – active regions on the Sun where solar plasma is being heated to more than 3 million degrees. The red represents ultraviolet light captured by SDO and shows material in the solar atmosphere at a slightly cooler 1 million degrees.

The west limb of the Sun imaged by NuSTAR and SDO shows areas of high-energy x-rays near active regions and coronal loops (NASA/JPL-Caltech/GSFC)
The NuSTAR data overlaid on the full disk SDO image, rotated so north on the Sun is up. (NASA/JPL-Caltech/GSFC)

Because the Sun isn’t terribly intense in high energy x-ray output it’s safe to observe it with NuSTAR — it’s not likely to burn out the telescope’s sensors. But what NuSTAR can detect may help astronomers determine the exact mechanisms behind the intense coronal heating that occurs in and above the Sun’s chromosphere. If so-called “nanoflares” — miniature and as-yet-invisible versions of solar flares — are responsible, for instance, NuSTAR might be able to catch them in action for the first time.

Read more: Warm Coronal Loops May Hold the Key to Hot Solar Atmosphere

“NuSTAR will be exquisitely sensitive to the faintest X-ray activity happening in the solar atmosphere, and that includes possible nanoflares,” said David Smith, solar physicist and member of the NuSTAR team at the University of California, Santa Cruz.

In addition NuSTAR could potentially detect the presence of axions in the Sun’s core — hypothesized particles that may make up dark matter in the Universe.

NuSTAR may not be a “solar telescope” per se, but that won’t stop astronomers from using its unique abilities to learn more about the star we intimately share space with.

“NuSTAR will give us a unique look at the Sun, from the deepest to the highest parts of its atmosphere.”

– David Smith, solar physicist, University of California Santa Cruz

Read more in a JPL article here.

*I never did get my box of 100 army men, either. Then again, I may have ordered a few decades too late.

New Signal May Be Evidence of Dark Matter, Say Researchers

Dark Matter Halo and dwarf galaxies
All galaxies are thought to have a dark matter halo. This image shows the distribution of dark matter surrounding our very own Milky Way. Image credit: J. Diemand, M. Kuhlen and P. Madau (UCSC)

Dark matter is the architect of large-scale cosmic structure and the engine behind proper rotation of galaxies. It’s an indispensable part of the physics of our Universe – and yet scientists still don’t know what it’s made of. The latest data from Planck suggest that the mysterious substance comprises 26.2% of the cosmos, making it nearly five and a half times more prevalent than normal, everyday matter. Now, four European researchers have hinted that they may have a discovery on their hands: a signal in x-ray light that has no known cause, and may be evidence of a long sought-after interaction between particles – namely, the annihilation of dark matter.

When astronomers want to study an object in the night sky, such as a star or galaxy, they begin by analyzing its light across all wavelengths. This allows them to visualize narrow dark lines in the object’s spectrum, called absorption lines. Absorption lines occur because a star’s or galaxy’s component elements soak up light at certain wavelengths, preventing most photons with those energies from reaching Earth. Similarly, interacting particles can also leave emission lines in a star’s or galaxy’s spectrum, bright lines that are created when excess photons are emitted via subatomic processes such as excitement and decay. By looking closely at these emission lines, scientists can usually paint a robust picture of the physics going on elsewhere in the cosmos.

But sometimes, scientists find an emission line that is more puzzling. Earlier this year, researchers at the Laboratory of Particle Physics and Cosmology (LPPC) in Switzerland and Leiden University in the Netherlands identified an excess bump of energy in x-ray light coming from both the Andromeda galaxy and the Perseus star cluster: an emission line with an energy around 3.5keV. No known process can account for this line; however, it is consistent with models of the theoretical sterile neutrino – a particle that many scientists believe is a prime candidate for dark matter.

The researchers believe that this strange emission line could result from the annihilation, or decay, of these dark matter particles, a process that is thought to release x-ray photons. In fact, the signal appeared to be strongest in the most dense regions of Andromeda and Perseus and increasingly more diffuse away from the center, a distribution that is also characteristic of dark matter. Additionally, the signal was absent from the team’s observations of deep, empty space, implying that it is real and not just instrumental artifact.

In a pre-print of their paper, the researchers are careful to stress that the signal itself is weak by scientific standards. That is, they can only be 99.994% sure that it is a true result and not just a rogue statistical fluctuation, a level of confidence that is known as 4σ. (The gold standard for a discovery in science is 5σ: a result that can be declared “true” with 99.9999% confidence) Other scientists are not so sure that dark matter is such a good explanation after all. According to predictions made based on measurements of the Lyman-alpha forest – that is, the spectral pattern of hydrogen absorption and photon emission within very distant, very old gas clouds – any particle purporting to be dark matter should have an energy above 10keV – more than twice the energy of this most recent signal.

As always, the study of cosmology is fraught with mysteries. Whether this particular emission line turns out to be evidence of a sterile neutrino (and thus of dark matter) or not, it does appear to be a signal of some physical process that scientists do not yet understand. If future observations can increase the certainty of this discovery to the 5σ level, astrophysicists will have yet another phenomena to account for – an exciting prospect, regardless of the final result.

The team’s research has been accepted to Physical Review Letters and will be published in an upcoming issue.

New Cosmological Theory Goes Inflation-Free

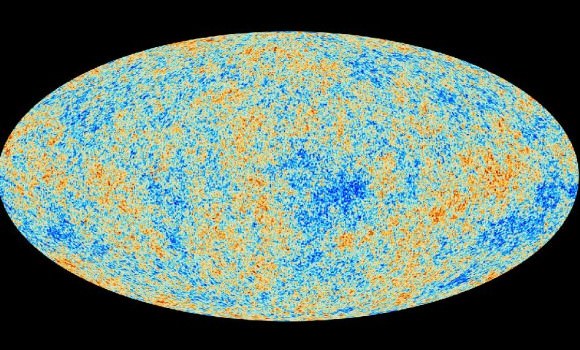
This image, the best map ever of the Universe, shows the oldest light in the universe. This glow, left over from the beginning of the cosmos called the cosmic microwave background, shows tiny changes in temperature represented by color. Credit: ESA and the Planck Collaboration.

The Cosmic Microwave Background (CMB) radiation is one of the greatest discoveries of modern cosmology. Astrophysicist George Smoot once likened its existence to “seeing the face of God.” In recent years, however, scientists have begun to question some of the attributes of the CMB. Peculiar patterns have emerged in the images taken by satellites such as WMAP and Planck – and they aren’t going away. Now, in a paper published in the December 1 issue of The Astronomical Journal, one scientist argues that the existence of these patterns may not only imply new physics, but also a revolution in our understanding of the entire Universe.

Let’s recap. Thanks to a blistering ambient temperature, the early Universe was blanketed in a haze for its first 380,000 years of life. During this time, photons relentlessly bombarded the protons and electrons created in the Big Bang, preventing them from combining to form stable atoms. All of this scattering also caused the photons’ energy to manifest as a diffuse glow. The CMB that cosmologists see today is the relic of this glow, now stretched to longer, microwave wavelengths due to the expansion of the Universe.

As any fan of the WMAP and Planck images will tell you, the hallmarks of the CMB are the so-called anisotropies, small regions of overdensity and underdensity that give the picture its characteristic mottled appearance. These hot and cold spots are thought to be the result of tiny quantum fluctuations born at the beginning of the Universe and magnified exponentially during inflation.

Temperature and polarization around hot and cold spots (Credit: NASA / WMAP Science Team)

Given the type of inflation that cosmologists believe occurred in the very early Universe, the distribution of these anisotropies in the CMB should be random, on the order of a Gaussian field. But both WMAP and Planck have confirmed the existence of certain oddities in the fog: a large “cold spot,” strange alignments in polarity known as quadrupoles and octupoles, and, of course, Stephen Hawking’s initials.

In his new paper, Fulvio Melia of the University of Arizona argues that these types of patterns (Dr. Hawking’s signature notwithstanding) reveal a problem with the standard inflationary picture, or so-called ΛCDM cosmology. According to his calculations, inflation should have left a much more random assortment of anisotropies than the one that scientists see in the WMAP and Planck data. In fact, the probability of these particular anomalies lining up the way they do in the CMB images is only about 0.005% for a ΛCDM Universe.

Melia posits that the anomalous patterns in the CMB can be better explained by a new type of cosmology in which no inflation occurred. He calls this model the R(h)=ct Universe, where c is the speed of light, t is the age of the cosmos, and R(h) is the Hubble radius – the distance beyond which light will never reach Earth. (This equation makes intuitive sense: Light, traveling at light speed (c) for 13.7 billion years (t), should travel an equivalent number of light-years. In fact, current estimates of the Hubble radius put its value at about 13.4 billion light-years, which is remarkably close to the more tightly constrained value of the Universe’s age.)

R(h)=ct holds true for both the standard cosmological scenario and Melia’s model, with one crucial difference: in ΛCDM cosmology, this equation only works for the current age of the Universe. That is, at any time in the distant past or future, the Universe would have obeyed a different law. Scientists explain this odd coincidence by positing that the Universe first underwent inflation, then decelerated, and finally accelerated again to its present rate.

Melia hopes that his model, a Universe that requires no inflation, will provide an alternative explanation that does not rely on such fine-tuning. He calculates that, in a R(h)=ct Universe, the probability of seeing the types of strange patterns that have been observed in the CMB by WMAP and Planck is 7–10%, compared with a figure 1000 times lower for the standard model.

So, could this new way of looking at the cosmos be a death knell for ΛCDM? Probably not. Melia himself cites a few less earth-shattering explanations for the anomalous signals in the CMB, including foreground noise, statistical biases, and instrumental errors. Incidentally, the Planck satellite is scheduled to release its latest image of the CMB this week at a conference in Italy. If these new results show the same patterns of polarity that previous observations did, cosmologists will have to look into each possible explanation, including Melia’s theory, more intensively.

Higgs Boson Threatened The Early Universe, But Gravity Saved The Day

Image Credit: Science/AAAS

All the physical properties of our Universe – indeed, the fact that we even exist within a Universe that we can contemplate and explore – owe to events that occurred very early in its history. Cosmologists believe that our Universe looks the way it does thanks to a rapid period of inflation immediately before the Big Bang that smoothed fluctuations in the vacuum energy of space and flattened out the fabric of the cosmos itself.

According to current theories, however, interactions between the famed Higgs boson and the inflationary field should have caused the nascent Universe to collapse. Clearly, this didn’t happen. So what is going on? Scientists have worked out a new theory: It was gravity that (literally) held it all together.

The interaction between the curvature of spacetime (more commonly known as gravity) and the Higgs field has never been well understood. Resolving the apparent problem of our Universe’s stubborn existence, however, provides a good excuse to do some investigating. In a paper published this week in Physical Review Letters, researchers from the University of Copenhagen, the University of Helsinki, and Imperial College London show that even a small interaction between gravity and the Higgs would have been sufficient to stave off a collapse of the early cosmos.

The researchers modified the Higgs equations to include the effect of gravity generated by UV-scale energies. These corrections were found to stabilize the inflationary vacuum at all but a narrow range of energies, allowing expansion to continue and the Universe as we know it to exist… without the need for new physics beyond the Standard Model.

This new theory is based on the controversial evidence of inflation announced by BICEP2 earlier this summer, so its true applicability will depend on whether or not those results turn out to be real. Until then, the researchers are hoping to support their work with additional observational studies that seek out gravitational waves and more deeply examine the cosmic microwave background.

At this juncture, the Higgs-gravity interaction is not a testable hypothesis because the graviton (the particle that handles all of gravity’s interactions) itself has yet to be detected. Based purely on the mathematics, however, the new theory presents an elegant and efficient solution to the potential conundrum of why we exist at all.